Business Decision-Making Report: Data Analysis and Survey Methodology
VerifiedAdded on 2020/01/28
|16
|3953
|51
Report
AI Summary
This report provides a comprehensive analysis of business decision-making, focusing on DG Fashions. It begins by exploring the importance of data in decision-making, differentiating between primary and secondary data sources, and discussing various data collection techniques. The report then delves into survey methodology, including the use of questionnaires and sampling methods like stratified sampling, to gather relevant information about DG Fashions' production capacity and consumer behavior. Furthermore, it examines the application of statistical tools such as mean, median, mode, standard deviation, and quartiles to analyze data and identify trends. The report also covers the coefficient of skewness and its significance in understanding data distribution. Overall, the report provides a detailed overview of the business decision-making process, offering valuable insights into data analysis, survey methods, and statistical techniques that can be applied to improve business outcomes for DG Fashions.

BUSINESS DECISION-
MAKING
MAKING
Paraphrase This Document
Need a fresh take? Get an instant paraphrase of this document with our AI Paraphraser
Table of Contents
INTRODUCTION...........................................................................................................................3
TASK.1 ...........................................................................................................................................3
1.1...........................................................................................................................................3
1.2...........................................................................................................................................4
1.3...........................................................................................................................................5
M.1..........................................................................................................................................6
TASK.2............................................................................................................................................7
2.1...........................................................................................................................................7
2.2...........................................................................................................................................7
2.3...........................................................................................................................................8
2.4...........................................................................................................................................9
3.1.........................................................................................................................................10
3.2.........................................................................................................................................11
3.3 COVERED IN PPT........................................................................................................11
TASK.4..........................................................................................................................................11
4.1.........................................................................................................................................11
4.2.........................................................................................................................................13
4.3.........................................................................................................................................14
CONCLUSION..............................................................................................................................15
REFERENCES..............................................................................................................................16
INTRODUCTION
This has been seen that the business decision making of the company is most crucial
concern of the firm so that the firm could attain the objectives within a time frame. There are so
many tools which could affect the decisions of the firm (Kline, 2010). Decision making is the
though process which selected the logical alternatives from the available options. At the time of
taking better decisions, a person must acknowledge the positive and negative aspects of each
aspects. For making efficient decisions, an individuals is required to predict the outcomes of each
option, and then determine the best alternative. Business decision making is a tough task which
ultimately depends on the skills of the managers and top level authorities of DG fashions.
TASK.1
1.1
Data are the important tool for making any decisions which are relevant for the DG
fashions. Data are statistics, explanations, versus, photographs, chart etc. mainly the data are of
two types which is primary or secondary, and these are further categorised as quantitative and
qualitative data. These are described in details:
Primary data: The data which have been collated for the first time. This has been seen
that the data are collected through surveys, interviews, research or by observations. This is fresh
as used for the first time(Kimmel, Weygandt and Kieso, 2010.). The reliability of this data is
more as compared to the secondary one. This is the data which requires the huge resources to
collect and conduct as per the plan. This is the most successful and reliable source of data
collection, but there is a limitation of primary data gathering i.e. time consuming and much
expensive process.
Secondary data: This is the most usable data collection technique and most of the firms
are using this tool to make their business decisions viable for the attainment of the business
goals. Now this has been seen that the data of the company is now been seen that the company is
now getting the majority of the information (Vercellis, 2011). The secondary sources are
journals, books, magazines and any other mode of informations which are already getting
published at somewhere. Now, DG fashions intend to search the information which are relevant
to the firm and aids in making the decisions. Company's specialised SME's will filter the data
⊘ This is a preview!⊘
Do you want full access?
Subscribe today to unlock all pages.
Trusted by 1+ million students worldwide
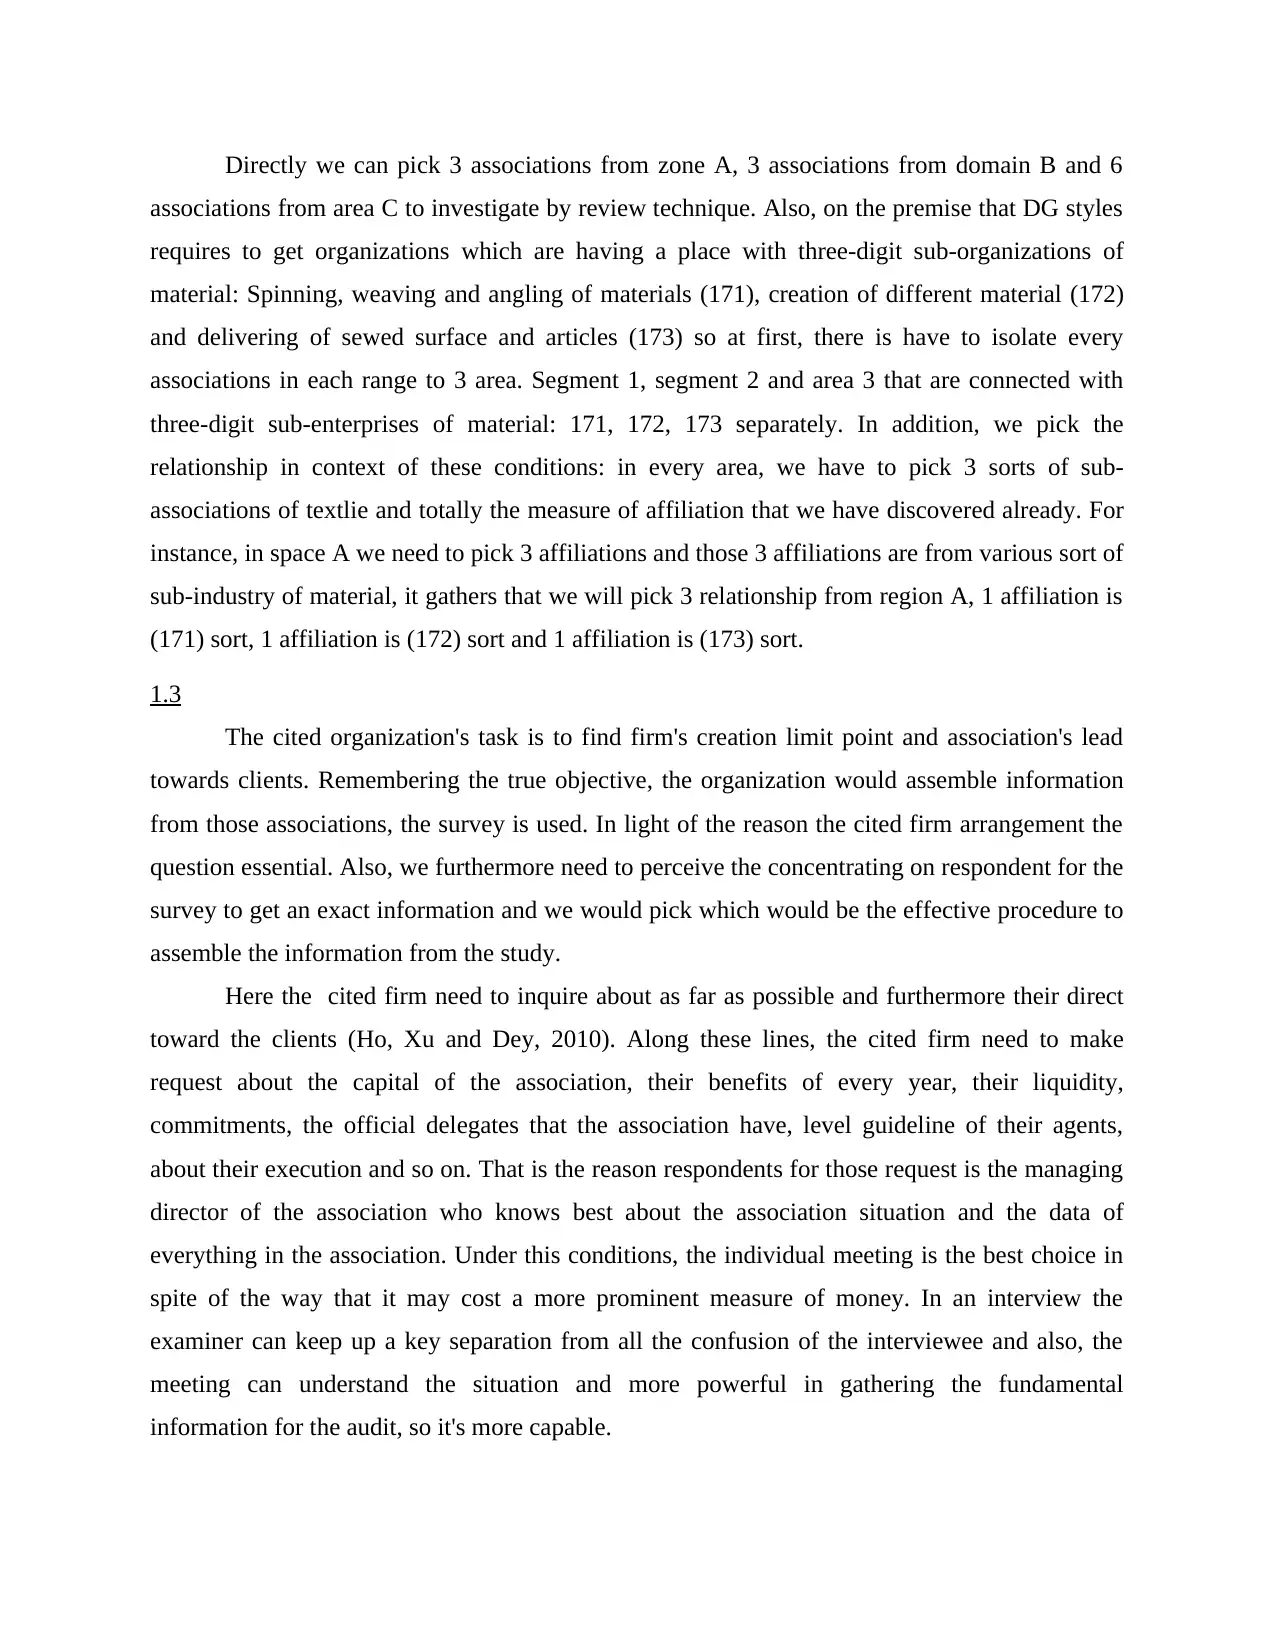
that are relevant to the DG fashions. If the company have less time to search the information on a
primary basis then it will go to the secondary data collection process.
1.2
Survey methodology is a tool which his used to collect the data from the most particular
area. Under the given scenario, the collected data is usable as per the requirement of the cited
entity, The survey includes the respondents liking or disliking, economic value additions,
knowledge about the item, ideas to enhance the inventions etc. the survey are usually conducted
mostly in two manner (Hwang and Yoon, 2012). Which is the interviews and questionnaires.
This could be made by the qualitative assessment or quantitative framed methodologies. On the
other hand, there are two sampling things which are probabilities and non probabilities, as these
are the different sampling methodologies. The probability methodology is the simple random
sampling method. While on the other hand, non probability sampling methods are snowball
sample, quota sampling. Under this circumstances, there is need to utilise the questionnaire
containing open ended and close ended questions within it. After having the sampling frame, the
DG fashions still stick to pick the sampling frame used for reviewing of the cited firm's
production capacity and their attitude towards consumers (Hwang and Masud, 2012). Because of
the unessential and wasting time and money, the firm can not evaluate entire companies which
are in the list. They only choose a few of the organisations to represent for the remaining by
utilising sampling methods to limiting the range of the firm where the survey as been made.
Take an instance in utilising stratified methods to pick out sample:
Total: 60 textile organizations
Accept that we are taking 12 from 60 textile organizations to examination.
The initial measure is need to compute the rate of every group
How many % textile organization in area A: 15/60.100% = 25%
% textile organization in area B: 15/60.100% = 25%
% textile organization in area C: 30/60.100% = half
So that DG fashions 12 tests must be:
20% of the textile organization in area A = (25x12)/100 = 3 organizations
40% of the textile organization in area B= (25x12)/100= 3 organizations
40% of the textile organization in area C= (50x12)/100= 6 organizations.
Paraphrase This Document
Need a fresh take? Get an instant paraphrase of this document with our AI Paraphraser
Directly we can pick 3 associations from zone A, 3 associations from domain B and 6
associations from area C to investigate by review technique. Also, on the premise that DG styles
requires to get organizations which are having a place with three-digit sub-organizations of
material: Spinning, weaving and angling of materials (171), creation of different material (172)
and delivering of sewed surface and articles (173) so at first, there is have to isolate every
associations in each range to 3 area. Segment 1, segment 2 and area 3 that are connected with
three-digit sub-enterprises of material: 171, 172, 173 separately. In addition, we pick the
relationship in context of these conditions: in every area, we have to pick 3 sorts of sub-
associations of textlie and totally the measure of affiliation that we have discovered already. For
instance, in space A we need to pick 3 affiliations and those 3 affiliations are from various sort of
sub-industry of material, it gathers that we will pick 3 relationship from region A, 1 affiliation is
(171) sort, 1 affiliation is (172) sort and 1 affiliation is (173) sort.
1.3
The cited organization's task is to find firm's creation limit point and association's lead
towards clients. Remembering the true objective, the organization would assemble information
from those associations, the survey is used. In light of the reason the cited firm arrangement the
question essential. Also, we furthermore need to perceive the concentrating on respondent for the
survey to get an exact information and we would pick which would be the effective procedure to
assemble the information from the study.
Here the cited firm need to inquire about as far as possible and furthermore their direct
toward the clients (Ho, Xu and Dey, 2010). Along these lines, the cited firm need to make
request about the capital of the association, their benefits of every year, their liquidity,
commitments, the official delegates that the association have, level guideline of their agents,
about their execution and so on. That is the reason respondents for those request is the managing
director of the association who knows best about the association situation and the data of
everything in the association. Under this conditions, the individual meeting is the best choice in
spite of the way that it may cost a more prominent measure of money. In an interview the
examiner can keep up a key separation from all the confusion of the interviewee and also, the
meeting can understand the situation and more powerful in gathering the fundamental
information for the audit, so it's more capable.
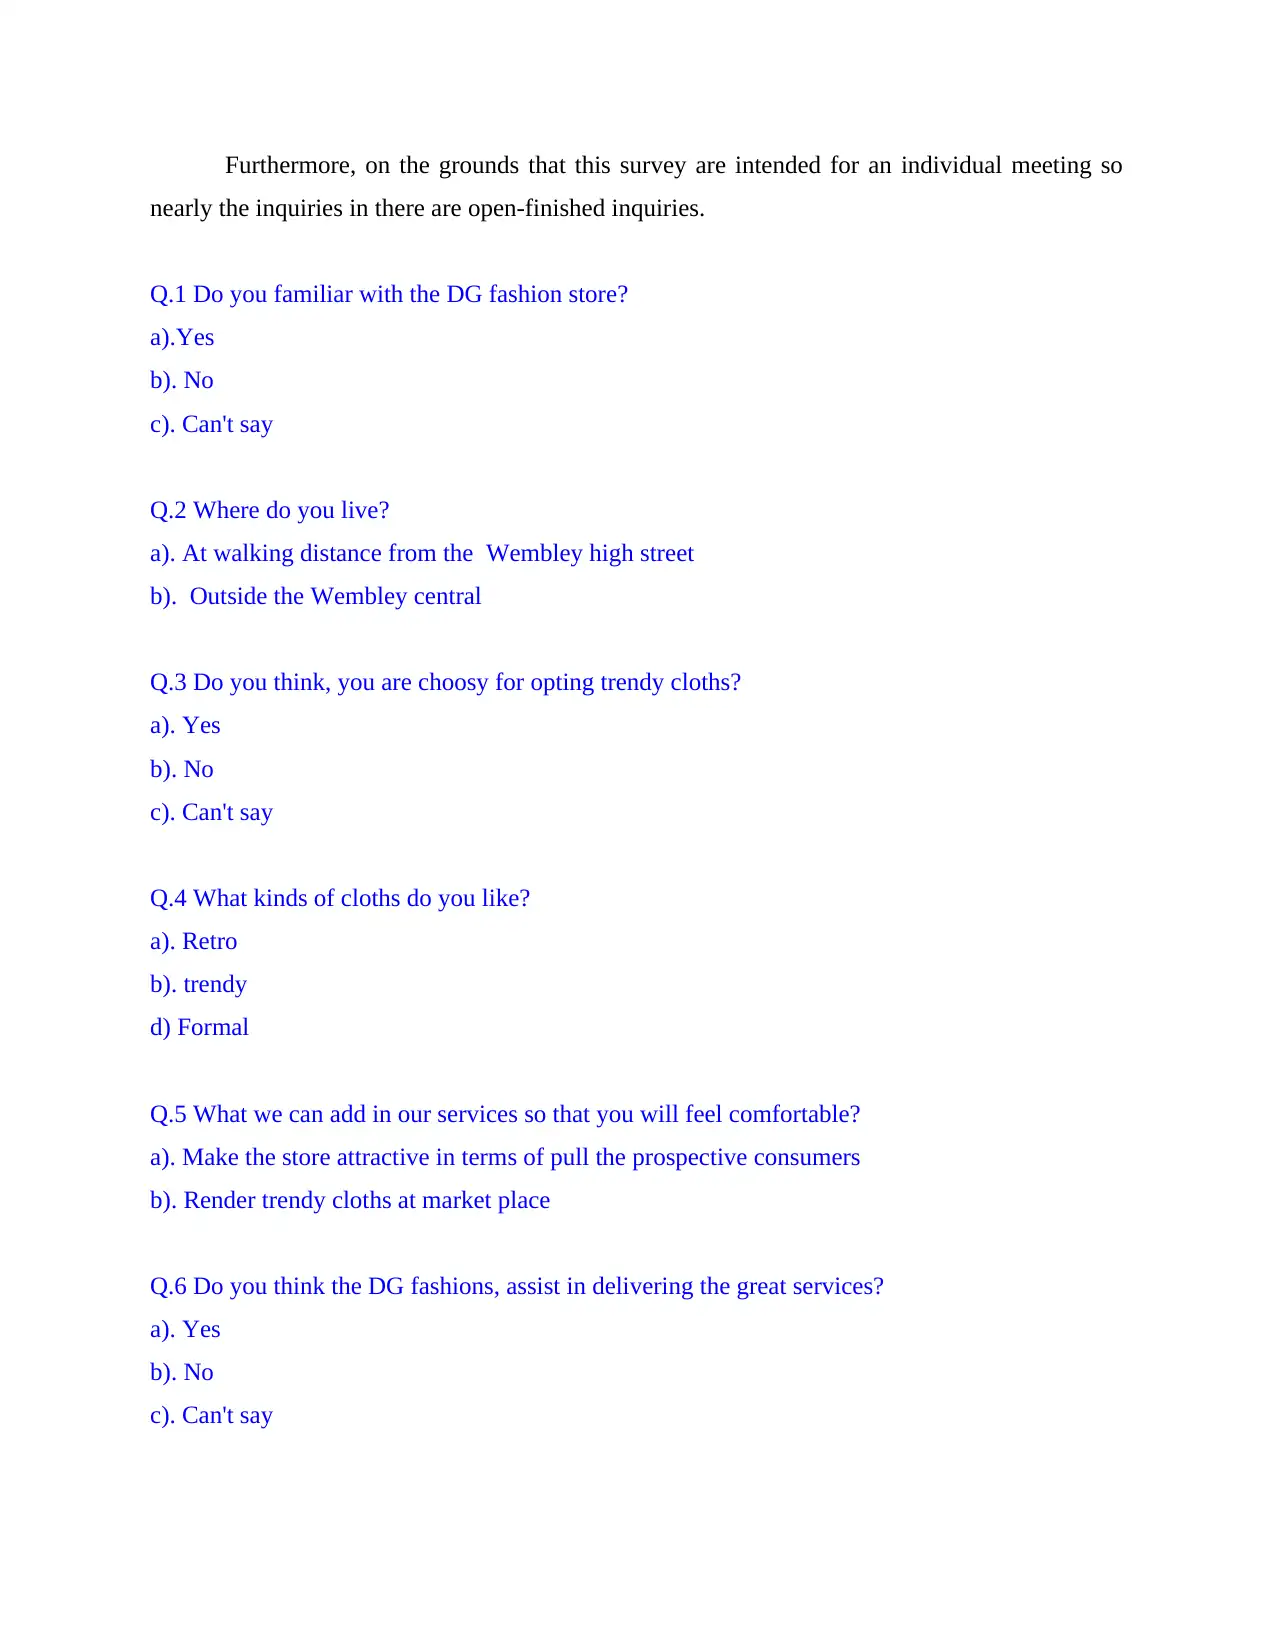
Furthermore, on the grounds that this survey are intended for an individual meeting so
nearly the inquiries in there are open-finished inquiries.
Q.1 Do you familiar with the DG fashion store?
a).Yes
b). No
c). Can't say
Q.2 Where do you live?
a). At walking distance from the Wembley high street
b). Outside the Wembley central
Q.3 Do you think, you are choosy for opting trendy cloths?
a). Yes
b). No
c). Can't say
Q.4 What kinds of cloths do you like?
a). Retro
b). trendy
d) Formal
Q.5 What we can add in our services so that you will feel comfortable?
a). Make the store attractive in terms of pull the prospective consumers
b). Render trendy cloths at market place
Q.6 Do you think the DG fashions, assist in delivering the great services?
a). Yes
b). No
c). Can't say
⊘ This is a preview!⊘
Do you want full access?
Subscribe today to unlock all pages.
Trusted by 1+ million students worldwide
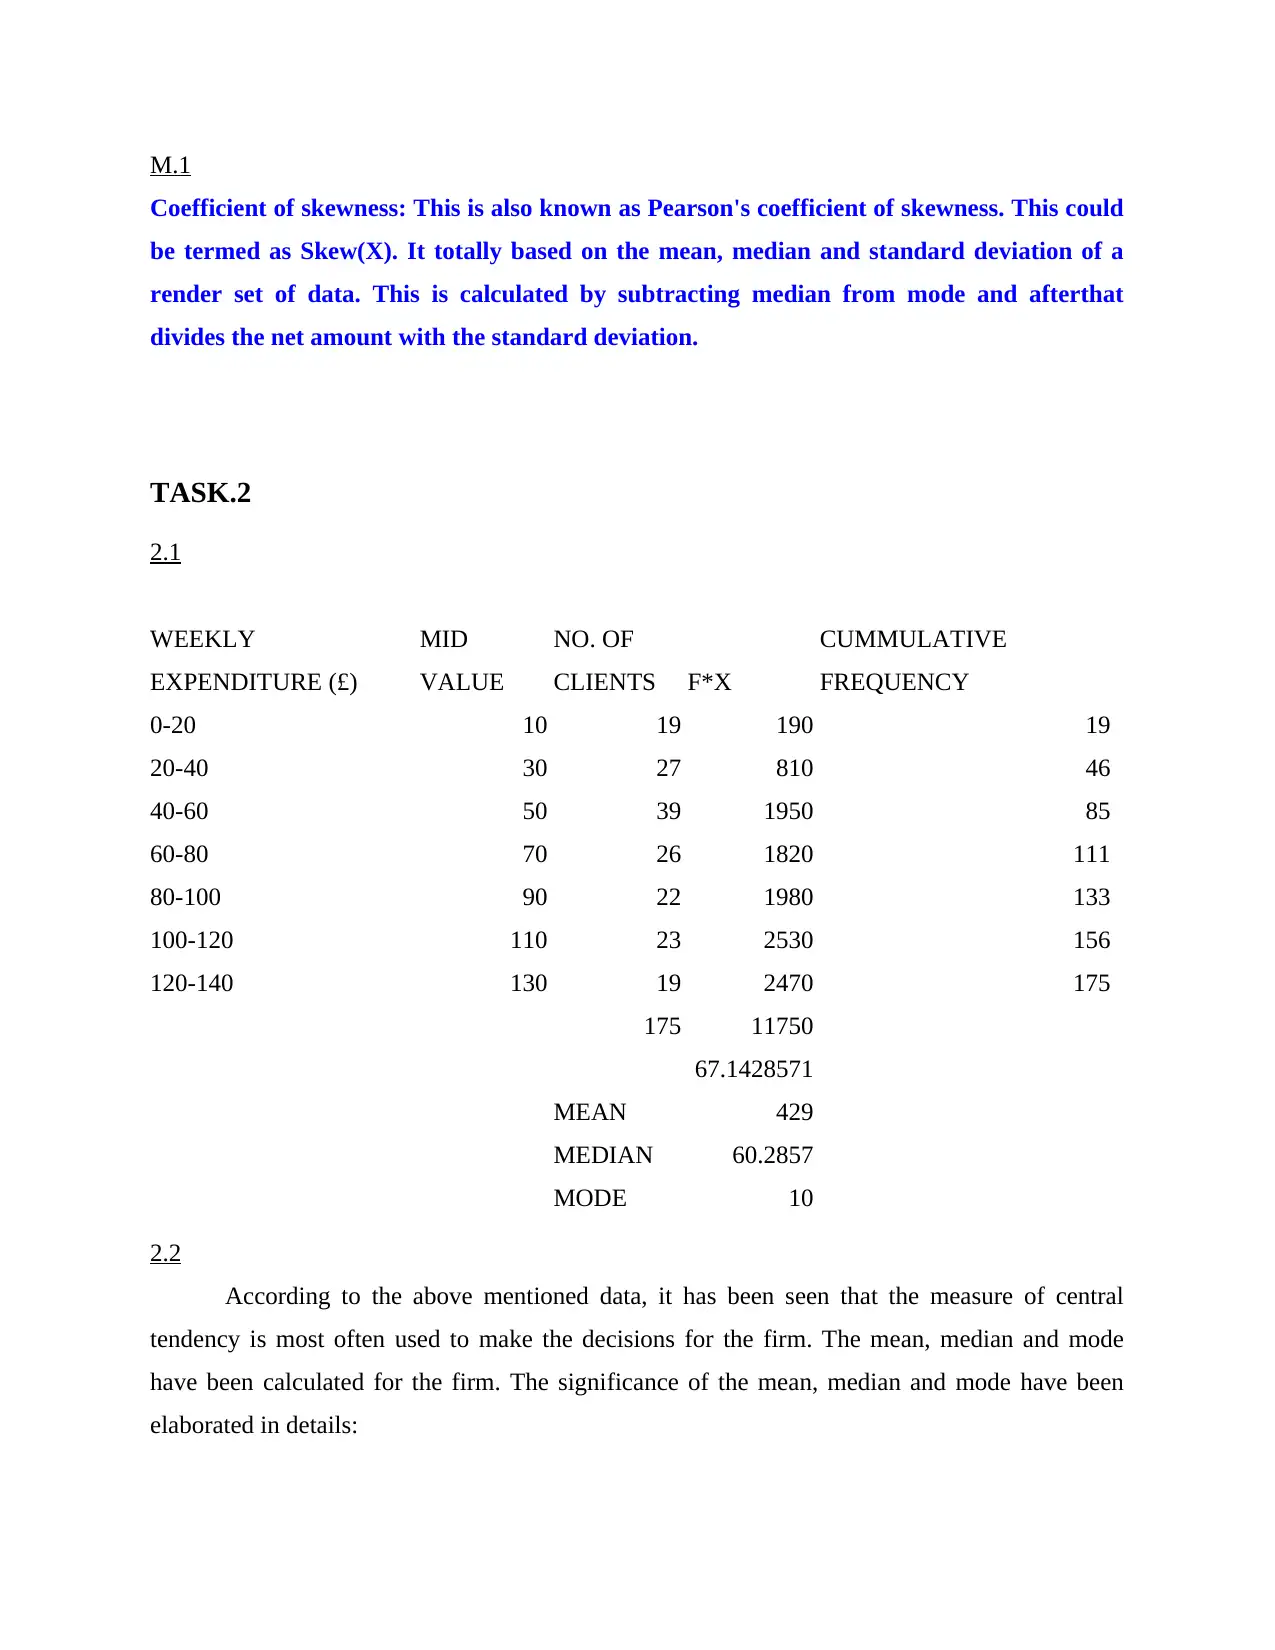
M.1
Coefficient of skewness: This is also known as Pearson's coefficient of skewness. This could
be termed as Skew(X). It totally based on the mean, median and standard deviation of a
render set of data. This is calculated by subtracting median from mode and afterthat
divides the net amount with the standard deviation.
TASK.2
2.1
WEEKLY
EXPENDITURE (£)
MID
VALUE
NO. OF
CLIENTS F*X
CUMMULATIVE
FREQUENCY
0-20 10 19 190 19
20-40 30 27 810 46
40-60 50 39 1950 85
60-80 70 26 1820 111
80-100 90 22 1980 133
100-120 110 23 2530 156
120-140 130 19 2470 175
175 11750
MEAN
67.1428571
429
MEDIAN 60.2857
MODE 10
2.2
According to the above mentioned data, it has been seen that the measure of central
tendency is most often used to make the decisions for the firm. The mean, median and mode
have been calculated for the firm. The significance of the mean, median and mode have been
elaborated in details:
Paraphrase This Document
Need a fresh take? Get an instant paraphrase of this document with our AI Paraphraser
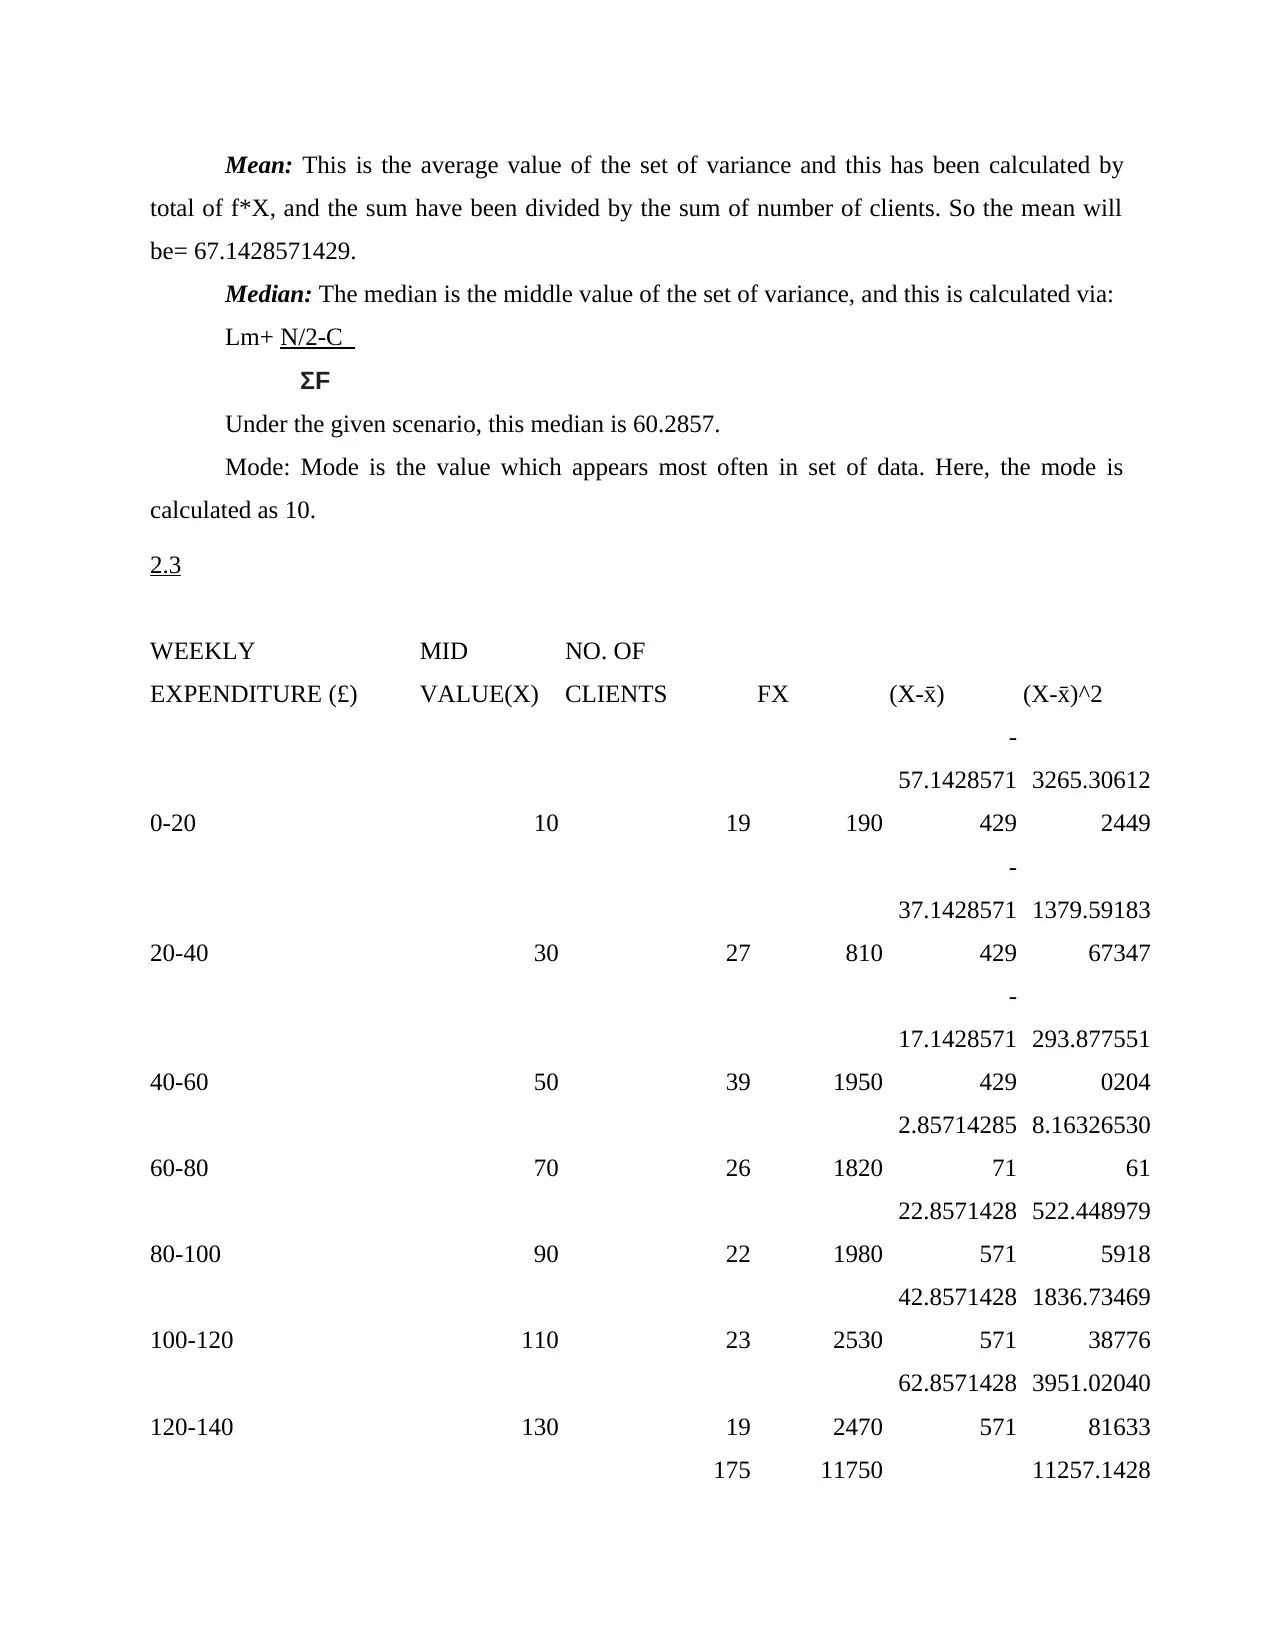
Mean: This is the average value of the set of variance and this has been calculated by
total of f*X, and the sum have been divided by the sum of number of clients. So the mean will
be= 67.1428571429.
Median: The median is the middle value of the set of variance, and this is calculated via:
Lm+ N/2-C
ΣF
Under the given scenario, this median is 60.2857.
Mode: Mode is the value which appears most often in set of data. Here, the mode is
calculated as 10.
2.3
WEEKLY
EXPENDITURE (£)
MID
VALUE(X)
NO. OF
CLIENTS FX (X-x̄) (X-x̄)^2
0-20 10 19 190
-
57.1428571
429
3265.30612
2449
20-40 30 27 810
-
37.1428571
429
1379.59183
67347
40-60 50 39 1950
-
17.1428571
429
293.877551
0204
60-80 70 26 1820
2.85714285
71
8.16326530
61
80-100 90 22 1980
22.8571428
571
522.448979
5918
100-120 110 23 2530
42.8571428
571
1836.73469
38776
120-140 130 19 2470
62.8571428
571
3951.02040
81633
175 11750 11257.1428
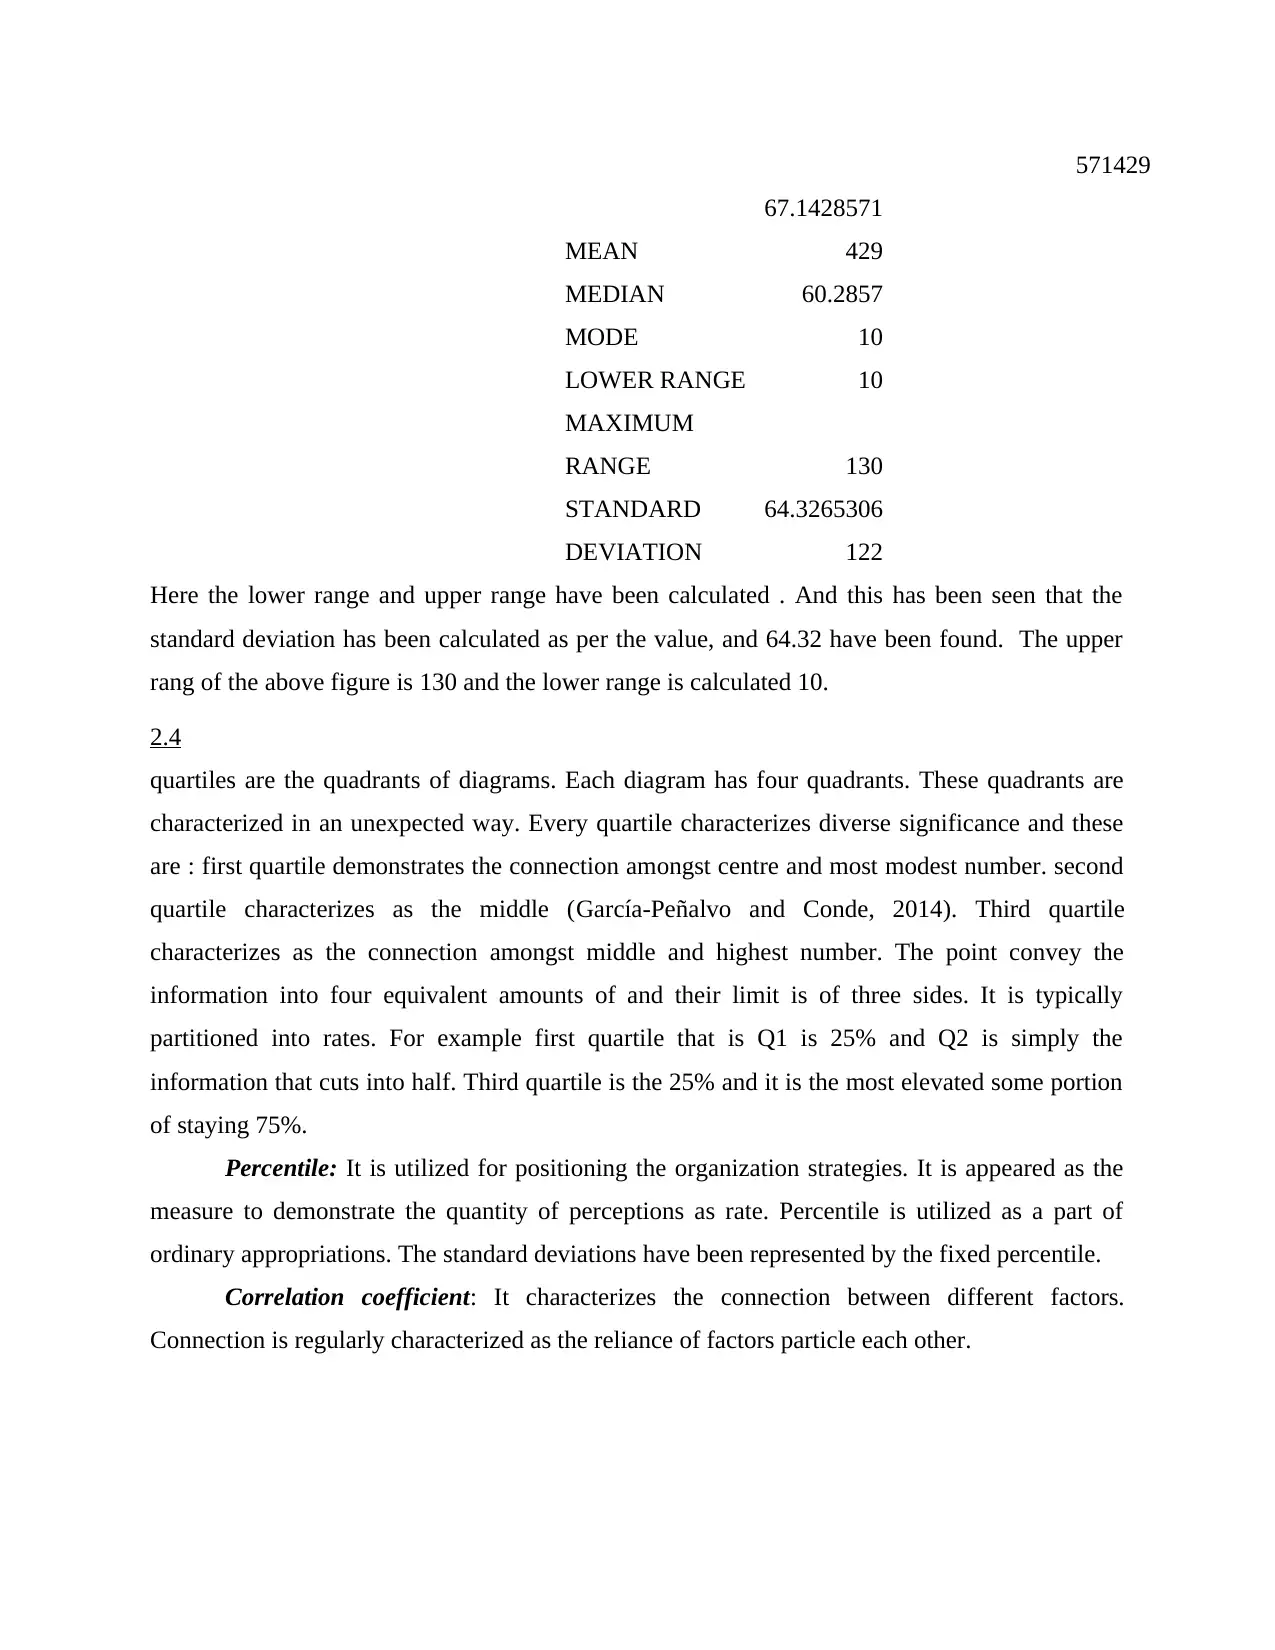
571429
MEAN
67.1428571
429
MEDIAN 60.2857
MODE 10
LOWER RANGE 10
MAXIMUM
RANGE 130
STANDARD
DEVIATION
64.3265306
122
Here the lower range and upper range have been calculated . And this has been seen that the
standard deviation has been calculated as per the value, and 64.32 have been found. The upper
rang of the above figure is 130 and the lower range is calculated 10.
2.4
quartiles are the quadrants of diagrams. Each diagram has four quadrants. These quadrants are
characterized in an unexpected way. Every quartile characterizes diverse significance and these
are : first quartile demonstrates the connection amongst centre and most modest number. second
quartile characterizes as the middle (García-Peñalvo and Conde, 2014). Third quartile
characterizes as the connection amongst middle and highest number. The point convey the
information into four equivalent amounts of and their limit is of three sides. It is typically
partitioned into rates. For example first quartile that is Q1 is 25% and Q2 is simply the
information that cuts into half. Third quartile is the 25% and it is the most elevated some portion
of staying 75%.
Percentile: It is utilized for positioning the organization strategies. It is appeared as the
measure to demonstrate the quantity of perceptions as rate. Percentile is utilized as a part of
ordinary appropriations. The standard deviations have been represented by the fixed percentile.
Correlation coefficient: It characterizes the connection between different factors.
Connection is regularly characterized as the reliance of factors particle each other.
⊘ This is a preview!⊘
Do you want full access?
Subscribe today to unlock all pages.
Trusted by 1+ million students worldwide
3.1
1
2
3
4
5
6
7
8
9
10
0 5 10 15 20 25 30 35 40 45 50
20
23
24
30
31
31
32
35
39
43
12
13
15
16
19
21
22
24
25
27
8
10
9
14
12
10
10
11
14
16
bar chart
Sales(£m)
Cost(£m)
Profit(£m)
20
23
24
30
31
31 32
35
39
43
pie chart
1
2
3
4
5
6
7
8
9
10
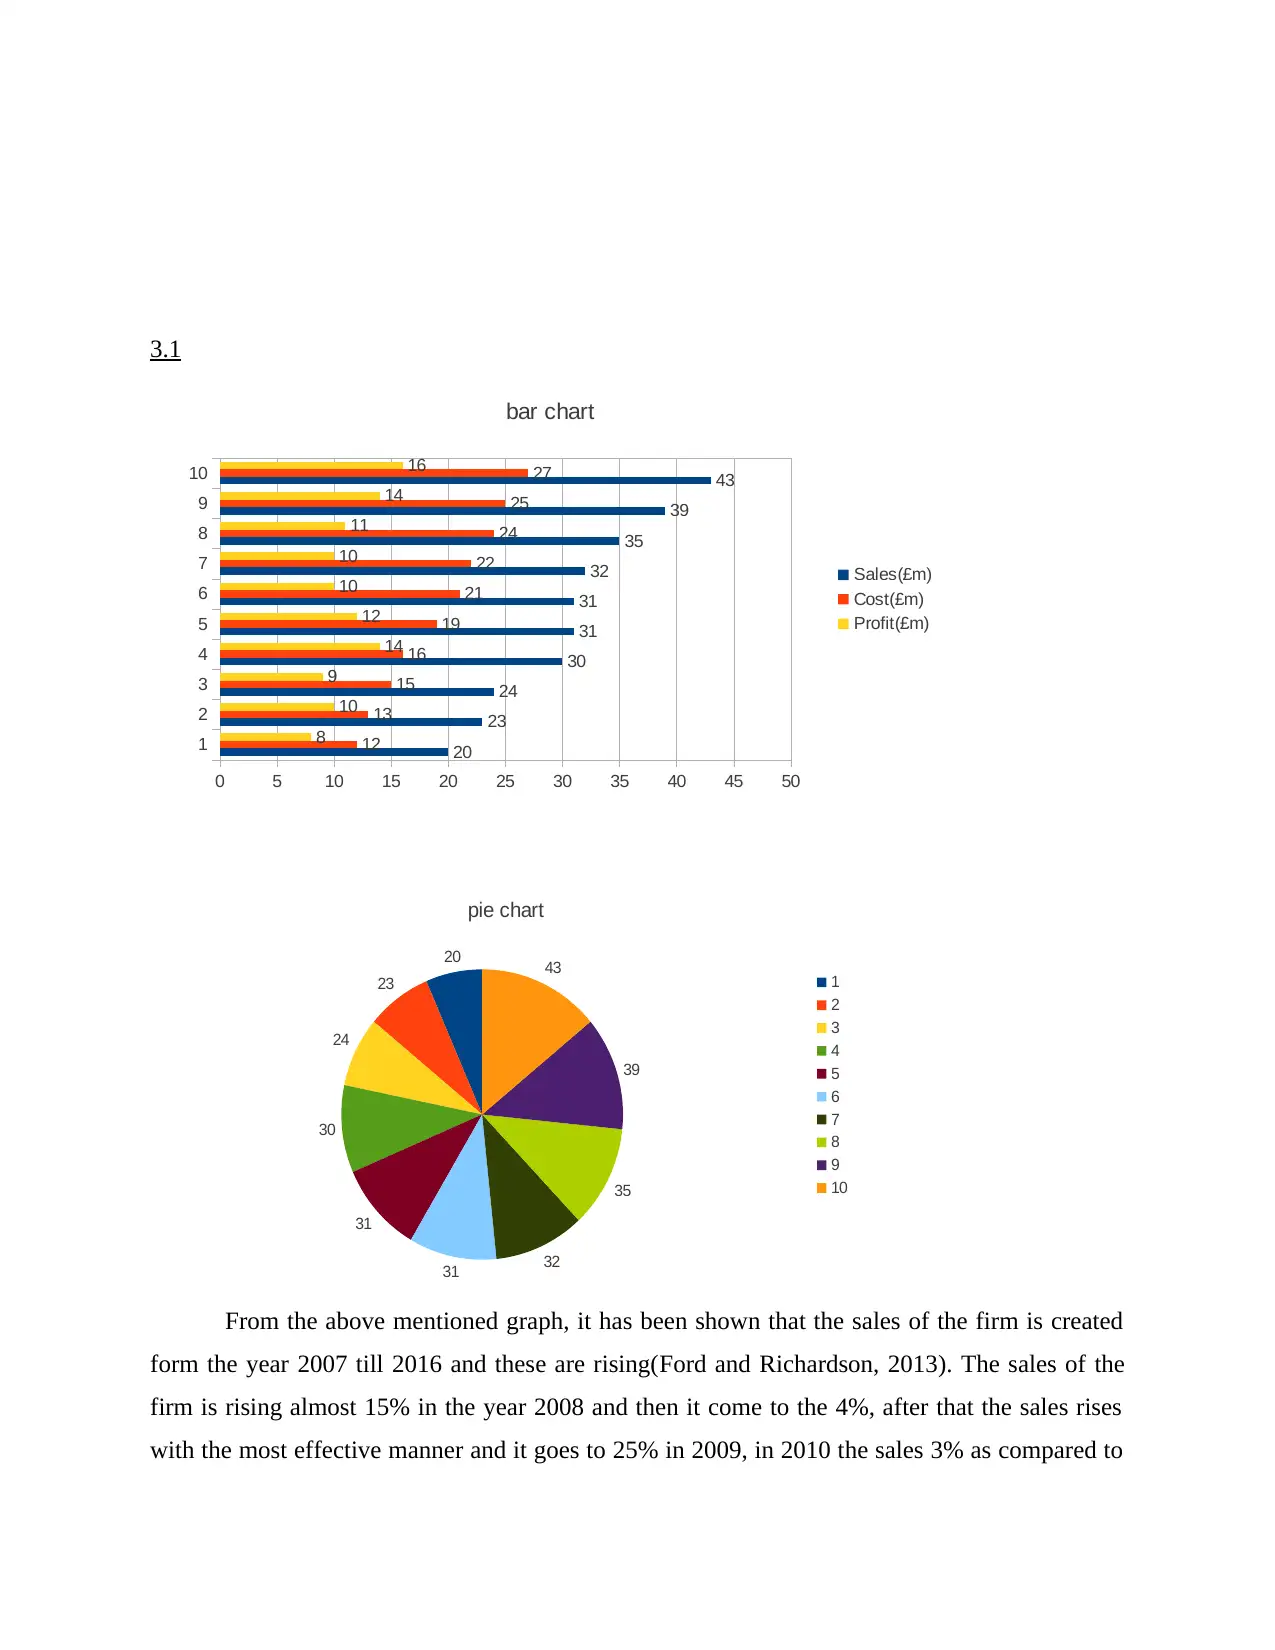
From the above mentioned graph, it has been shown that the sales of the firm is created
form the year 2007 till 2016 and these are rising(Ford and Richardson, 2013). The sales of the
firm is rising almost 15% in the year 2008 and then it come to the 4%, after that the sales rises
with the most effective manner and it goes to 25% in 2009, in 2010 the sales 3% as compared to
1
2
3
4
5
6
7
8
9
10
0 5 10 15 20 25 30 35 40 45 50
20
23
24
30
31
31
32
35
39
43
12
13
15
16
19
21
22
24
25
27
8
10
9
14
12
10
10
11
14
16
bar chart
Sales(£m)
Cost(£m)
Profit(£m)
20
23
24
30
31
31 32
35
39
43
pie chart
1
2
3
4
5
6
7
8
9
10
From the above mentioned graph, it has been shown that the sales of the firm is created
form the year 2007 till 2016 and these are rising(Ford and Richardson, 2013). The sales of the
firm is rising almost 15% in the year 2008 and then it come to the 4%, after that the sales rises
with the most effective manner and it goes to 25% in 2009, in 2010 the sales 3% as compared to
Paraphrase This Document
Need a fresh take? Get an instant paraphrase of this document with our AI Paraphraser
the 2009 sales. The growth will go continuously till 2016 and this has been seen that in 2016 the
growth in sales was seen about 10%. while on the other hand, the cost is also rises. And this have
been closely link to the sales of the company. In the initial years, it has been seen that the cost of
the company is about 60%.and the profits of the firm stick to 40%. which is much higher than
the others.
3.2
1 2 3 4 5 6 7 8 9 10
0
5
10
15
20
25
30
35
40
45
50
Sales(£m)
Linear (Sales(£m))
Cost(£m)
Profit(£m)
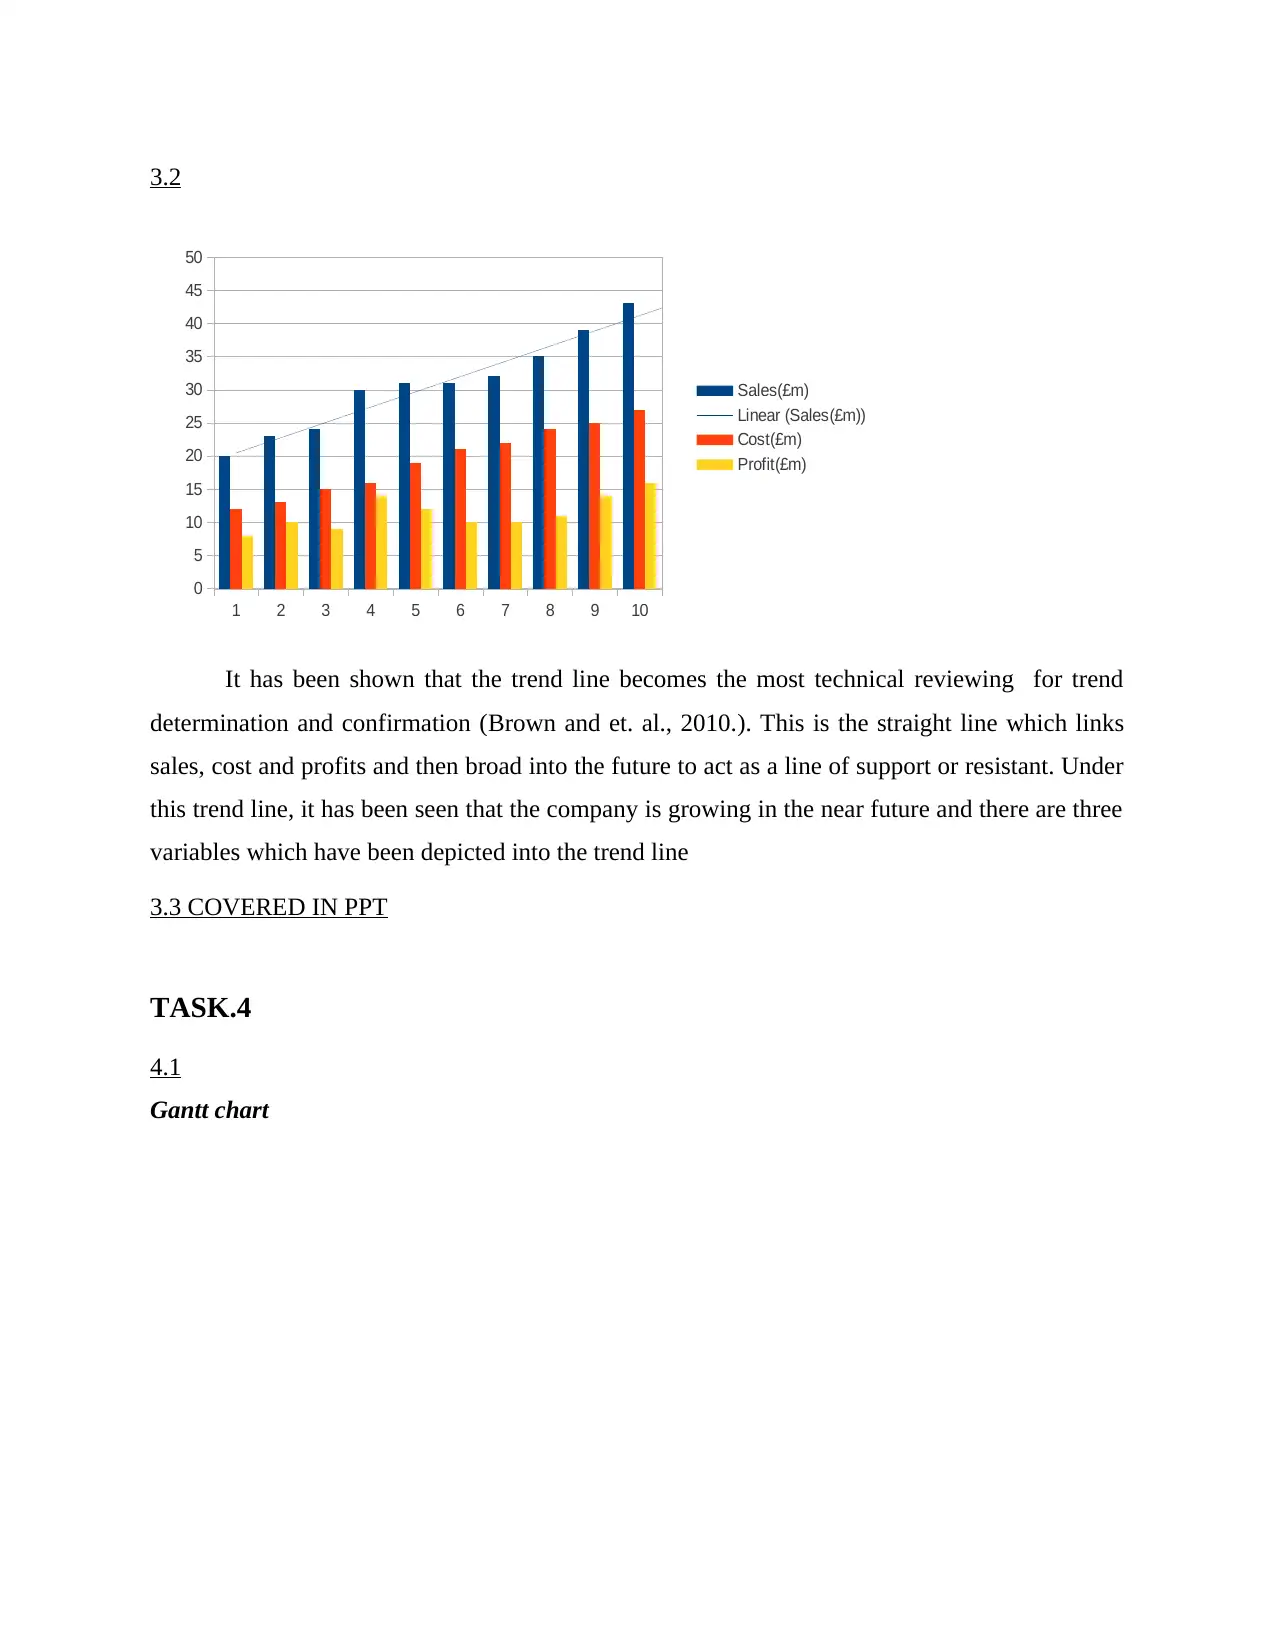
It has been shown that the trend line becomes the most technical reviewing for trend
determination and confirmation (Brown and et. al., 2010.). This is the straight line which links
sales, cost and profits and then broad into the future to act as a line of support or resistant. Under
this trend line, it has been seen that the company is growing in the near future and there are three
variables which have been depicted into the trend line
3.3 COVERED IN PPT
TASK.4
4.1
Gantt chart
1 2 3 4 5 6 7 8 9 10
0
5
10
15
20
25
30
35
40
45
50
Sales(£m)
Linear (Sales(£m))
Cost(£m)
Profit(£m)
It has been shown that the trend line becomes the most technical reviewing for trend
determination and confirmation (Brown and et. al., 2010.). This is the straight line which links
sales, cost and profits and then broad into the future to act as a line of support or resistant. Under
this trend line, it has been seen that the company is growing in the near future and there are three
variables which have been depicted into the trend line
3.3 COVERED IN PPT
TASK.4
4.1
Gantt chart
⊘ This is a preview!⊘
Do you want full access?
Subscribe today to unlock all pages.
Trusted by 1+ million students worldwide
1 out of 16
Related Documents


Your All-in-One AI-Powered Toolkit for Academic Success.
+13062052269
info@desklib.com
Available 24*7 on WhatsApp / Email
![[object Object]](/_next/static/media/star-bottom.7253800d.svg)
Unlock your academic potential
Copyright © 2020–2026 A2Z Services. All Rights Reserved. Developed and managed by ZUCOL.