Business Decision Making: A Comprehensive Report on Murano Restaurant
VerifiedAdded on 2023/04/04
|20
|4456
|473
Report
AI Summary
This report provides a detailed analysis of business decision-making processes at Murano Restaurant in London, UK. It covers data collection methods, including primary and secondary data sources, sampling techniques, and questionnaire design. Statistical tools such as mean, median, mode, and standard deviation are applied to analyze sales data and identify trends. The report also includes graphical representations of data, trend line analysis for forecasting, and a discussion of information processing tools used within the organization. Furthermore, it explores project evaluation methods and network diagrams to assist in project planning and decision-making, ultimately aiming to improve the restaurant's performance and customer satisfaction. The study highlights the importance of data-driven decision-making in addressing business challenges and achieving competitive advantages.

BUSINESS DECISION
MAKING
1
MAKING
1
Paraphrase This Document
Need a fresh take? Get an instant paraphrase of this document with our AI Paraphraser
Table of Contents
INTRODUCTION...........................................................................................................................3
TASK 1............................................................................................................................................3
1.1 Collection of data for the research....................................................................................3
1.2 Sampling method and survey methodology.....................................................................4
1.3 Questionnaire for research................................................................................................5
TASK 2............................................................................................................................................7
2.1 Statistical tools and their application................................................................................7
2.2 Analysis results of descriptive tools and techniques........................................................8
2.3 Calculation Standard deviation.........................................................................................9
2.4 Calculation of quartile deviation and correlation...........................................................10
TASK 3..........................................................................................................................................11
3.1 Graphical representation of data.....................................................................................11
3.2 Trend line graph which assist to forecast.......................................................................13
3.3 Business presentation for suitable software...................................................................13
3.4 Formal business report of Murano Restaurant...............................................................13
TASK 4..........................................................................................................................................14
4.1 Information processing tools and their use within the business organisation................14
4.2 Network diagram............................................................................................................15
4.3 project evaluation method..............................................................................................16
CONCLUSION..............................................................................................................................18
REFERENCES..............................................................................................................................19
2
INTRODUCTION
In order to pass the time, every organisation faces problems so that it is essential to remove
obstacles so that enterprise can attain effective results and performances within the business
environment (Dekker, Fleischmann and van Wassenhove, 2013). In recent time, managers using
such tools which demonstrate problems and solve it to make effective results and performances.
In this way, statistics is the best element which eliminates causes from the workplace to
determine high performances and results within the business enterprise (Bagdasarov, Johnson
and Mumford, 2016). In this context, present report is based on Murano restaurant which is
providing different types of food products in various part of London UK. They are working with
effective raw material so that customer can easily attract towards the company and its operations.
Thus, it is profitable to deal with various outcomes and performances at workplace.
In this context, present report covers collection of data to conduct research program within
the business. Furthermore, it includes questionnaire in which some questions are included for
conduct research program at workplace. Moreover, appropriate information tool are taken at
workplace for making decisions to deal with situation of company. In addition to this, trend
analysis covers in report which shows position of the chosen organisation. At last, there are
information processing tools which assist to prepare project plan at workplace.
TASK 1
1.1 Collection of data for the research
In respect to conduct research program, it is very important to understand the project in
better aspect. In this way, it is essential to collect data from primary and secondary sources. In
primary and secondary data high differences take place which demonstrate their better
importance at workplace. Both elements are use in same manner but in different context (Qin,
Liang and Wei, 2017). As results, if anyone intend to carry their research program, they have to
select a topic in which they want to carry their operations and outcomes. Until, not understand
about the project can create problem to determine solution for it. Thus, it is important to
demonstrate results and performances for ascertain results and performances. In addition to this,
to solve the business issues and problems, researcher take both type of data which assist to gain
competitive advantages and results in the better way.
3
⊘ This is a preview!⊘
Do you want full access?
Subscribe today to unlock all pages.
Trusted by 1+ million students worldwide
In order to take results and performances, primary and secondary data are taken at
workplace which determine effective solution for undertake performances at workplace. Firstly
present study is gather secondary data to conduct research program at workplace. Hence, books,
journals, and many other reviews can be taken at workplace which demonstrates programs and
results in the better way (Nummela, Saarenketo and Loane, 2014). This assist to researcher, to
find solution for their topic in the better manner. In this way, they can find development for
related topics within previous research programs. After collection of secondary data, primary
data also gathered. In this way, researcher needs to take some questions in questionnaire. After
this, researcher will conduct this questionnaire from respondents (Dekker, Fleischmann and van
Wassenhove, 2013). In this way, appropriate sampling is requiring to be taken from researcher to
undertake results and performances at workplace. Through sampling method, sample unit will be
selected for conduct research program at workplace. Questionnaire can be given to each
respondent and primary data will be taken for this process. It is the entire process which can be
followed for collecting primary data and secondary data within the research (Bagdasarov,
Johnson and Mumford, 2016).
1.2 Sampling method and survey methodology
In the current research sample of the 50 people will be taken from the population. In this
aspect, appropriate sampling method can be used at workplace of Murano which assist to make
decisions at workplace (Zikmund, Babin and Griffin, 2013). In respect to this, formation of
sample for research program is taken which determine effective results and performances within
the business environment. Researcher often use variety of sampling method for conduct their
research program. Following are such sample method which can be used at workplace:
Simple random sampling
This method is majorly use by various individual at workplace. In this way, researcher
takes variety of research program at workplace to demonstrate effective results and performances
within the business environment (Mardani, Jusoh and Zavadskas, 2015). This is because, it is
very essential to determine solution for ascertaining research on the basis of age, gender,
occupation, and education level.
Stratified sampling method
4
Paraphrase This Document
Need a fresh take? Get an instant paraphrase of this document with our AI Paraphraser
It is another method which is used by most of the researcher within their research study.
In this way, sample approach is determines demographic factor which can split population in
different era. As per the demographic factors, sample unit population is divided in variety of
parts which ascertain for results and outcomes in the better manner. In this way, researcher can
be conducting same research in better way to create broad understanding (Qin, Liang and Wei,
2017).
Cluster sampling
This method is used in same context of stratified method. In this aspect, population is
also classified in different types of division in term of specific geographic areas. From the help
of different geographic areas, sample unit is taken from the population (Nummela, Saarenketo
and Loane, 2014).
Convenience sampling
It is another approach which is used for picking specific individual as respondents from
the population. In addition to this, researcher takes one by one respondent from different
population. One by one respondent will be given their view to ascertain results and performances
(Zikmund, Babin and Griffin, 2013).
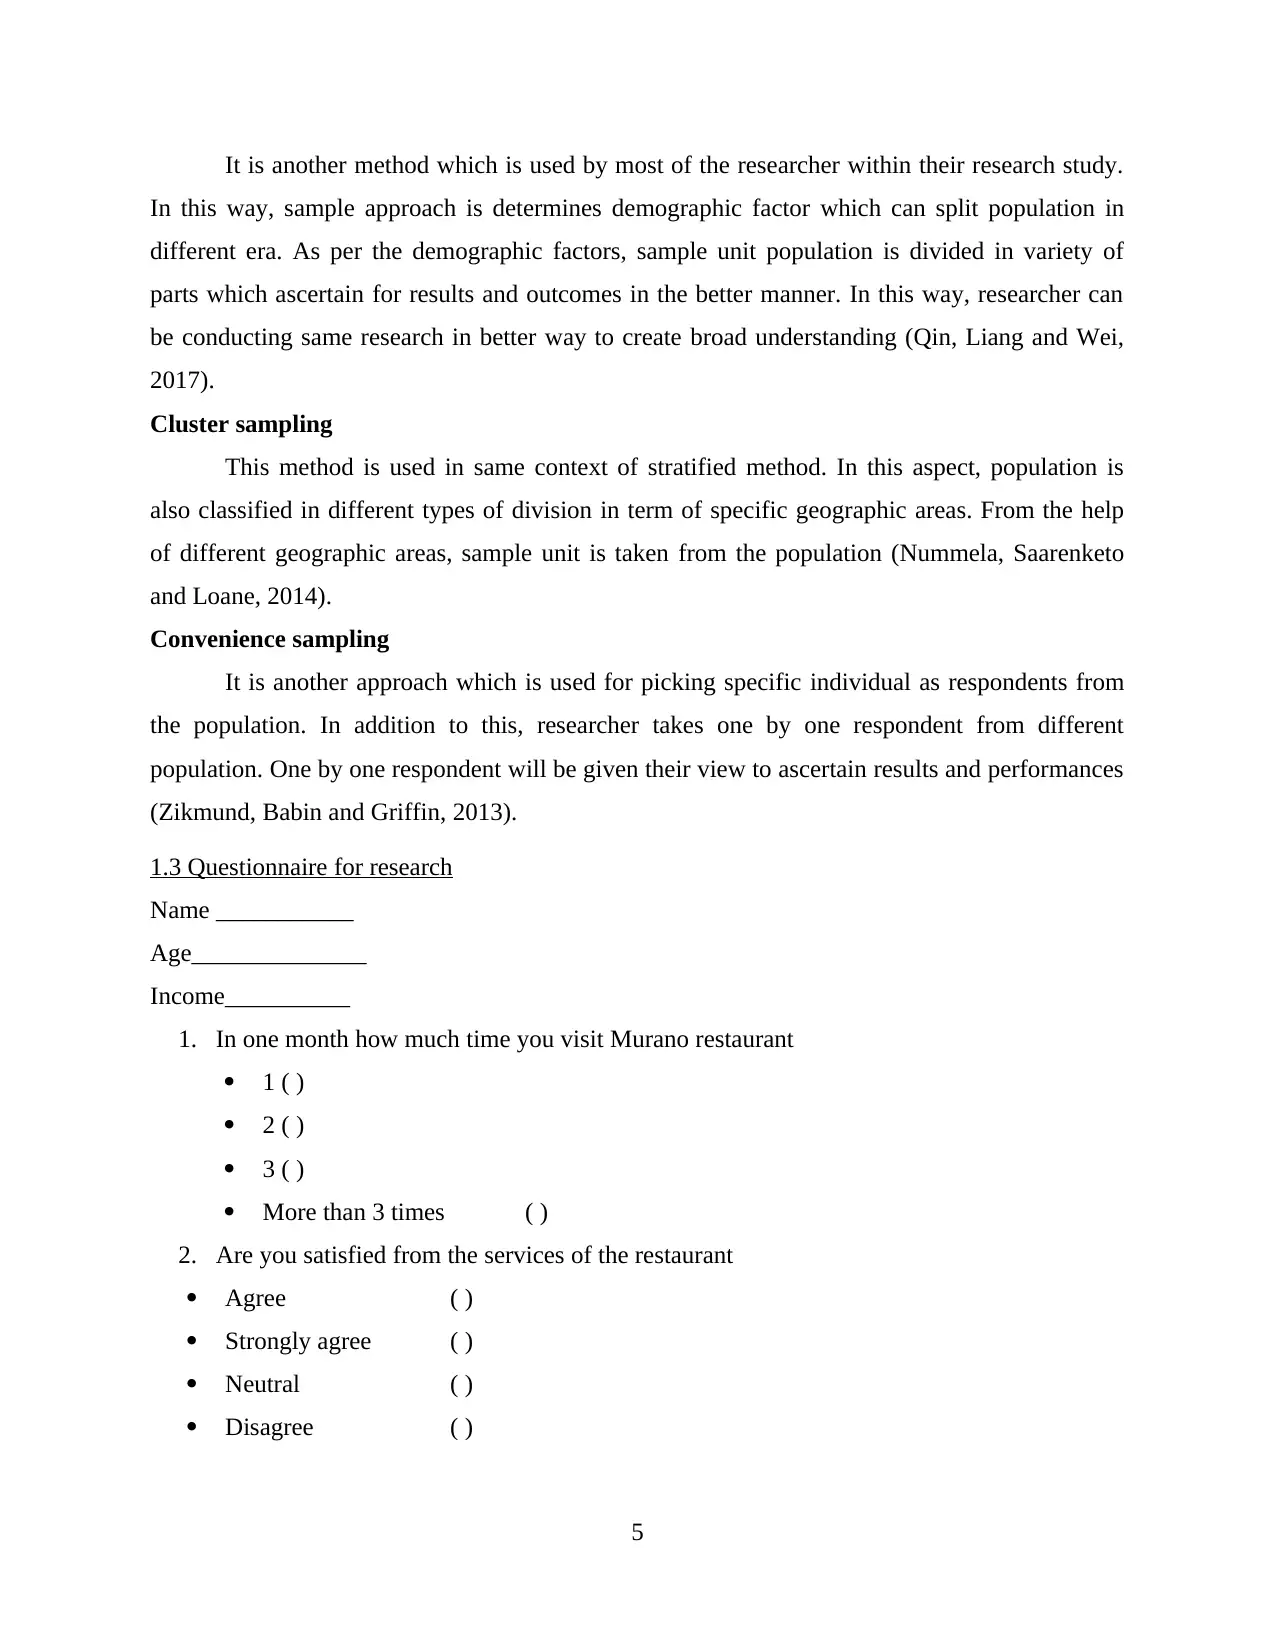
1.3 Questionnaire for research
Name ___________
Age______________
Income__________
1. In one month how much time you visit Murano restaurant
1 ( )
2 ( )
3 ( )
More than 3 times ( )
2. Are you satisfied from the services of the restaurant
Agree ( )
Strongly agree ( )
Neutral ( )
Disagree ( )
5
In this way, sample approach is determines demographic factor which can split population in
different era. As per the demographic factors, sample unit population is divided in variety of
parts which ascertain for results and outcomes in the better manner. In this way, researcher can
be conducting same research in better way to create broad understanding (Qin, Liang and Wei,
2017).
Cluster sampling
This method is used in same context of stratified method. In this aspect, population is
also classified in different types of division in term of specific geographic areas. From the help
of different geographic areas, sample unit is taken from the population (Nummela, Saarenketo
and Loane, 2014).
Convenience sampling
It is another approach which is used for picking specific individual as respondents from
the population. In addition to this, researcher takes one by one respondent from different
population. One by one respondent will be given their view to ascertain results and performances
(Zikmund, Babin and Griffin, 2013).
1.3 Questionnaire for research
Name ___________
Age______________
Income__________
1. In one month how much time you visit Murano restaurant
1 ( )
2 ( )
3 ( )
More than 3 times ( )
2. Are you satisfied from the services of the restaurant
Agree ( )
Strongly agree ( )
Neutral ( )
Disagree ( )
5
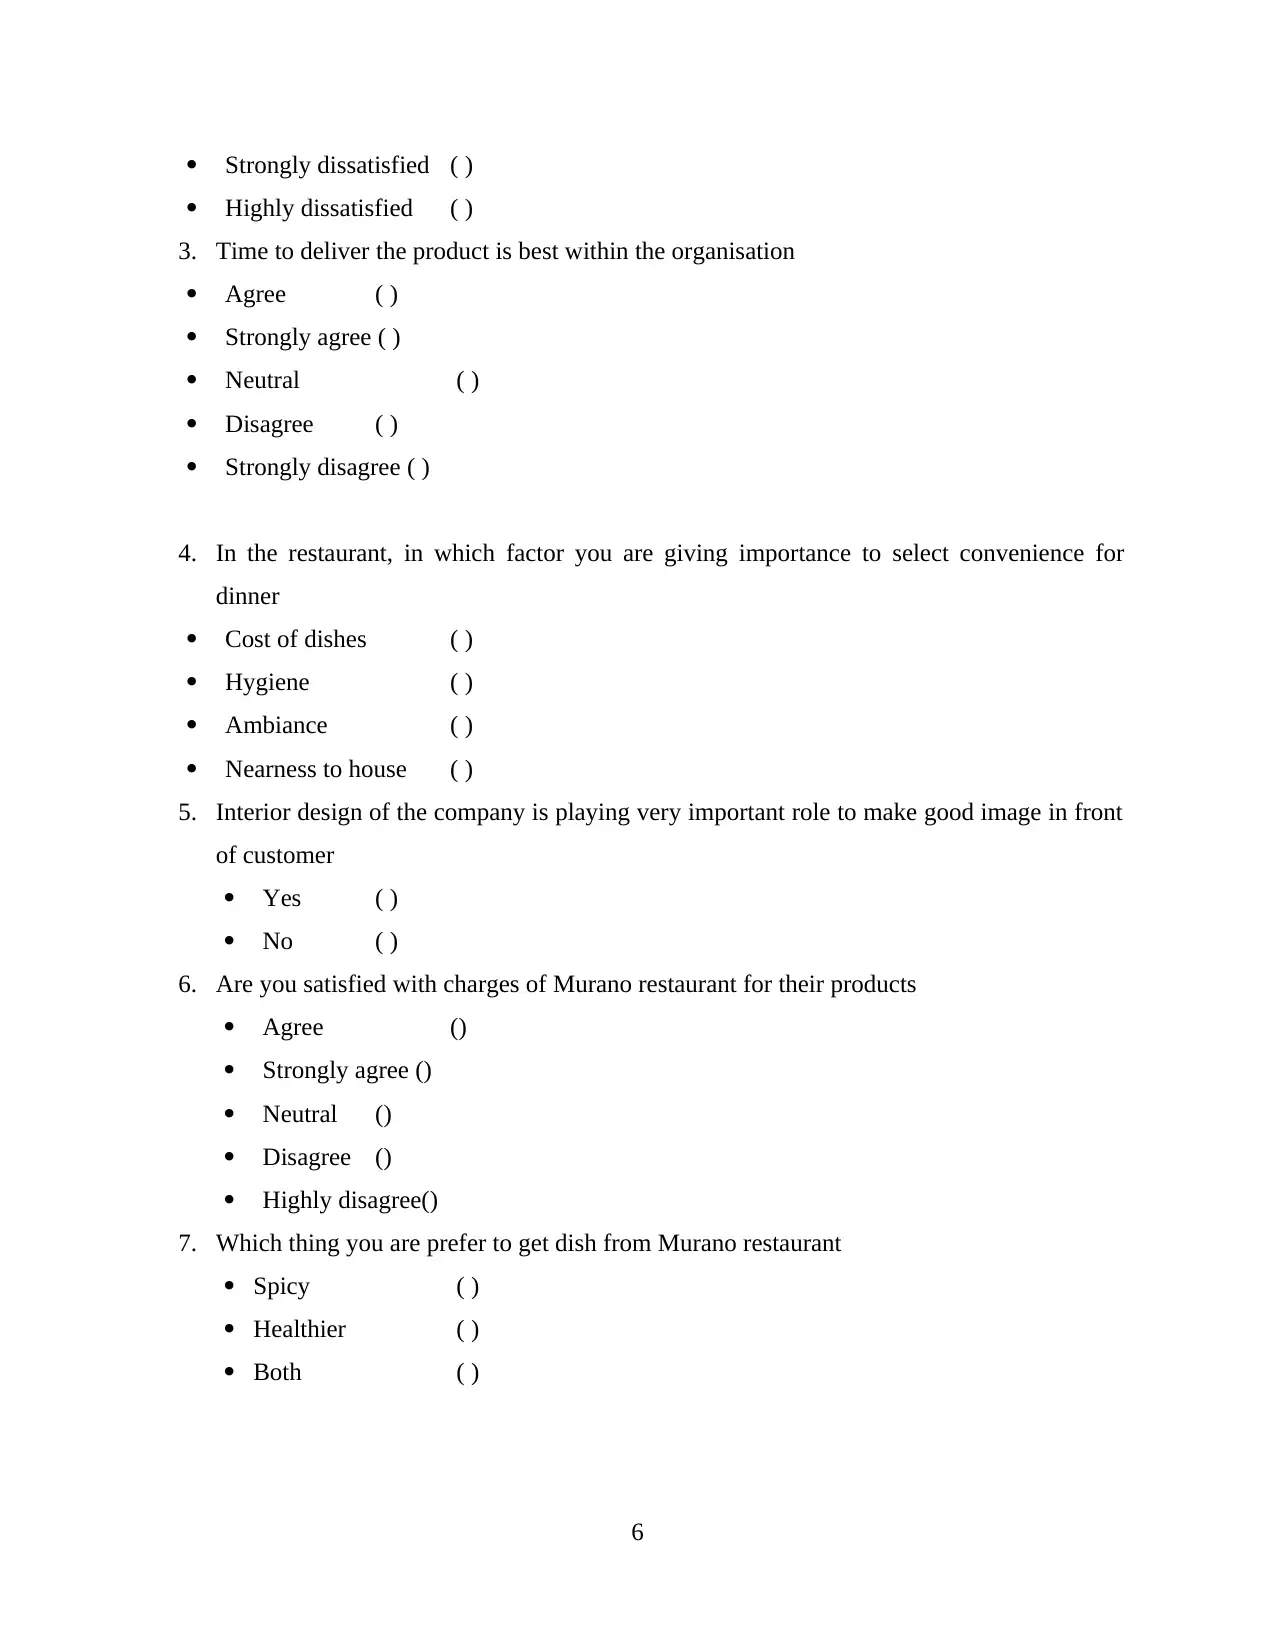
Strongly dissatisfied ( )
Highly dissatisfied ( )
3. Time to deliver the product is best within the organisation
Agree ( )
Strongly agree ( )
Neutral ( )
Disagree ( )
Strongly disagree ( )
4. In the restaurant, in which factor you are giving importance to select convenience for
dinner
Cost of dishes ( )
Hygiene ( )
Ambiance ( )
Nearness to house ( )
5. Interior design of the company is playing very important role to make good image in front
of customer
Yes ( )
No ( )
6. Are you satisfied with charges of Murano restaurant for their products
Agree ()
Strongly agree ()
Neutral ()
Disagree ()
Highly disagree()
7. Which thing you are prefer to get dish from Murano restaurant
Spicy ( )
Healthier ( )
Both ( )
6
⊘ This is a preview!⊘
Do you want full access?
Subscribe today to unlock all pages.
Trusted by 1+ million students worldwide
TASK 2
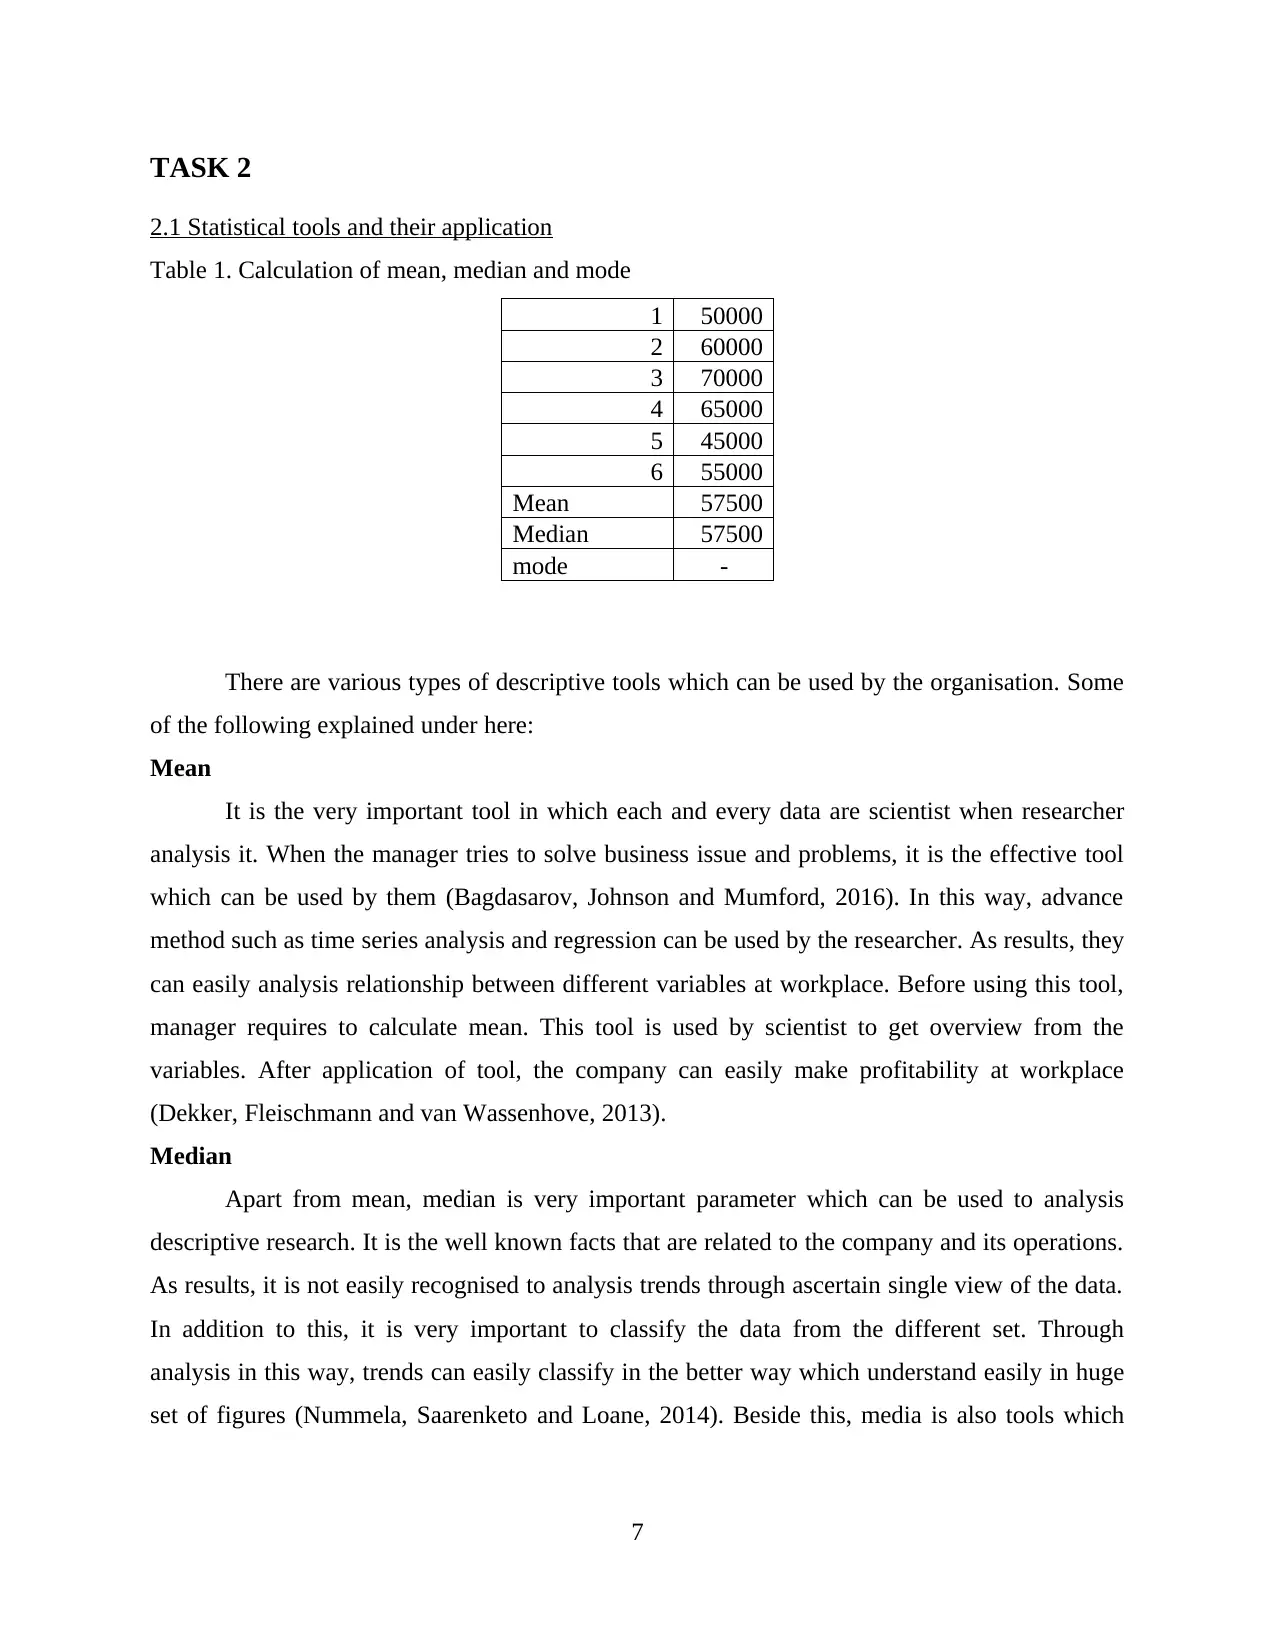
2.1 Statistical tools and their application
Table 1. Calculation of mean, median and mode
1 50000
2 60000
3 70000
4 65000
5 45000
6 55000
Mean 57500
Median 57500
mode -
There are various types of descriptive tools which can be used by the organisation. Some
of the following explained under here:
Mean
It is the very important tool in which each and every data are scientist when researcher
analysis it. When the manager tries to solve business issue and problems, it is the effective tool
which can be used by them (Bagdasarov, Johnson and Mumford, 2016). In this way, advance
method such as time series analysis and regression can be used by the researcher. As results, they
can easily analysis relationship between different variables at workplace. Before using this tool,
manager requires to calculate mean. This tool is used by scientist to get overview from the
variables. After application of tool, the company can easily make profitability at workplace
(Dekker, Fleischmann and van Wassenhove, 2013).
Median
Apart from mean, median is very important parameter which can be used to analysis
descriptive research. It is the well known facts that are related to the company and its operations.
As results, it is not easily recognised to analysis trends through ascertain single view of the data.
In addition to this, it is very important to classify the data from the different set. Through
analysis in this way, trends can easily classify in the better way which understand easily in huge
set of figures (Nummela, Saarenketo and Loane, 2014). Beside this, media is also tools which
7
Paraphrase This Document
Need a fresh take? Get an instant paraphrase of this document with our AI Paraphraser
assist to demonstrate set of values within the business organisation with taking equivalent part.
As results, it can be said that it is very important tool for analysis ascertained within the business
organisation (Mardani, Jusoh and Zavadskas, 2015).
Mode
Mode is the value which assists to find more specific value and outcomes from different
source of the organisation. In this aspect, business can analysis their performances through
ascertain results and performances in terms of repeating the value and outcomes. If in a series
value occurring more times, within specific trend it is conducted as mode (Zikmund, Babin and
Griffin, 2013).
2.2 Analysis results of descriptive tools and techniques
Results of the analysis are as follows:
Mean
Variables that can be taken into account for analysis sales of the chosen company. In this
way, mean value is taken with sales which is 57500 within the workplace. It means that average
sales of the organisation taken which is based on specific time period. A current sale of the
Murano restaurant is 55000 that reflect sales volume of the company above the current position
(Qin, Liang and Wei, 2017). Thus, it is identified that performances of the cited firm is not
effective which create negative impact on the business and its image in front of customer. The
chosen firm is failing to operate their functions and operations which are very critical to
determine effective outcomes and performances. They are fails to achieve average sales
within the business and it reflects to that condition of Murano is critical (Dekker, Fleischmann
and van Wassenhove, 2013).
Median
Value of the median is 57500 which can be dividing in term of entire set of figure that
demonstrate in multiple part of the company. It has been seen that sales of Murano is increasing
but their rates are decline which create negative impact on the business and its operations. As
results, the chosen firm need to enhance their performances which create positive results and
performances at workplace (Bagdasarov, Johnson and Mumford, 2016).
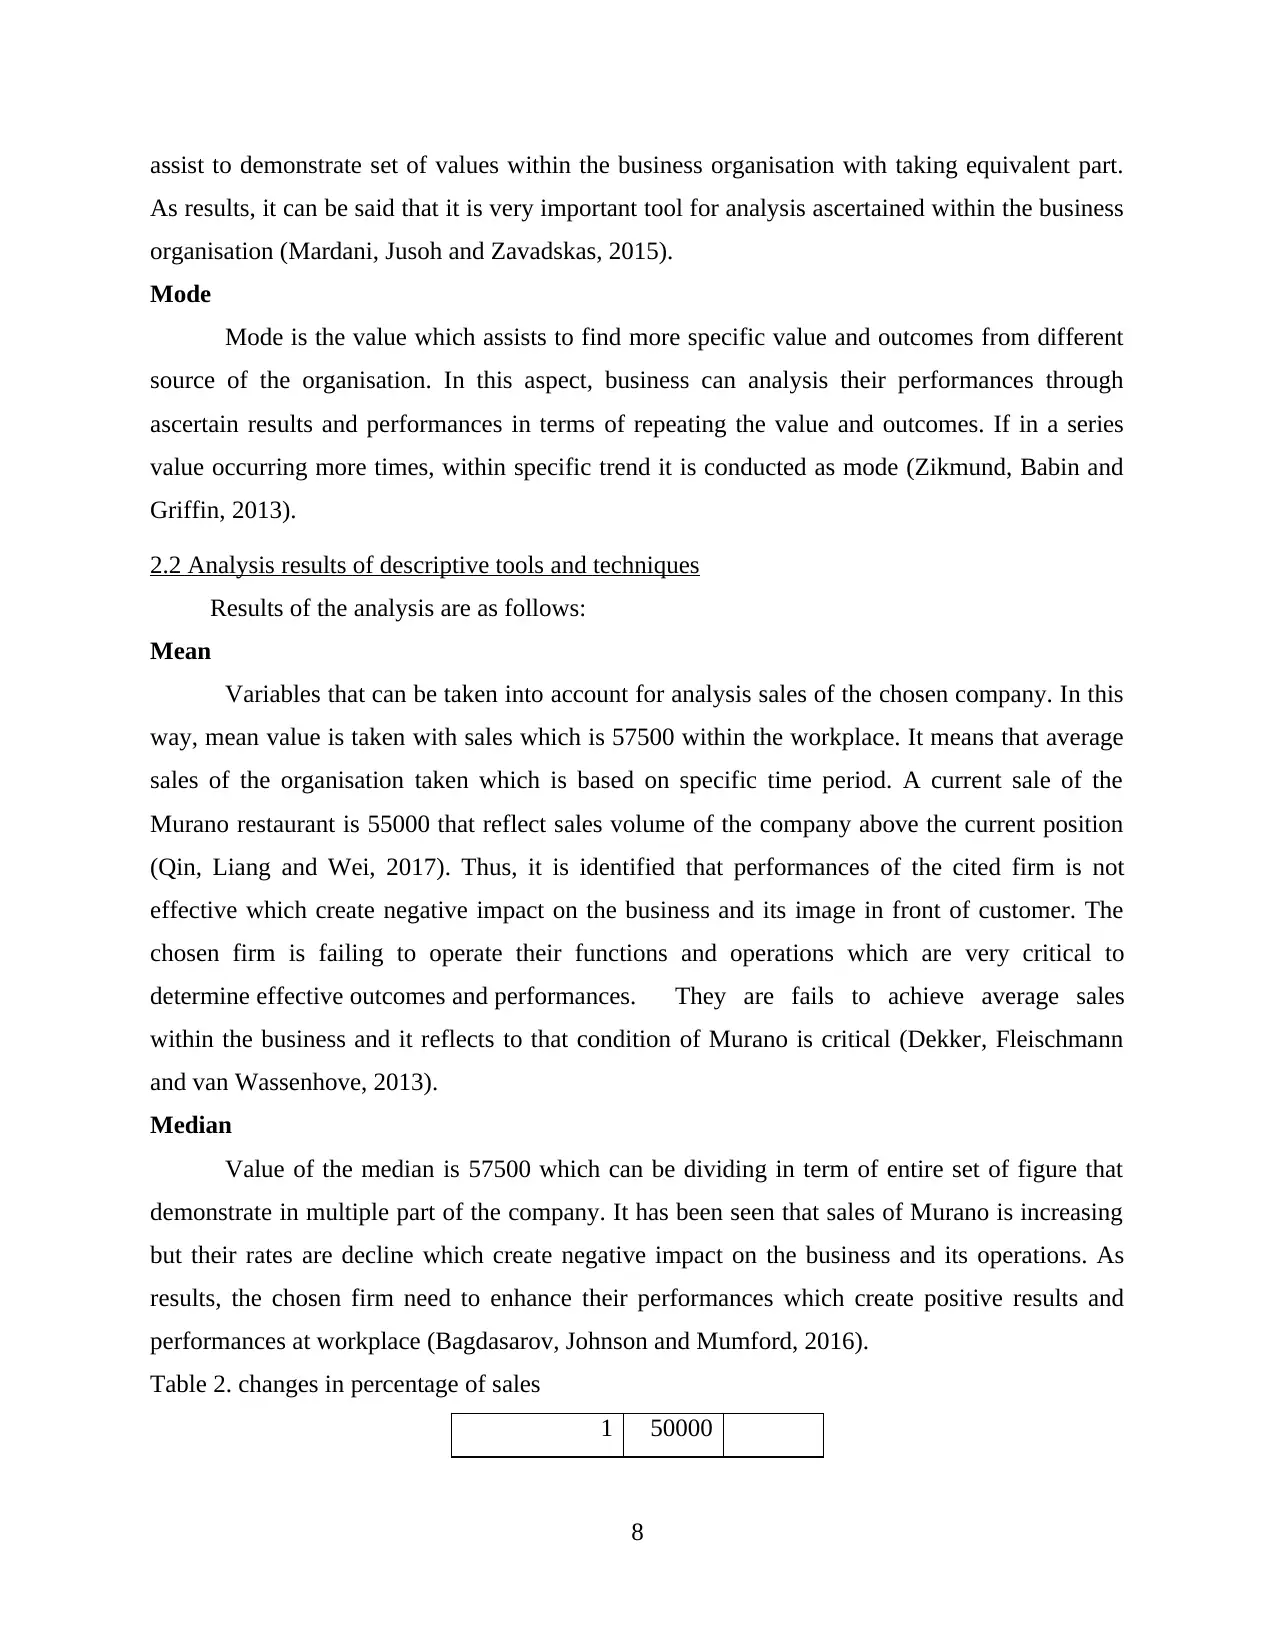
Table 2. changes in percentage of sales
1 50000
8
As results, it can be said that it is very important tool for analysis ascertained within the business
organisation (Mardani, Jusoh and Zavadskas, 2015).
Mode
Mode is the value which assists to find more specific value and outcomes from different
source of the organisation. In this aspect, business can analysis their performances through
ascertain results and performances in terms of repeating the value and outcomes. If in a series
value occurring more times, within specific trend it is conducted as mode (Zikmund, Babin and
Griffin, 2013).
2.2 Analysis results of descriptive tools and techniques
Results of the analysis are as follows:
Mean
Variables that can be taken into account for analysis sales of the chosen company. In this
way, mean value is taken with sales which is 57500 within the workplace. It means that average
sales of the organisation taken which is based on specific time period. A current sale of the
Murano restaurant is 55000 that reflect sales volume of the company above the current position
(Qin, Liang and Wei, 2017). Thus, it is identified that performances of the cited firm is not
effective which create negative impact on the business and its image in front of customer. The
chosen firm is failing to operate their functions and operations which are very critical to
determine effective outcomes and performances. They are fails to achieve average sales
within the business and it reflects to that condition of Murano is critical (Dekker, Fleischmann
and van Wassenhove, 2013).
Median
Value of the median is 57500 which can be dividing in term of entire set of figure that
demonstrate in multiple part of the company. It has been seen that sales of Murano is increasing
but their rates are decline which create negative impact on the business and its operations. As
results, the chosen firm need to enhance their performances which create positive results and
performances at workplace (Bagdasarov, Johnson and Mumford, 2016).
Table 2. changes in percentage of sales
1 50000
8
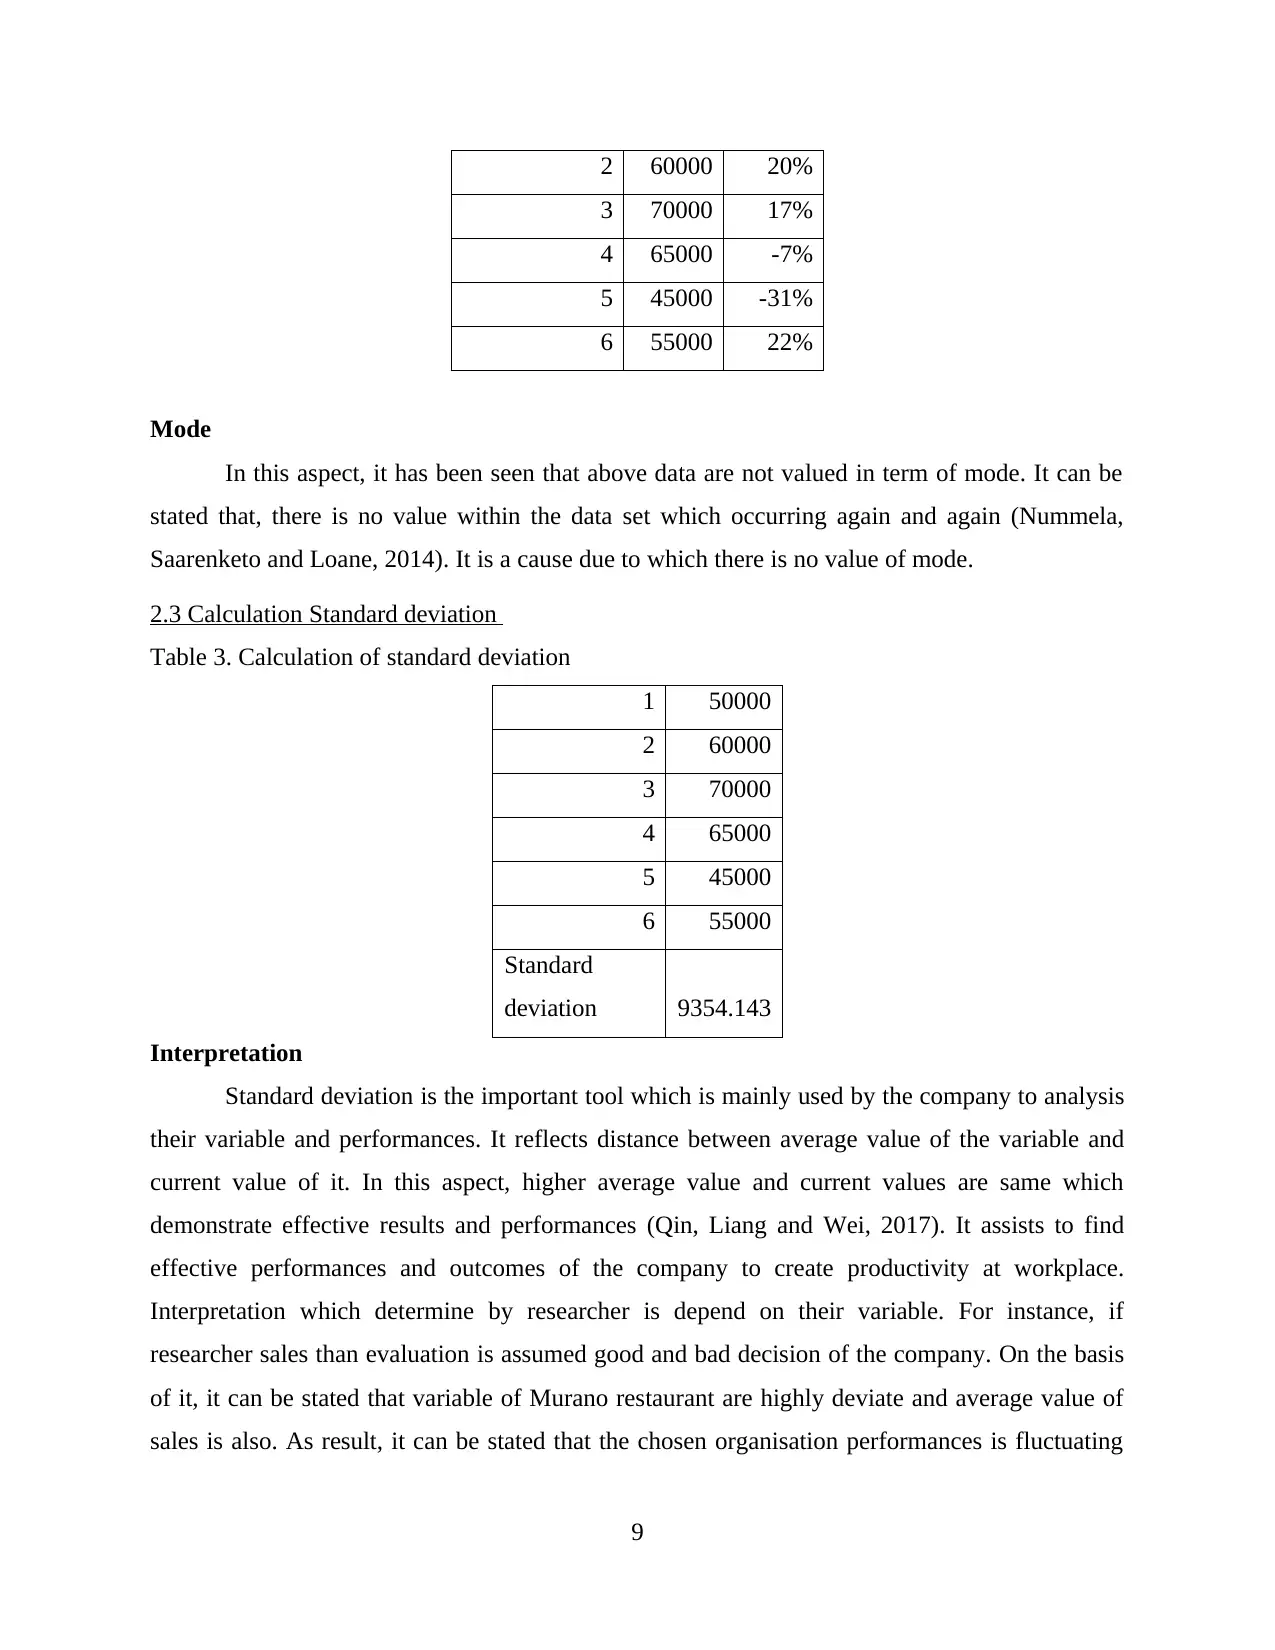
2 60000 20%
3 70000 17%
4 65000 -7%
5 45000 -31%
6 55000 22%
Mode
In this aspect, it has been seen that above data are not valued in term of mode. It can be
stated that, there is no value within the data set which occurring again and again (Nummela,
Saarenketo and Loane, 2014). It is a cause due to which there is no value of mode.
2.3 Calculation Standard deviation
Table 3. Calculation of standard deviation
1 50000
2 60000
3 70000
4 65000
5 45000
6 55000
Standard
deviation 9354.143
Interpretation
Standard deviation is the important tool which is mainly used by the company to analysis
their variable and performances. It reflects distance between average value of the variable and
current value of it. In this aspect, higher average value and current values are same which
demonstrate effective results and performances (Qin, Liang and Wei, 2017). It assists to find
effective performances and outcomes of the company to create productivity at workplace.
Interpretation which determine by researcher is depend on their variable. For instance, if
researcher sales than evaluation is assumed good and bad decision of the company. On the basis
of it, it can be stated that variable of Murano restaurant are highly deviate and average value of
sales is also. As result, it can be stated that the chosen organisation performances is fluctuating
9
⊘ This is a preview!⊘
Do you want full access?
Subscribe today to unlock all pages.
Trusted by 1+ million students worldwide
from average value which determines that is good or not (Dekker, Fleischmann and van
Wassenhove, 2013).
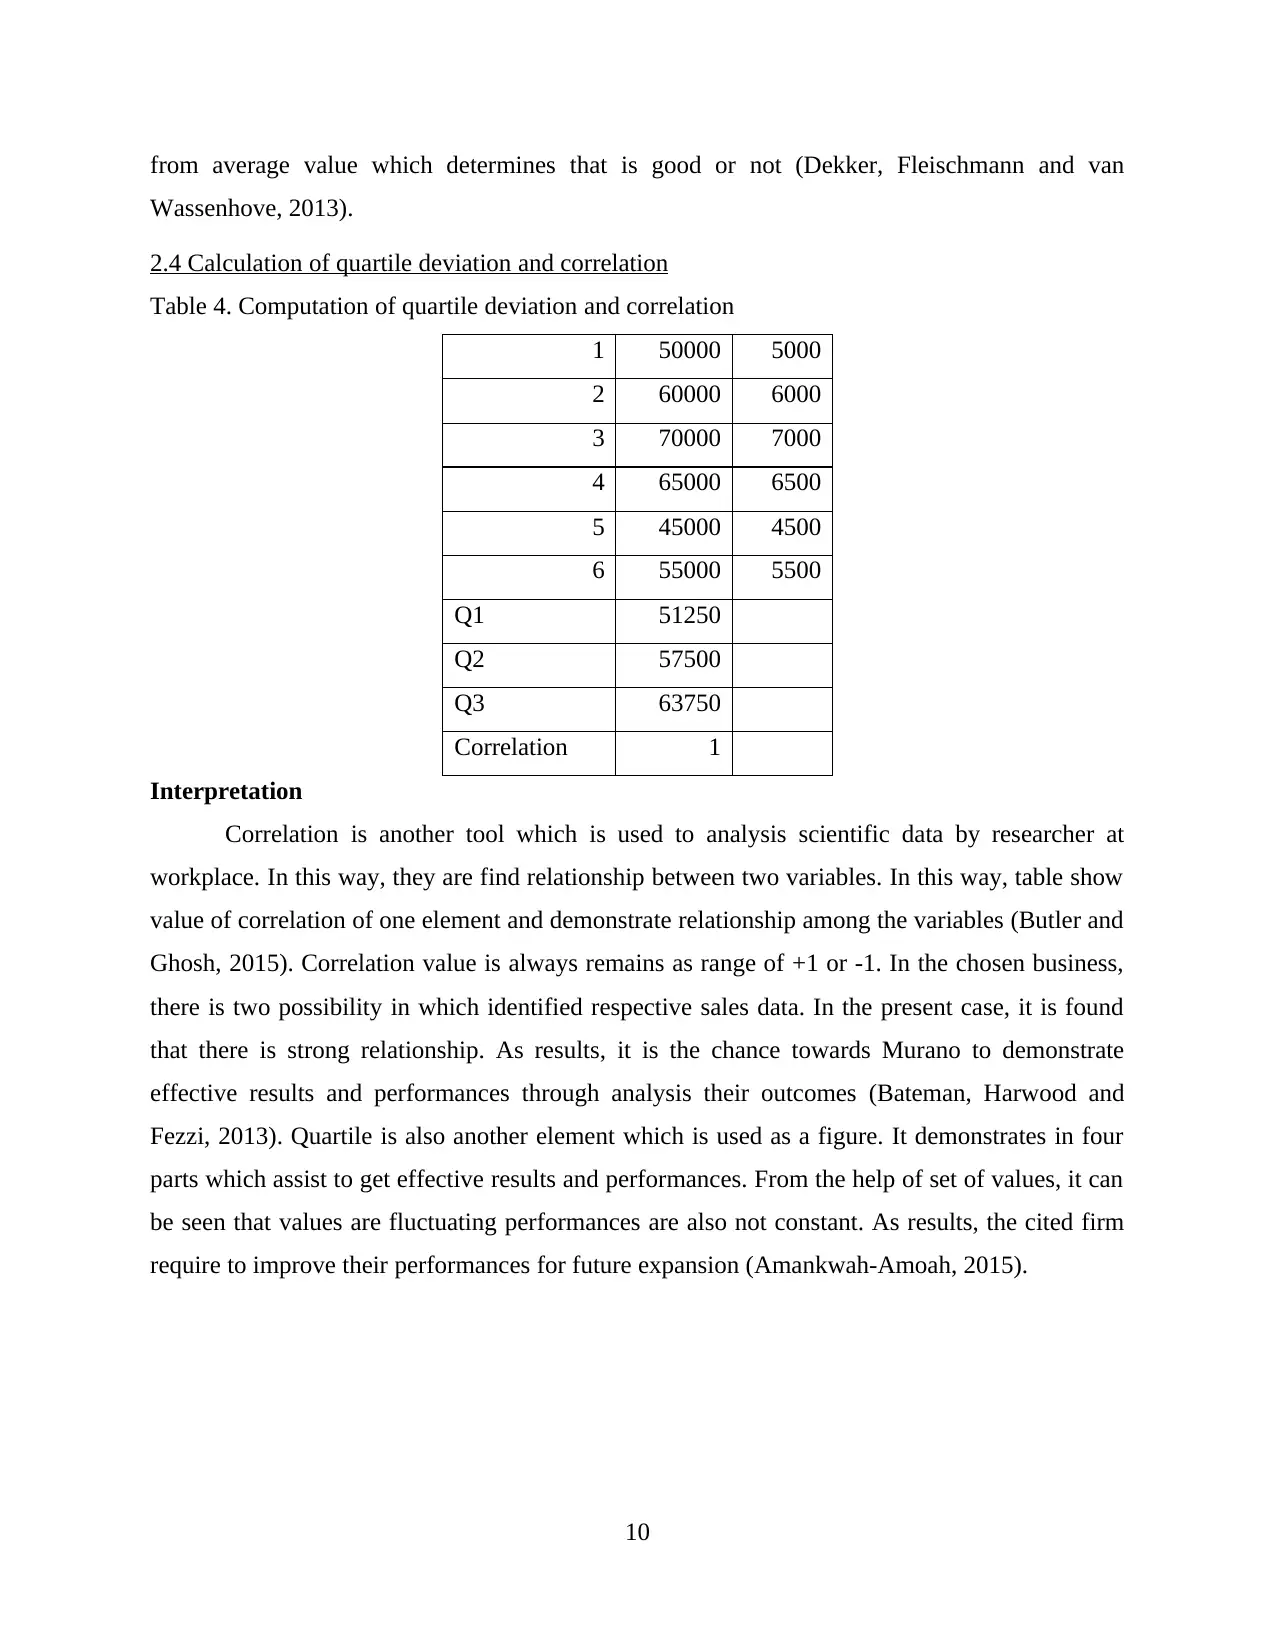
2.4 Calculation of quartile deviation and correlation
Table 4. Computation of quartile deviation and correlation
1 50000 5000
2 60000 6000
3 70000 7000
4 65000 6500
5 45000 4500
6 55000 5500
Q1 51250
Q2 57500
Q3 63750
Correlation 1
Interpretation
Correlation is another tool which is used to analysis scientific data by researcher at
workplace. In this way, they are find relationship between two variables. In this way, table show
value of correlation of one element and demonstrate relationship among the variables (Butler and
Ghosh, 2015). Correlation value is always remains as range of +1 or -1. In the chosen business,
there is two possibility in which identified respective sales data. In the present case, it is found
that there is strong relationship. As results, it is the chance towards Murano to demonstrate
effective results and performances through analysis their outcomes (Bateman, Harwood and
Fezzi, 2013). Quartile is also another element which is used as a figure. It demonstrates in four
parts which assist to get effective results and performances. From the help of set of values, it can
be seen that values are fluctuating performances are also not constant. As results, the cited firm
require to improve their performances for future expansion (Amankwah-Amoah, 2015).
10
Wassenhove, 2013).
2.4 Calculation of quartile deviation and correlation
Table 4. Computation of quartile deviation and correlation
1 50000 5000
2 60000 6000
3 70000 7000
4 65000 6500
5 45000 4500
6 55000 5500
Q1 51250
Q2 57500
Q3 63750
Correlation 1
Interpretation
Correlation is another tool which is used to analysis scientific data by researcher at
workplace. In this way, they are find relationship between two variables. In this way, table show
value of correlation of one element and demonstrate relationship among the variables (Butler and
Ghosh, 2015). Correlation value is always remains as range of +1 or -1. In the chosen business,
there is two possibility in which identified respective sales data. In the present case, it is found
that there is strong relationship. As results, it is the chance towards Murano to demonstrate
effective results and performances through analysis their outcomes (Bateman, Harwood and
Fezzi, 2013). Quartile is also another element which is used as a figure. It demonstrates in four
parts which assist to get effective results and performances. From the help of set of values, it can
be seen that values are fluctuating performances are also not constant. As results, the cited firm
require to improve their performances for future expansion (Amankwah-Amoah, 2015).
10
Paraphrase This Document
Need a fresh take? Get an instant paraphrase of this document with our AI Paraphraser
TASK 3
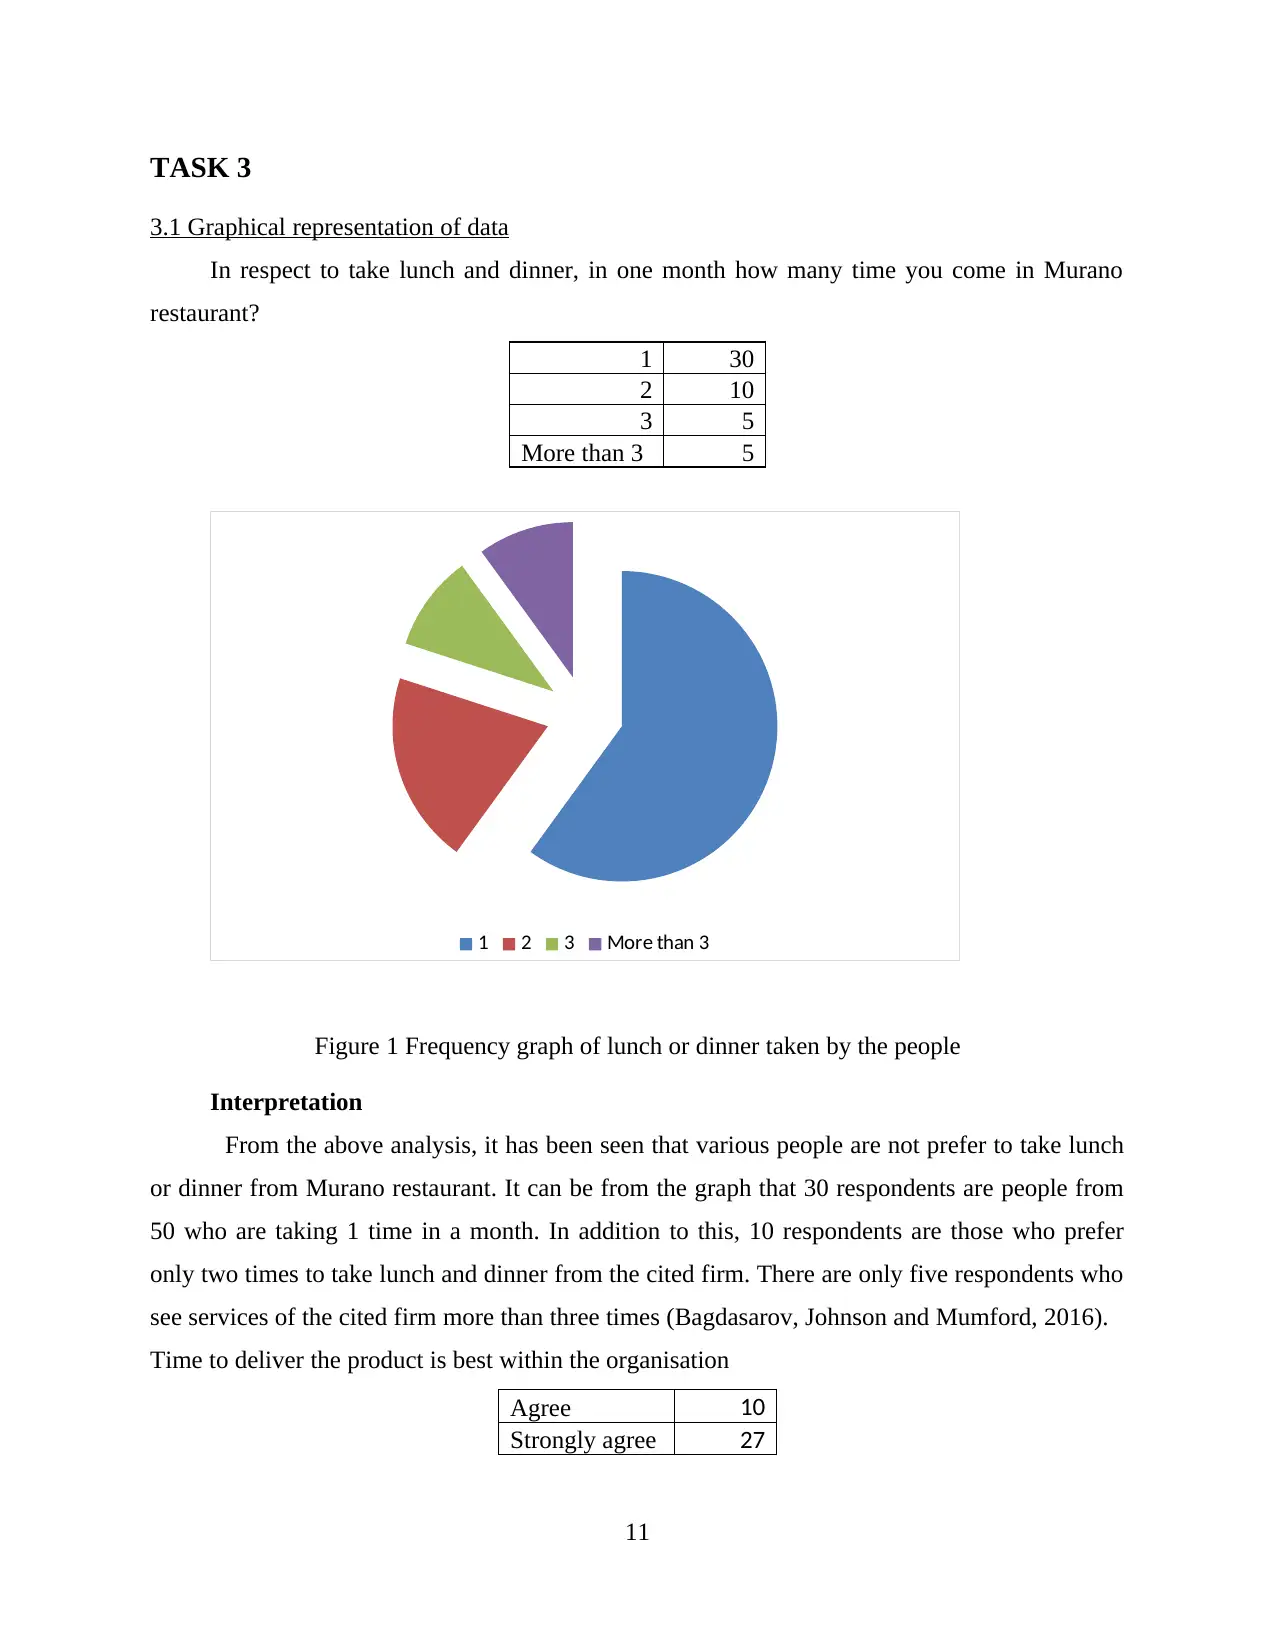
3.1 Graphical representation of data
In respect to take lunch and dinner, in one month how many time you come in Murano
restaurant?
1 30
2 10
3 5
More than 3 5
1 2 3 More than 3
Figure 1 Frequency graph of lunch or dinner taken by the people
Interpretation
From the above analysis, it has been seen that various people are not prefer to take lunch
or dinner from Murano restaurant. It can be from the graph that 30 respondents are people from
50 who are taking 1 time in a month. In addition to this, 10 respondents are those who prefer
only two times to take lunch and dinner from the cited firm. There are only five respondents who
see services of the cited firm more than three times (Bagdasarov, Johnson and Mumford, 2016).
Time to deliver the product is best within the organisation
Agree 10
Strongly agree 27
11
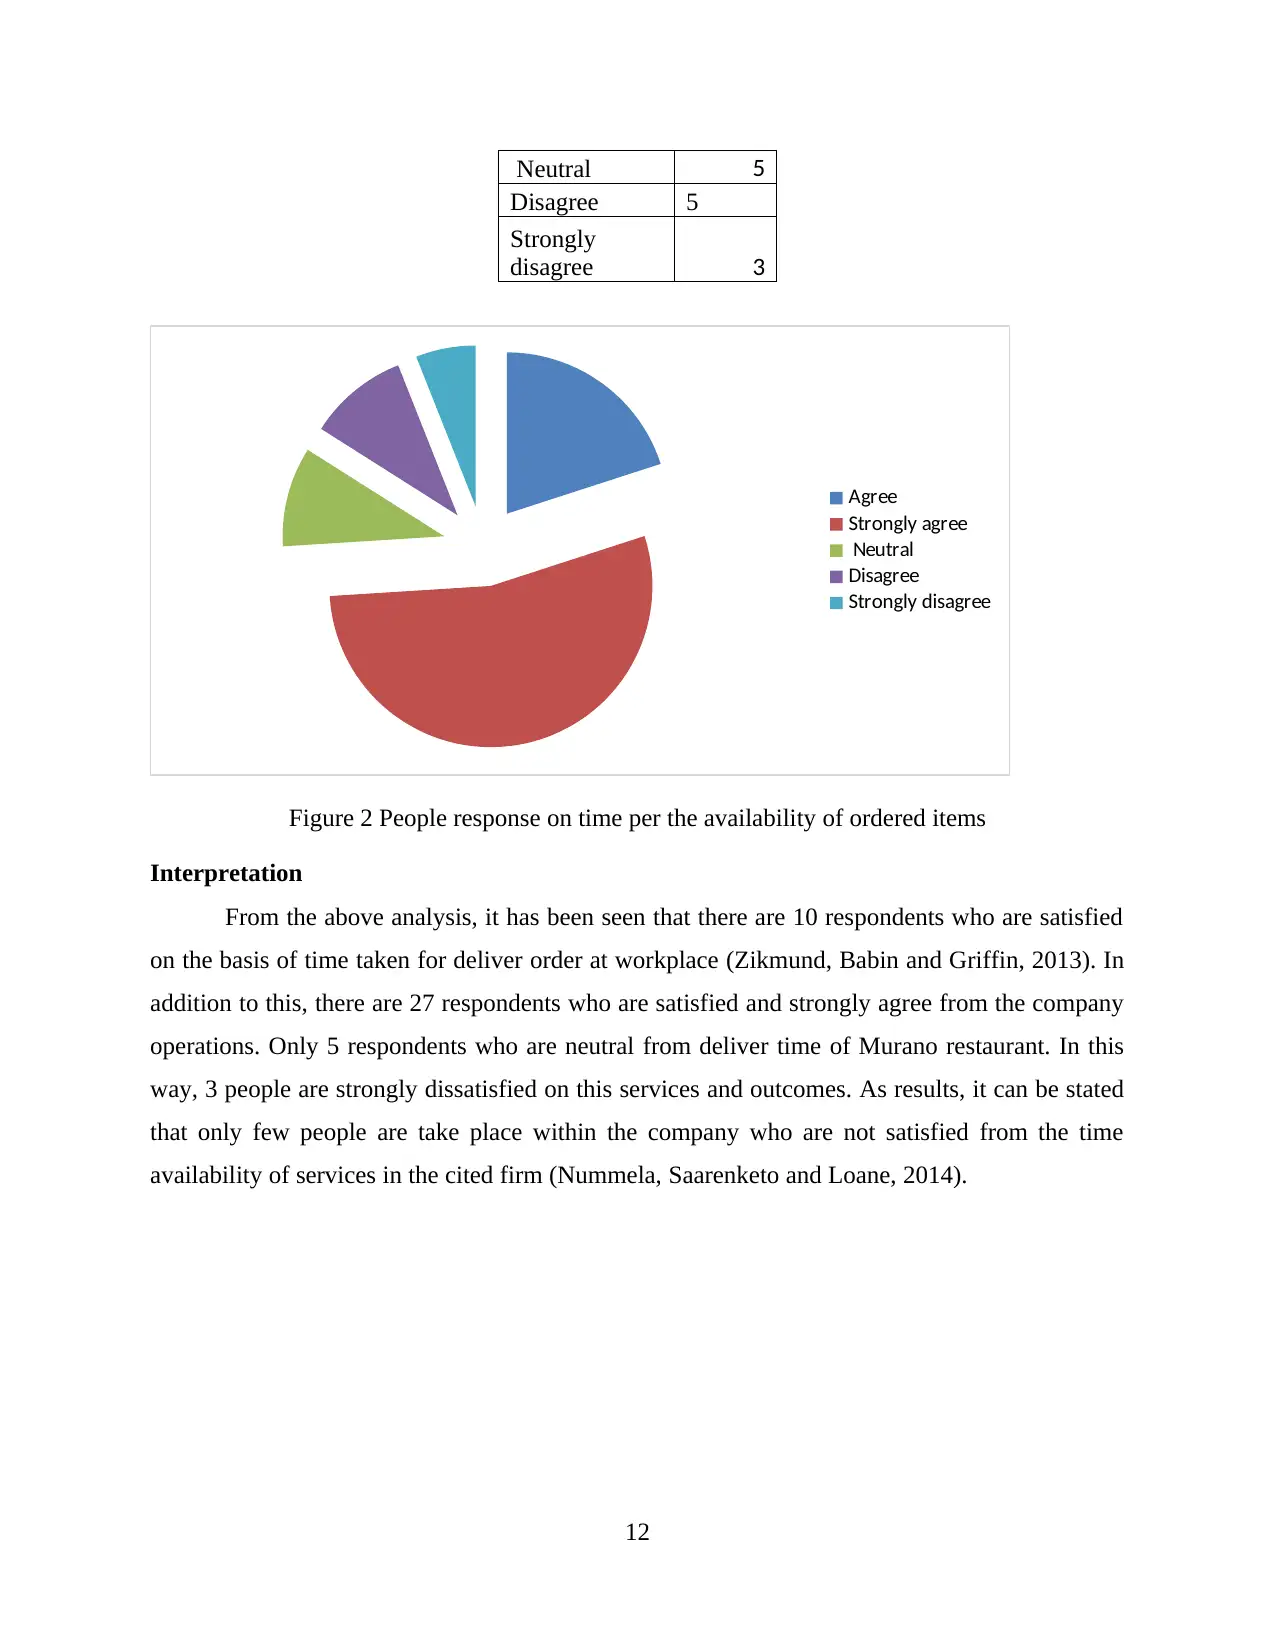
Neutral 5
Disagree 5
Strongly
disagree 3
Agree
Strongly agree
Neutral
Disagree
Strongly disagree
Figure 2 People response on time per the availability of ordered items
Interpretation
From the above analysis, it has been seen that there are 10 respondents who are satisfied
on the basis of time taken for deliver order at workplace (Zikmund, Babin and Griffin, 2013). In
addition to this, there are 27 respondents who are satisfied and strongly agree from the company
operations. Only 5 respondents who are neutral from deliver time of Murano restaurant. In this
way, 3 people are strongly dissatisfied on this services and outcomes. As results, it can be stated
that only few people are take place within the company who are not satisfied from the time
availability of services in the cited firm (Nummela, Saarenketo and Loane, 2014).
12
⊘ This is a preview!⊘
Do you want full access?
Subscribe today to unlock all pages.
Trusted by 1+ million students worldwide
1 out of 20
Related Documents


Your All-in-One AI-Powered Toolkit for Academic Success.
+13062052269
info@desklib.com
Available 24*7 on WhatsApp / Email
![[object Object]](/_next/static/media/star-bottom.7253800d.svg)
Unlock your academic potential
Copyright © 2020–2026 A2Z Services. All Rights Reserved. Developed and managed by ZUCOL.