Business Statistics Homework: Entertainment & Income Analysis

Verified

Added on  2020/05/16

|5
|598
|172
Homework Assignment
AI Summary
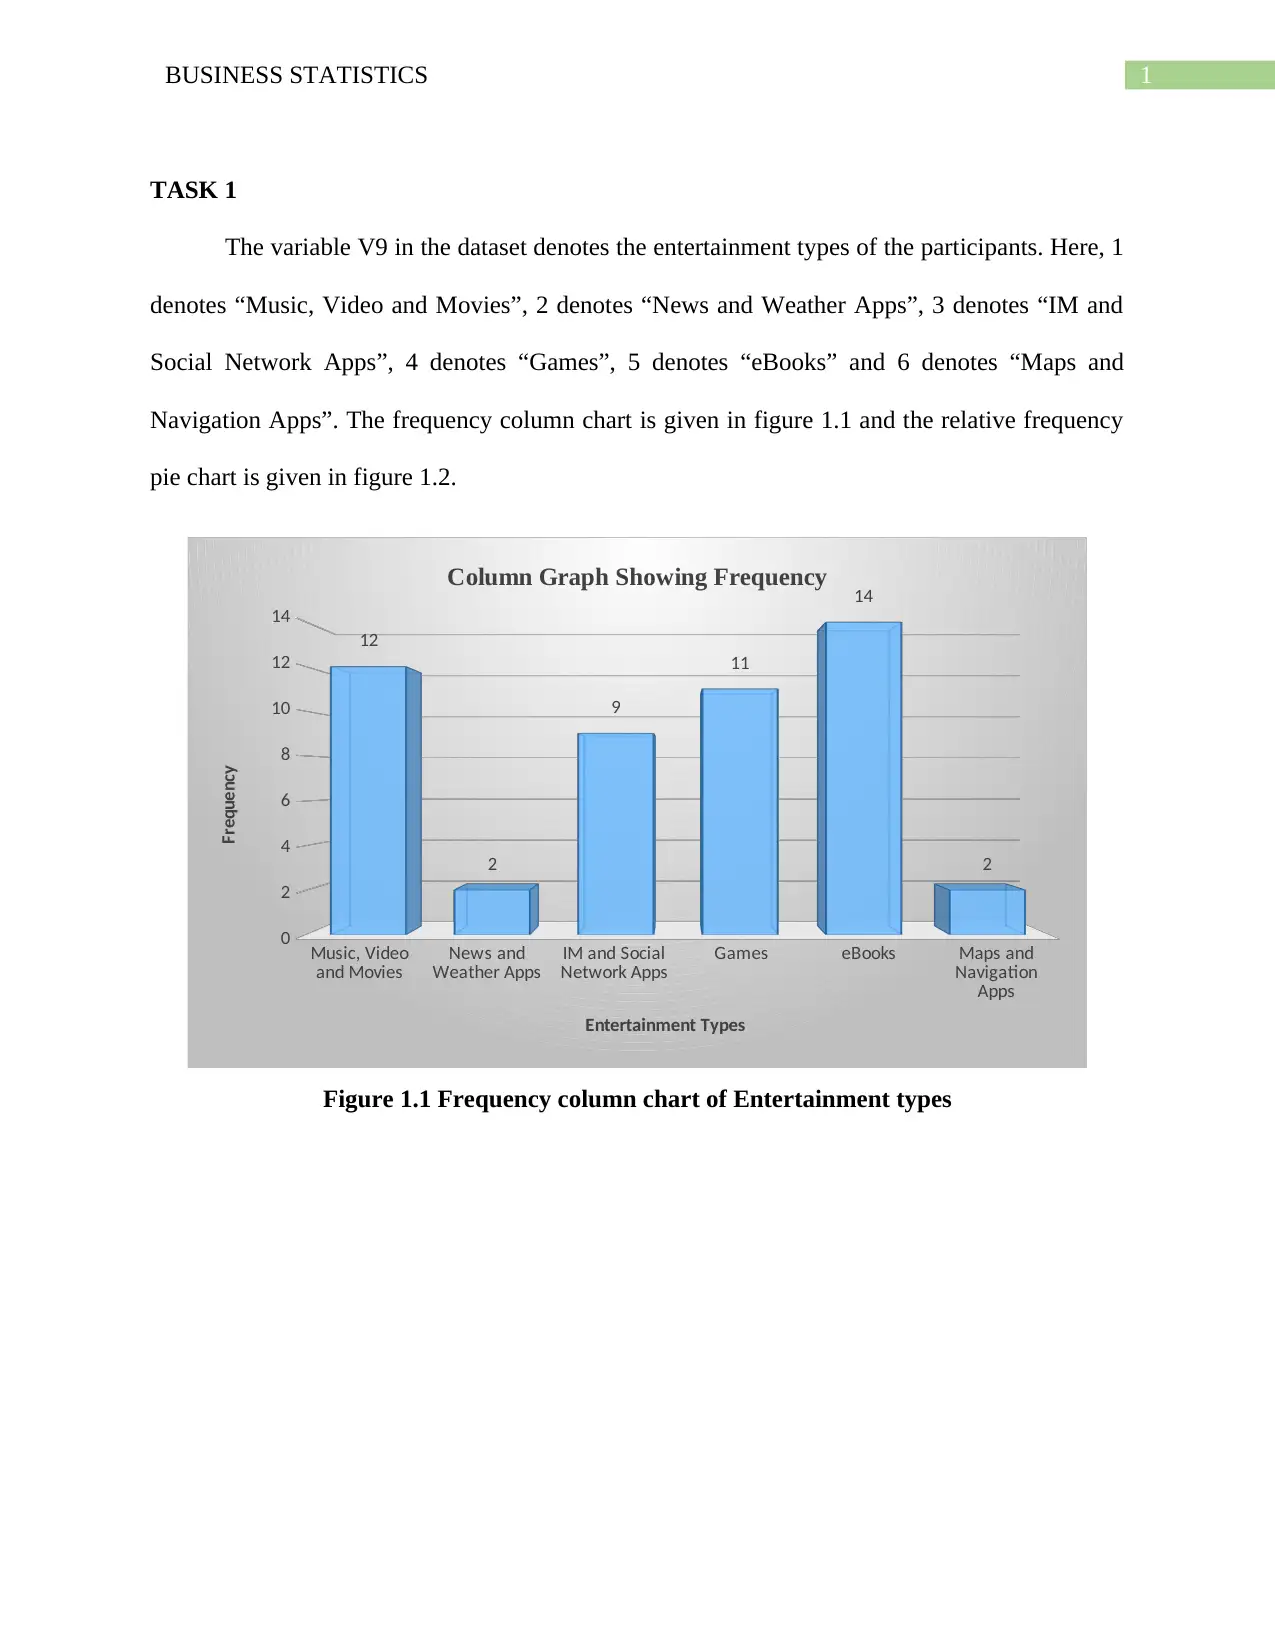
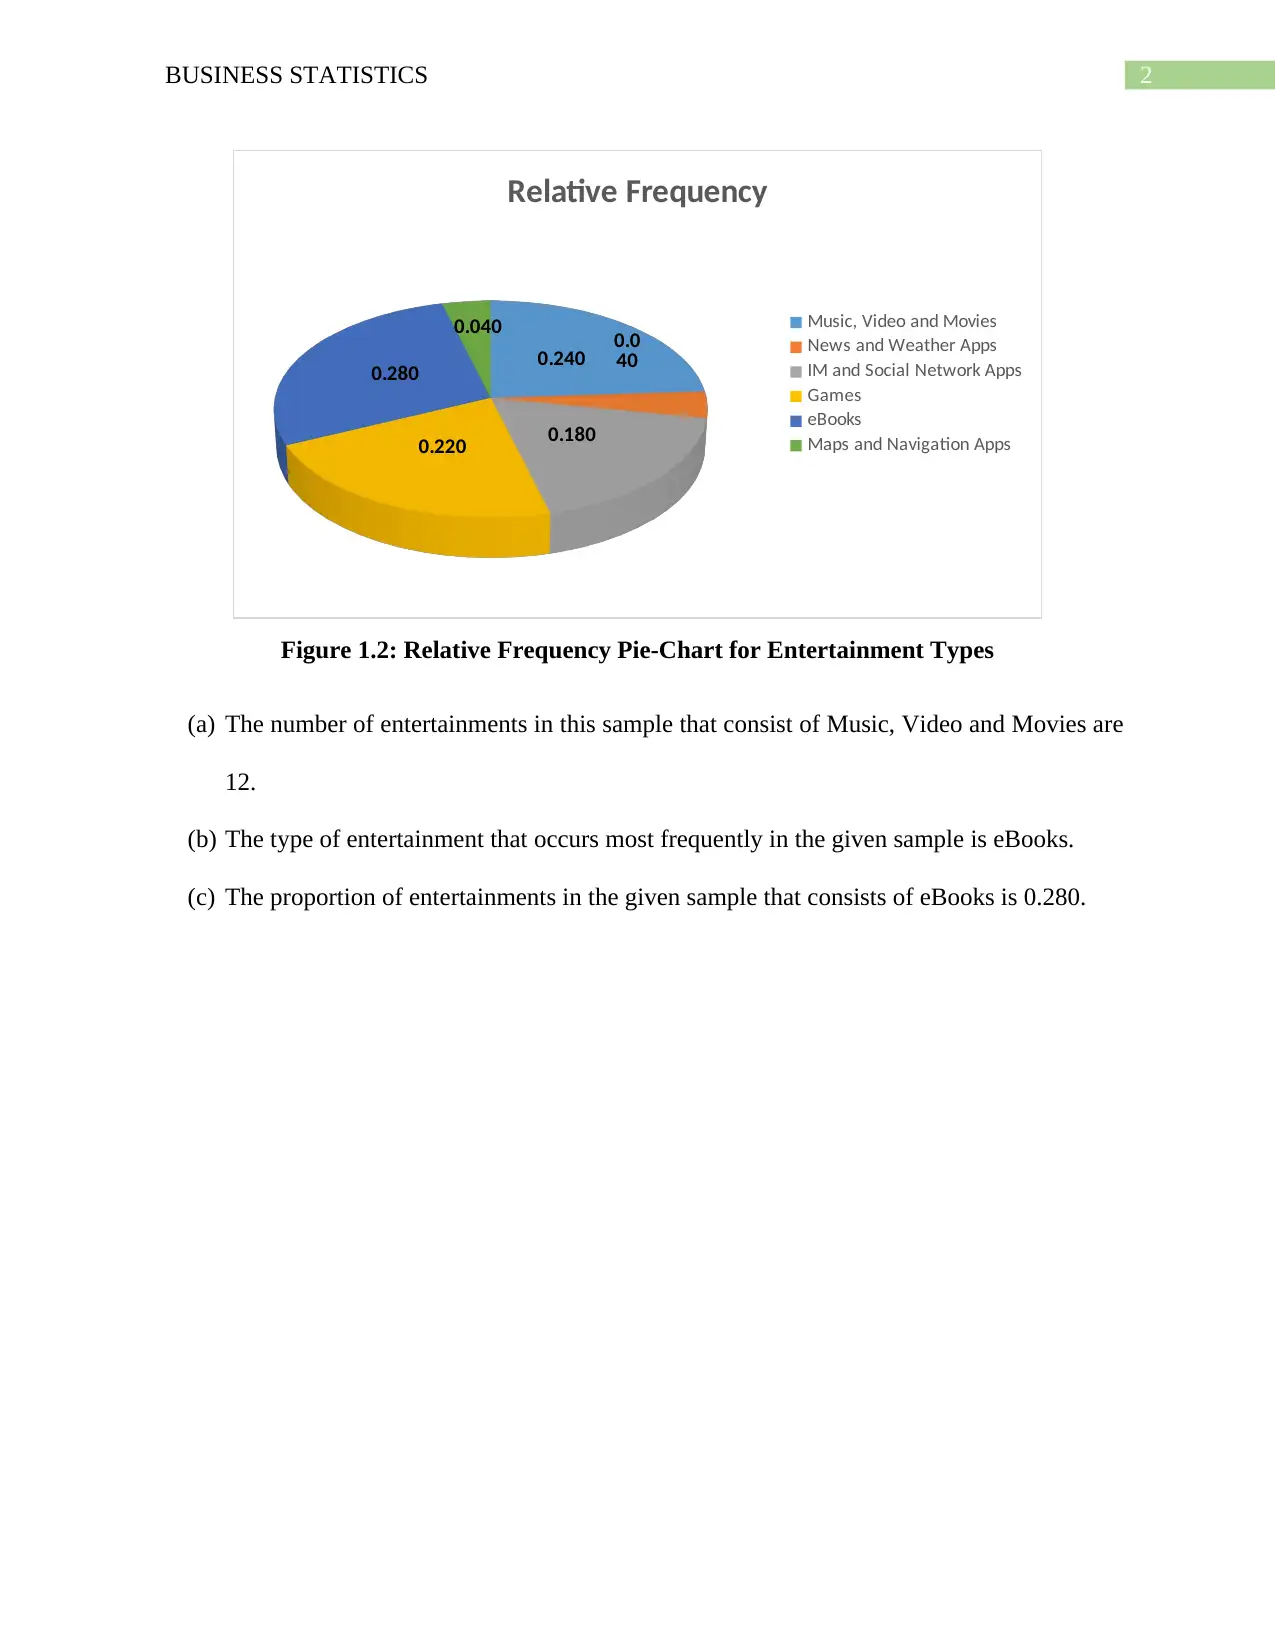
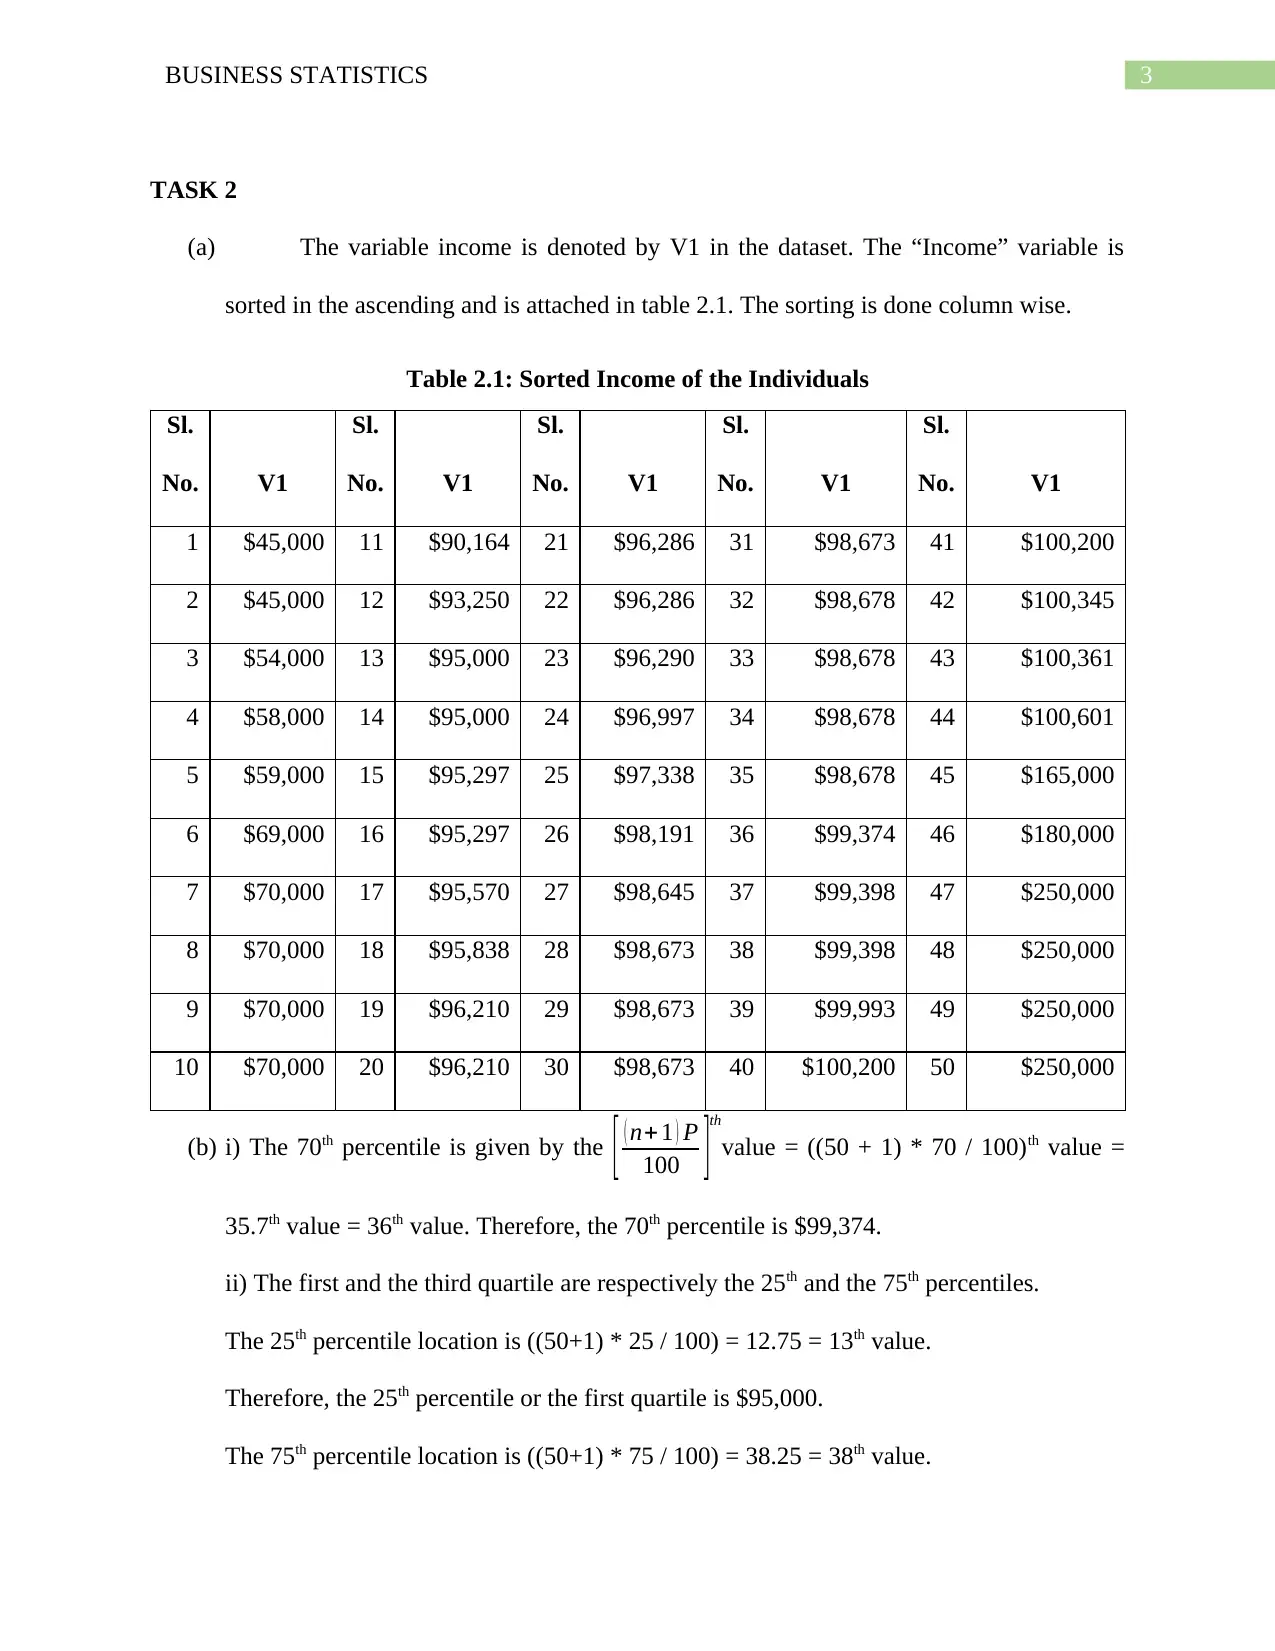
This document presents a solution to a business statistics assignment, focusing on the analysis of a dataset. The assignment includes two main tasks. Task 1 involves analyzing the variable V9, which represents entertainment types, using frequency column charts and relative frequency pie charts. The solution identifies the most frequent entertainment type and its proportion within the sample. Task 2 analyzes the variable V1, representing income, by sorting the data and calculating statistical measures. The solution calculates the 70th percentile, the first and third quartiles, the interquartile range, and provides interpretations of these values in the context of the income data. The document provides a comprehensive overview of the data analysis process and the interpretation of statistical results.
Document Page
Running Head: BUSINESS STATISTICS
Business Statistics
Name of the Student
Name of the University
Author Note
tabler-icon-diamond-filled.svg

Secure Best Marks with AI Grader

Need help grading? Try our AI Grader for instant feedback on your assignments.
Document Page
1BUSINESS STATISTICS
TASK 1
The variable V9 in the dataset denotes the entertainment types of the participants. Here, 1
denotes “Music, Video and Movies”, 2 denotes “News and Weather Apps”, 3 denotes “IM and
Social Network Apps”, 4 denotes “Games”, 5 denotes “eBooks” and 6 denotes “Maps and
Navigation Apps”. The frequency column chart is given in figure 1.1 and the relative frequency
pie chart is given in figure 1.2.
Music, Video
and Movies News and
Weather Apps IM and Social
Network Apps Games eBooks Maps and
Navigation
Apps
0
2
4
6
8
10
12
14
12
2
9
11
14
2
Column Graph Showing Frequency
Entertainment Types
Frequency
Figure 1.1 Frequency column chart of Entertainment types
Document Page
2BUSINESS STATISTICS
0.240 0.0
40
0.180
0.220
0.280
0.040
Relative Frequency
Music, Video and Movies
News and Weather Apps
IM and Social Network Apps
Games
eBooks
Maps and Navigation Apps
Figure 1.2: Relative Frequency Pie-Chart for Entertainment Types
(a) The number of entertainments in this sample that consist of Music, Video and Movies are
12.
(b) The type of entertainment that occurs most frequently in the given sample is eBooks.
(c) The proportion of entertainments in the given sample that consists of eBooks is 0.280.
Document Page
3BUSINESS STATISTICS
TASK 2
(a) The variable income is denoted by V1 in the dataset. The “Income” variable is
sorted in the ascending and is attached in table 2.1. The sorting is done column wise.
Table 2.1: Sorted Income of the Individuals
Sl.
No. V1
Sl.
No. V1
Sl.
No. V1
Sl.
No. V1
Sl.
No. V1
1 $45,000 11 $90,164 21 $96,286 31 $98,673 41 $100,200
2 $45,000 12 $93,250 22 $96,286 32 $98,678 42 $100,345
3 $54,000 13 $95,000 23 $96,290 33 $98,678 43 $100,361
4 $58,000 14 $95,000 24 $96,997 34 $98,678 44 $100,601
5 $59,000 15 $95,297 25 $97,338 35 $98,678 45 $165,000
6 $69,000 16 $95,297 26 $98,191 36 $99,374 46 $180,000
7 $70,000 17 $95,570 27 $98,645 37 $99,398 47 $250,000
8 $70,000 18 $95,838 28 $98,673 38 $99,398 48 $250,000
9 $70,000 19 $96,210 29 $98,673 39 $99,993 49 $250,000
10 $70,000 20 $96,210 30 $98,673 40 $100,200 50 $250,000
(b) i) The 70th percentile is given by the [ ( n+ 1 ) P
100 ]
th
value = ((50 + 1) * 70 / 100)th value =
35.7th value = 36th value. Therefore, the 70th percentile is $99,374.
ii) The first and the third quartile are respectively the 25th and the 75th percentiles.
The 25th percentile location is ((50+1) * 25 / 100) = 12.75 = 13th value.
Therefore, the 25th percentile or the first quartile is $95,000.
The 75th percentile location is ((50+1) * 75 / 100) = 38.25 = 38th value.
tabler-icon-diamond-filled.svg

Secure Best Marks with AI Grader

Need help grading? Try our AI Grader for instant feedback on your assignments.
Document Page
4BUSINESS STATISTICS
Therefore, the 75th percentile or the first quartile is $99,398.
(c) The 70th percentile indicates that 30 percent of the participants have an income higher
than $99,374.
(d) The interquartile range for income is given by the difference between the first and the
third quartile. Therefore, the interquartile range = $(99,398 – 95,000) = $4,398. Hence, it
can be said that 50 percent of the participant’s incomes lie between the range of $95,000
and $99,398.
chevron_up_icon
1 out of 5
circle_padding
hide_on_mobile
zoom_out_icon
[object Object]