Business Decision Making Report: UKCBC College Student Analysis
VerifiedAdded on 2020/06/04
|22
|5093
|64
Report
AI Summary
This report provides a comprehensive analysis of business decision-making processes, utilizing data collected from students at UKCBC College. The report begins by outlining the steps involved in data collection, including primary and secondary data sources, survey methodology, and the development of a questionnaire to assess student satisfaction and experiences. Statistical tools such as mean, median, and mode are employed to analyze the collected data, providing insights into central tendencies and student perceptions. The report also incorporates graphical representations and trend analysis to visualize the data and support interpretations. Furthermore, the project evaluation component includes information processing tools, network diagrams, and project evaluation methods like NPV and IRR to assess the viability of potential projects. The findings are presented in a formal business report, offering a detailed examination of the data, methodologies, and conclusions drawn from the study. The report covers a wide range of topics from data collection to project appraisal techniques.

BUSINESS DECISION MAKING
Paraphrase This Document
Need a fresh take? Get an instant paraphrase of this document with our AI Paraphraser
TABLE OF CONTENTS
TABLE OF CONTENTS..............................................................................................................2
INTRODUCTION...........................................................................................................................3
TASK 1............................................................................................................................................3
Steps need to be followed for collection of varied sort of data...................................................3
Survey methodology and sampling frame for research...............................................................4
Questionnaire for research...........................................................................................................5
TASK 2............................................................................................................................................6
2.1 Measures of central tendency................................................................................................6
2.2 Interpretation of values of tools of measures of central tendency.........................................8
2.3 Measures of dispersion..........................................................................................................9
2.4 Quartile, percentile and correlation coefficient...................................................................10
TASK 3..........................................................................................................................................12
3.1 Graphical representation of data..........................................................................................12
3.2 Trend analysis chart.............................................................................................................17
3.3 Enclosed in PPT...................................................................................................................18
3.4 Formal business report.........................................................................................................18
TASK 4..........................................................................................................................................19
4.1 Information processing tools...............................................................................................19
4.2 Network diagram.................................................................................................................20
4.3 Project evaluation method...................................................................................................20
CONCLUSION..............................................................................................................................21
REFERENCES..............................................................................................................................23
INTRODUCTION
At the workplace of every business, there are various kinds of problems and issues arise
which are resolved through effective decisions. When any kind of business decisions are made
then several types of data, tools and techniques are taken into account by the management which
are represented at the current report. In order to prepare the project, UKCBC College is
considered which is UK based and provide several kinds of education to the students. Here, level
of experience as well as satisfaction is to be identified and analysed by the researcher by
collecting data from the students of respective college. At this study statistical tools and methods
like mean, mode, standard deviation, quartile, median, percentile etc. are applied on the data set
which is gathered from the pupils. Apart from this, collected information are represented using
different kinds of charts and graphs along with the proper interpretation. Furthermore,
investment appraisal techniques like NPV and IRR are calculated for assessing project viability.
TASK 1
Steps need to be followed for collection of varied sort of data
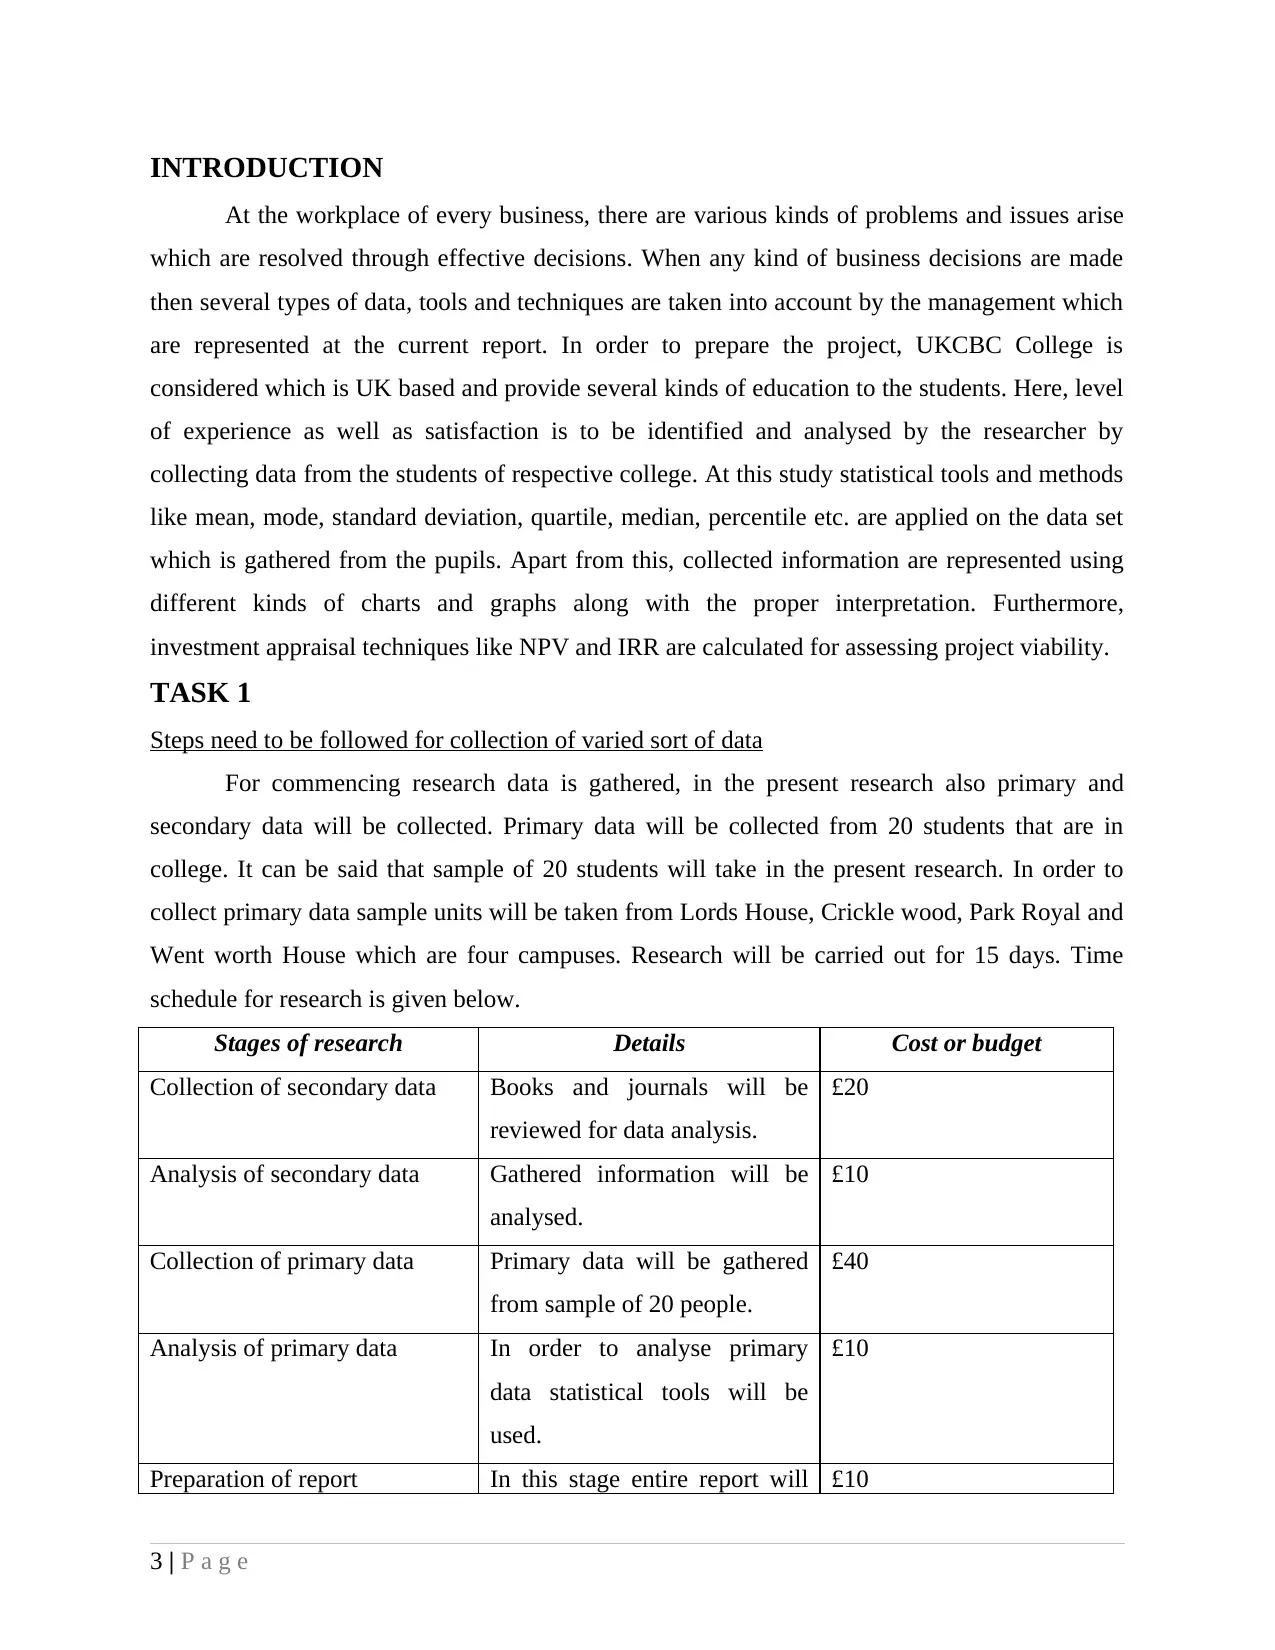
For commencing research data is gathered, in the present research also primary and
secondary data will be collected. Primary data will be collected from 20 students that are in
college. It can be said that sample of 20 students will take in the present research. In order to
collect primary data sample units will be taken from Lords House, Crickle wood, Park Royal and
Went worth House which are four campuses. Research will be carried out for 15 days. Time
schedule for research is given below.
Stages of research Details Cost or budget
Collection of secondary data Books and journals will be
reviewed for data analysis.
£20
Analysis of secondary data Gathered information will be
analysed.
£10
Collection of primary data Primary data will be gathered
from sample of 20 people.
£40
Analysis of primary data In order to analyse primary
data statistical tools will be
used.
£10
Preparation of report In this stage entire report will £10
3 | P a g e
At the workplace of every business, there are various kinds of problems and issues arise
which are resolved through effective decisions. When any kind of business decisions are made
then several types of data, tools and techniques are taken into account by the management which
are represented at the current report. In order to prepare the project, UKCBC College is
considered which is UK based and provide several kinds of education to the students. Here, level
of experience as well as satisfaction is to be identified and analysed by the researcher by
collecting data from the students of respective college. At this study statistical tools and methods
like mean, mode, standard deviation, quartile, median, percentile etc. are applied on the data set
which is gathered from the pupils. Apart from this, collected information are represented using
different kinds of charts and graphs along with the proper interpretation. Furthermore,
investment appraisal techniques like NPV and IRR are calculated for assessing project viability.
TASK 1
Steps need to be followed for collection of varied sort of data
For commencing research data is gathered, in the present research also primary and
secondary data will be collected. Primary data will be collected from 20 students that are in
college. It can be said that sample of 20 students will take in the present research. In order to
collect primary data sample units will be taken from Lords House, Crickle wood, Park Royal and
Went worth House which are four campuses. Research will be carried out for 15 days. Time
schedule for research is given below.
Stages of research Details Cost or budget
Collection of secondary data Books and journals will be
reviewed for data analysis.
£20
Analysis of secondary data Gathered information will be
analysed.
£10
Collection of primary data Primary data will be gathered
from sample of 20 people.
£40
Analysis of primary data In order to analyse primary
data statistical tools will be
used.
£10
Preparation of report In this stage entire report will £10
3 | P a g e
⊘ This is a preview!⊘
Do you want full access?
Subscribe today to unlock all pages.
Trusted by 1+ million students worldwide
be prepared.
£90
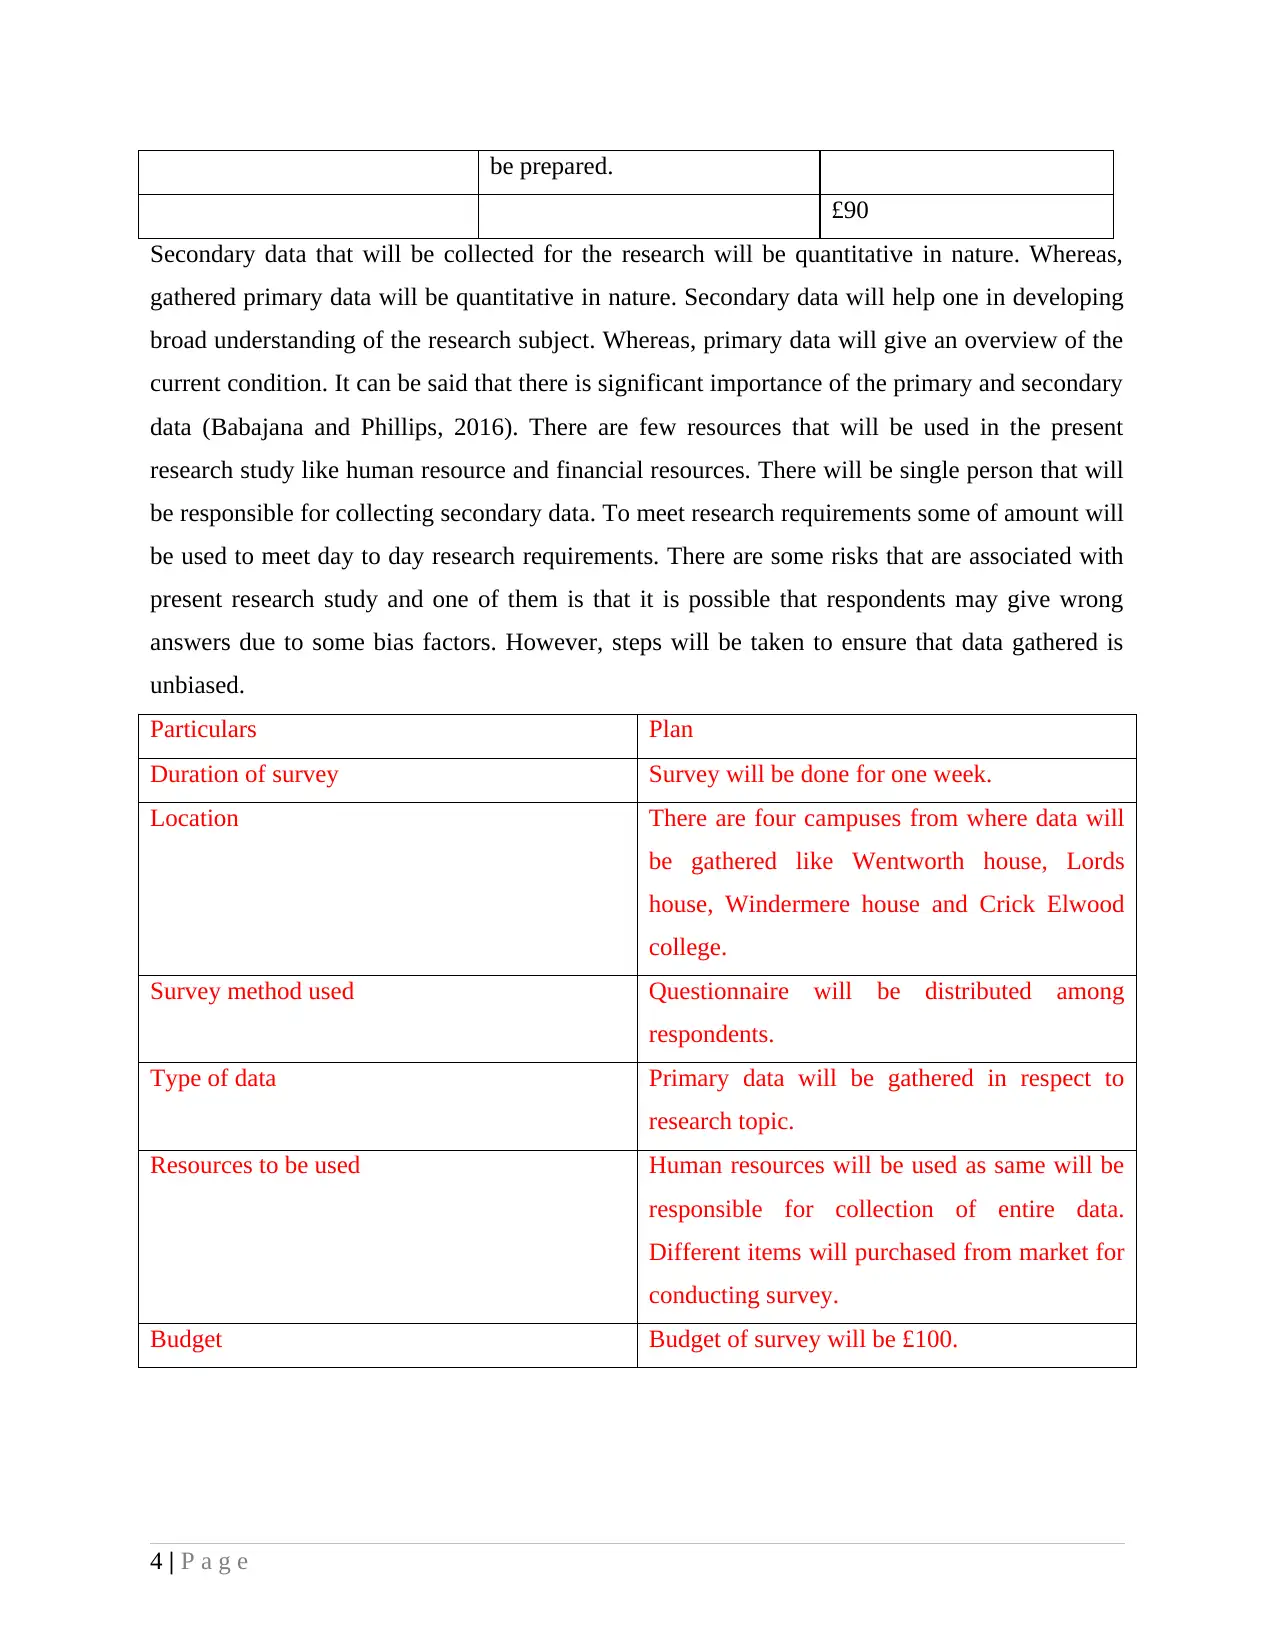
Secondary data that will be collected for the research will be quantitative in nature. Whereas,
gathered primary data will be quantitative in nature. Secondary data will help one in developing
broad understanding of the research subject. Whereas, primary data will give an overview of the
current condition. It can be said that there is significant importance of the primary and secondary
data (Babajana and Phillips, 2016). There are few resources that will be used in the present
research study like human resource and financial resources. There will be single person that will
be responsible for collecting secondary data. To meet research requirements some of amount will
be used to meet day to day research requirements. There are some risks that are associated with
present research study and one of them is that it is possible that respondents may give wrong
answers due to some bias factors. However, steps will be taken to ensure that data gathered is
unbiased.
Particulars Plan
Duration of survey Survey will be done for one week.
Location There are four campuses from where data will
be gathered like Wentworth house, Lords
house, Windermere house and Crick Elwood
college.
Survey method used Questionnaire will be distributed among
respondents.
Type of data Primary data will be gathered in respect to
research topic.
Resources to be used Human resources will be used as same will be
responsible for collection of entire data.
Different items will purchased from market for
conducting survey.
Budget Budget of survey will be £100.
4 | P a g e
£90
Secondary data that will be collected for the research will be quantitative in nature. Whereas,
gathered primary data will be quantitative in nature. Secondary data will help one in developing
broad understanding of the research subject. Whereas, primary data will give an overview of the
current condition. It can be said that there is significant importance of the primary and secondary
data (Babajana and Phillips, 2016). There are few resources that will be used in the present
research study like human resource and financial resources. There will be single person that will
be responsible for collecting secondary data. To meet research requirements some of amount will
be used to meet day to day research requirements. There are some risks that are associated with
present research study and one of them is that it is possible that respondents may give wrong
answers due to some bias factors. However, steps will be taken to ensure that data gathered is
unbiased.
Particulars Plan
Duration of survey Survey will be done for one week.
Location There are four campuses from where data will
be gathered like Wentworth house, Lords
house, Windermere house and Crick Elwood
college.
Survey method used Questionnaire will be distributed among
respondents.
Type of data Primary data will be gathered in respect to
research topic.
Resources to be used Human resources will be used as same will be
responsible for collection of entire data.
Different items will purchased from market for
conducting survey.
Budget Budget of survey will be £100.
4 | P a g e
Paraphrase This Document
Need a fresh take? Get an instant paraphrase of this document with our AI Paraphraser
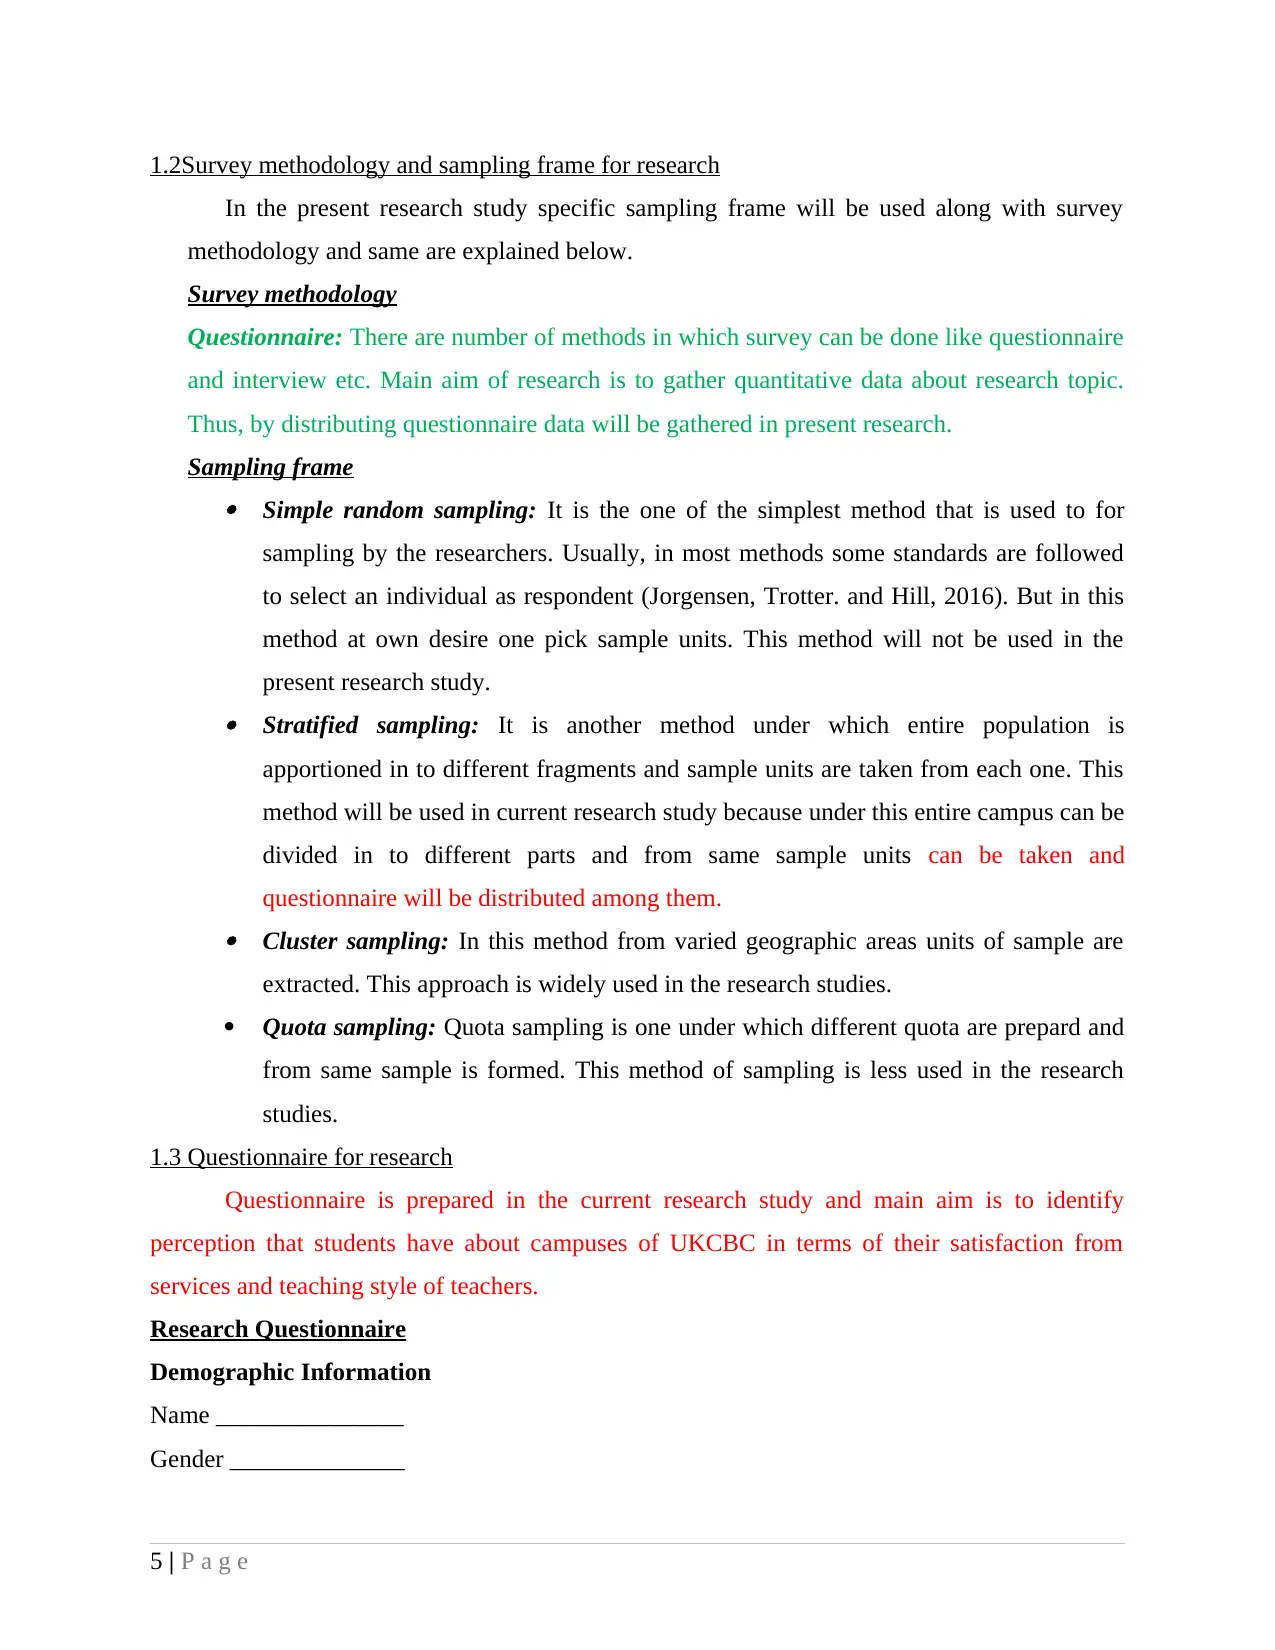
1.2Survey methodology and sampling frame for research
In the present research study specific sampling frame will be used along with survey
methodology and same are explained below.
Survey methodology
Questionnaire: There are number of methods in which survey can be done like questionnaire
and interview etc. Main aim of research is to gather quantitative data about research topic.
Thus, by distributing questionnaire data will be gathered in present research.
Sampling frame
Simple random sampling: It is the one of the simplest method that is used to for
sampling by the researchers. Usually, in most methods some standards are followed
to select an individual as respondent (Jorgensen, Trotter. and Hill, 2016). But in this
method at own desire one pick sample units. This method will not be used in the
present research study.
Stratified sampling: It is another method under which entire population is
apportioned in to different fragments and sample units are taken from each one. This
method will be used in current research study because under this entire campus can be
divided in to different parts and from same sample units can be taken and
questionnaire will be distributed among them.
Cluster sampling: In this method from varied geographic areas units of sample are
extracted. This approach is widely used in the research studies.
Quota sampling: Quota sampling is one under which different quota are prepard and
from same sample is formed. This method of sampling is less used in the research
studies.
1.3 Questionnaire for research
Questionnaire is prepared in the current research study and main aim is to identify
perception that students have about campuses of UKCBC in terms of their satisfaction from
services and teaching style of teachers.
Research Questionnaire
Demographic Information
Name _______________
Gender ______________
5 | P a g e
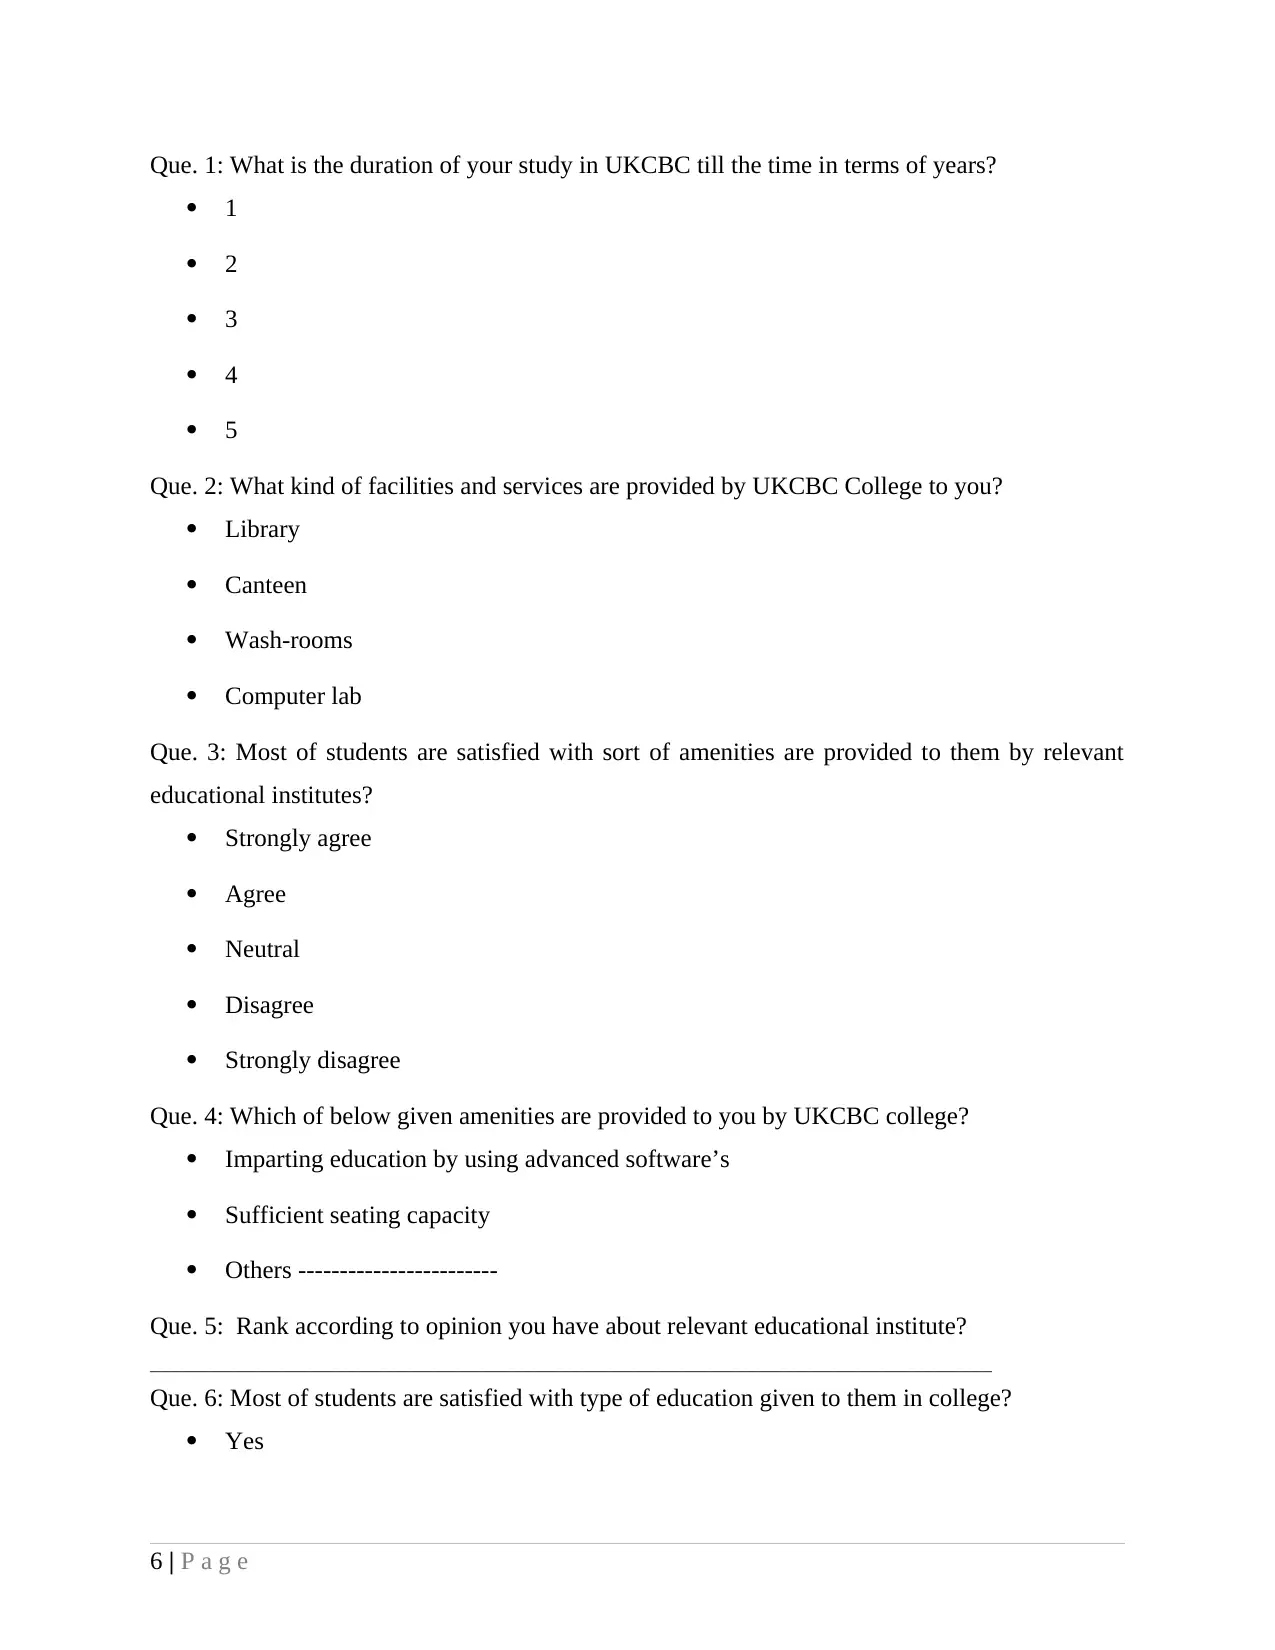
Que. 1: What is the duration of your study in UKCBC till the time in terms of years?
1
2
3
4
5
Que. 2: What kind of facilities and services are provided by UKCBC College to you?
Library
Canteen
Wash-rooms
Computer lab
Que. 3: Most of students are satisfied with sort of amenities are provided to them by relevant
educational institutes?
Strongly agree
Agree
Neutral
Disagree
Strongly disagree
Que. 4: Which of below given amenities are provided to you by UKCBC college?
Imparting education by using advanced software’s
Sufficient seating capacity
Others ------------------------
Que. 5: Rank according to opinion you have about relevant educational institute?
_____________________________________________________________________________________________________
Que. 6: Most of students are satisfied with type of education given to them in college?
Yes
6 | P a g e
⊘ This is a preview!⊘
Do you want full access?
Subscribe today to unlock all pages.
Trusted by 1+ million students worldwide
No
Que. 9: Do you think that there is need to bring change in current education system.
Yes
No
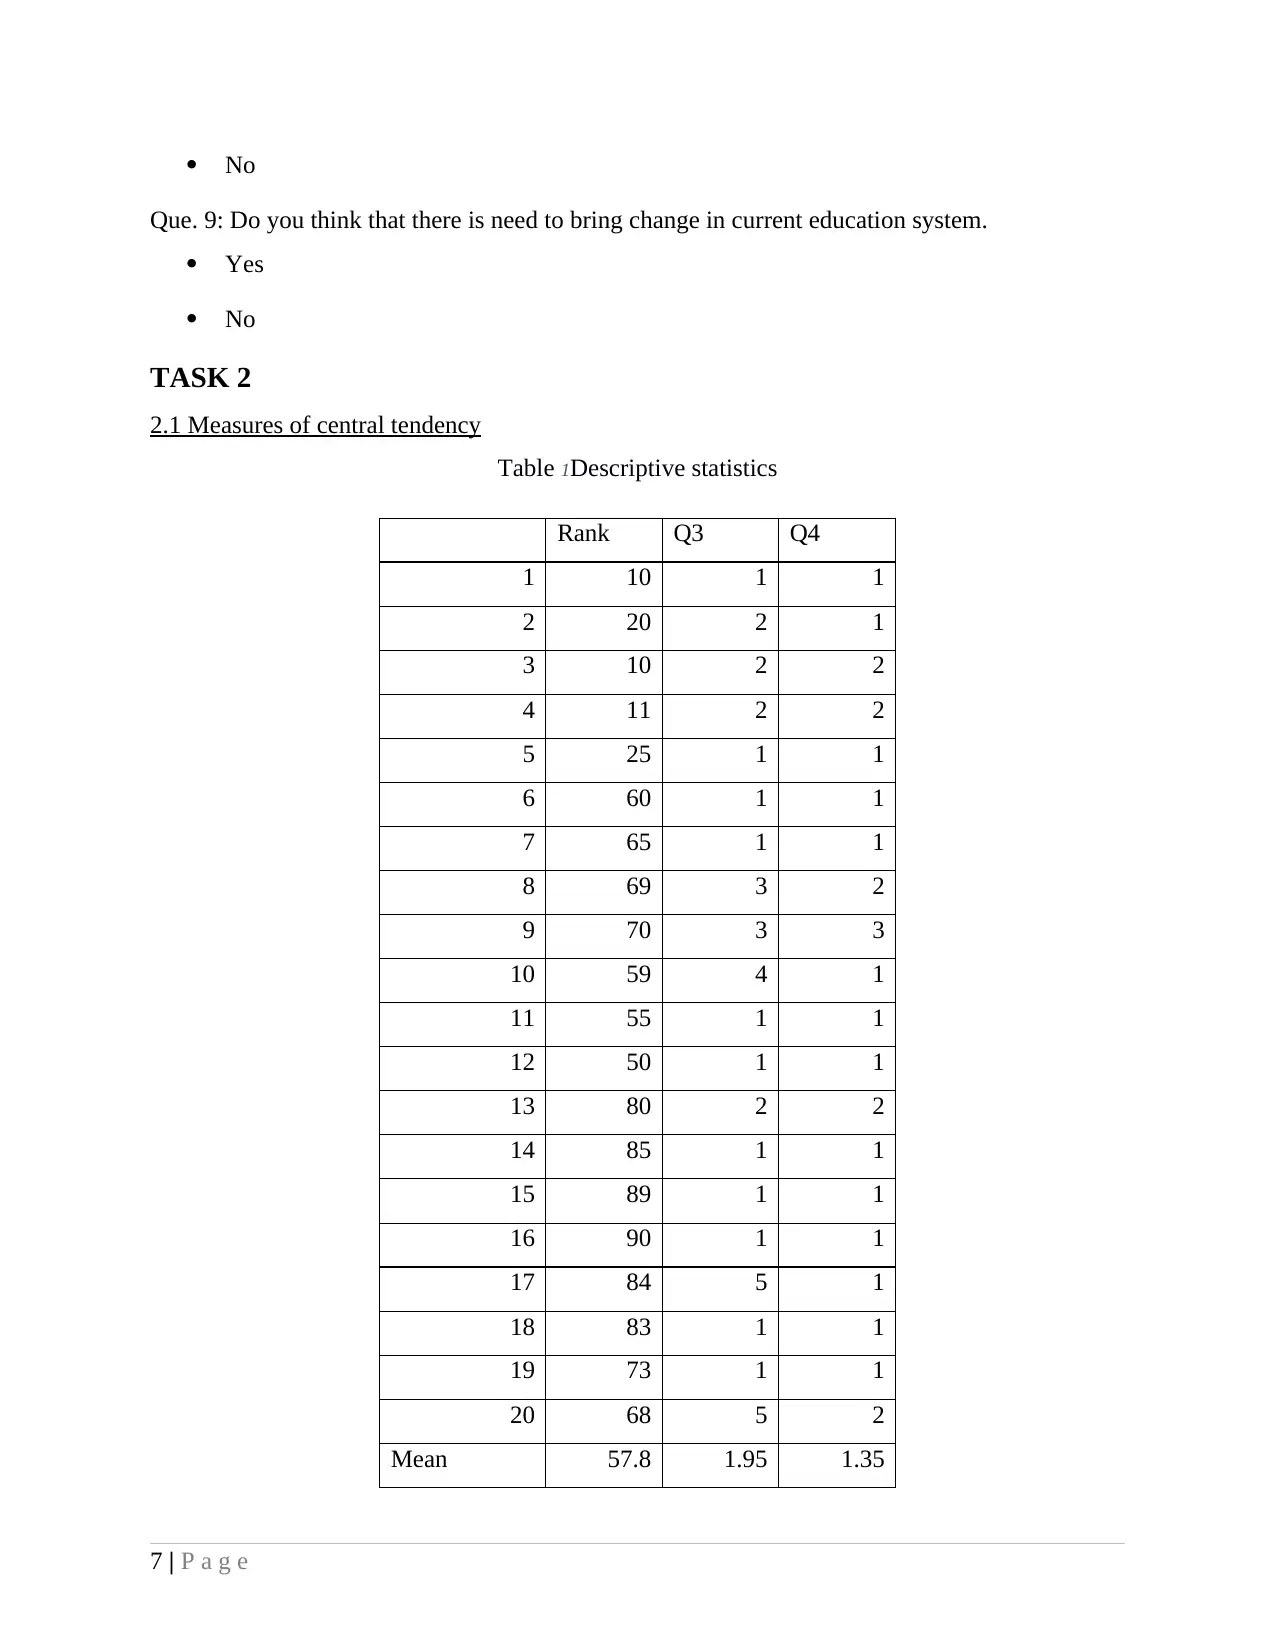
TASK 2
2.1 Measures of central tendency
Table 1Descriptive statistics
Rank Q3 Q4
1 10 1 1
2 20 2 1
3 10 2 2
4 11 2 2
5 25 1 1
6 60 1 1
7 65 1 1
8 69 3 2
9 70 3 3
10 59 4 1
11 55 1 1
12 50 1 1
13 80 2 2
14 85 1 1
15 89 1 1
16 90 1 1
17 84 5 1
18 83 1 1
19 73 1 1
20 68 5 2
Mean 57.8 1.95 1.35
7 | P a g e
Que. 9: Do you think that there is need to bring change in current education system.
Yes
No
TASK 2
2.1 Measures of central tendency
Table 1Descriptive statistics
Rank Q3 Q4
1 10 1 1
2 20 2 1
3 10 2 2
4 11 2 2
5 25 1 1
6 60 1 1
7 65 1 1
8 69 3 2
9 70 3 3
10 59 4 1
11 55 1 1
12 50 1 1
13 80 2 2
14 85 1 1
15 89 1 1
16 90 1 1
17 84 5 1
18 83 1 1
19 73 1 1
20 68 5 2
Mean 57.8 1.95 1.35
7 | P a g e
Paraphrase This Document
Need a fresh take? Get an instant paraphrase of this document with our AI Paraphraser
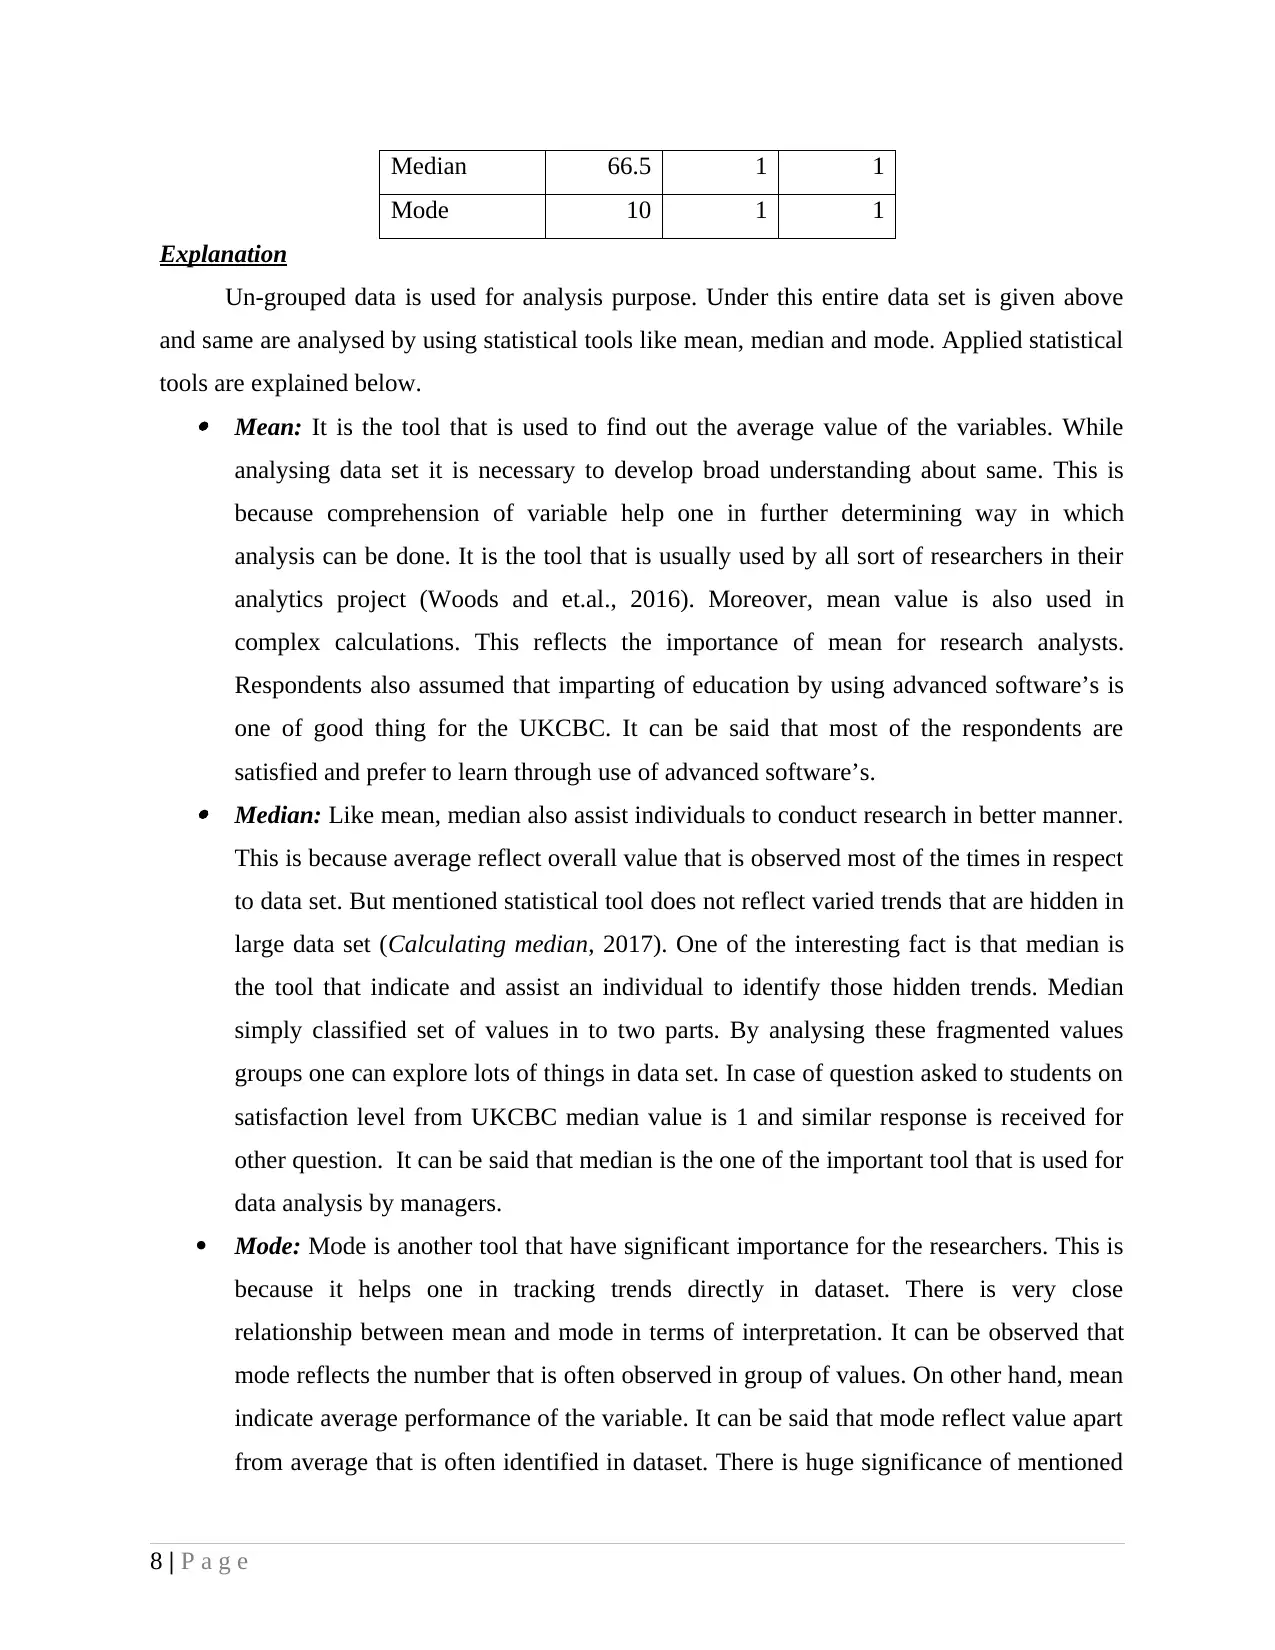
Median 66.5 1 1
Mode 10 1 1
Explanation
Un-grouped data is used for analysis purpose. Under this entire data set is given above
and same are analysed by using statistical tools like mean, median and mode. Applied statistical
tools are explained below. Mean: It is the tool that is used to find out the average value of the variables. While
analysing data set it is necessary to develop broad understanding about same. This is
because comprehension of variable help one in further determining way in which
analysis can be done. It is the tool that is usually used by all sort of researchers in their
analytics project (Woods and et.al., 2016). Moreover, mean value is also used in
complex calculations. This reflects the importance of mean for research analysts.
Respondents also assumed that imparting of education by using advanced software’s is
one of good thing for the UKCBC. It can be said that most of the respondents are
satisfied and prefer to learn through use of advanced software’s. Median: Like mean, median also assist individuals to conduct research in better manner.
This is because average reflect overall value that is observed most of the times in respect
to data set. But mentioned statistical tool does not reflect varied trends that are hidden in
large data set (Calculating median, 2017). One of the interesting fact is that median is
the tool that indicate and assist an individual to identify those hidden trends. Median
simply classified set of values in to two parts. By analysing these fragmented values
groups one can explore lots of things in data set. In case of question asked to students on
satisfaction level from UKCBC median value is 1 and similar response is received for
other question. It can be said that median is the one of the important tool that is used for
data analysis by managers.
Mode: Mode is another tool that have significant importance for the researchers. This is
because it helps one in tracking trends directly in dataset. There is very close
relationship between mean and mode in terms of interpretation. It can be observed that
mode reflects the number that is often observed in group of values. On other hand, mean
indicate average performance of the variable. It can be said that mode reflect value apart
from average that is often identified in dataset. There is huge significance of mentioned
8 | P a g e
tool for data scientists. Mode value in respect to satisfaction level of students is 1 and
same is for other question. It can be said that number of respondents are satisfied and
prefer to take education by using advance software.
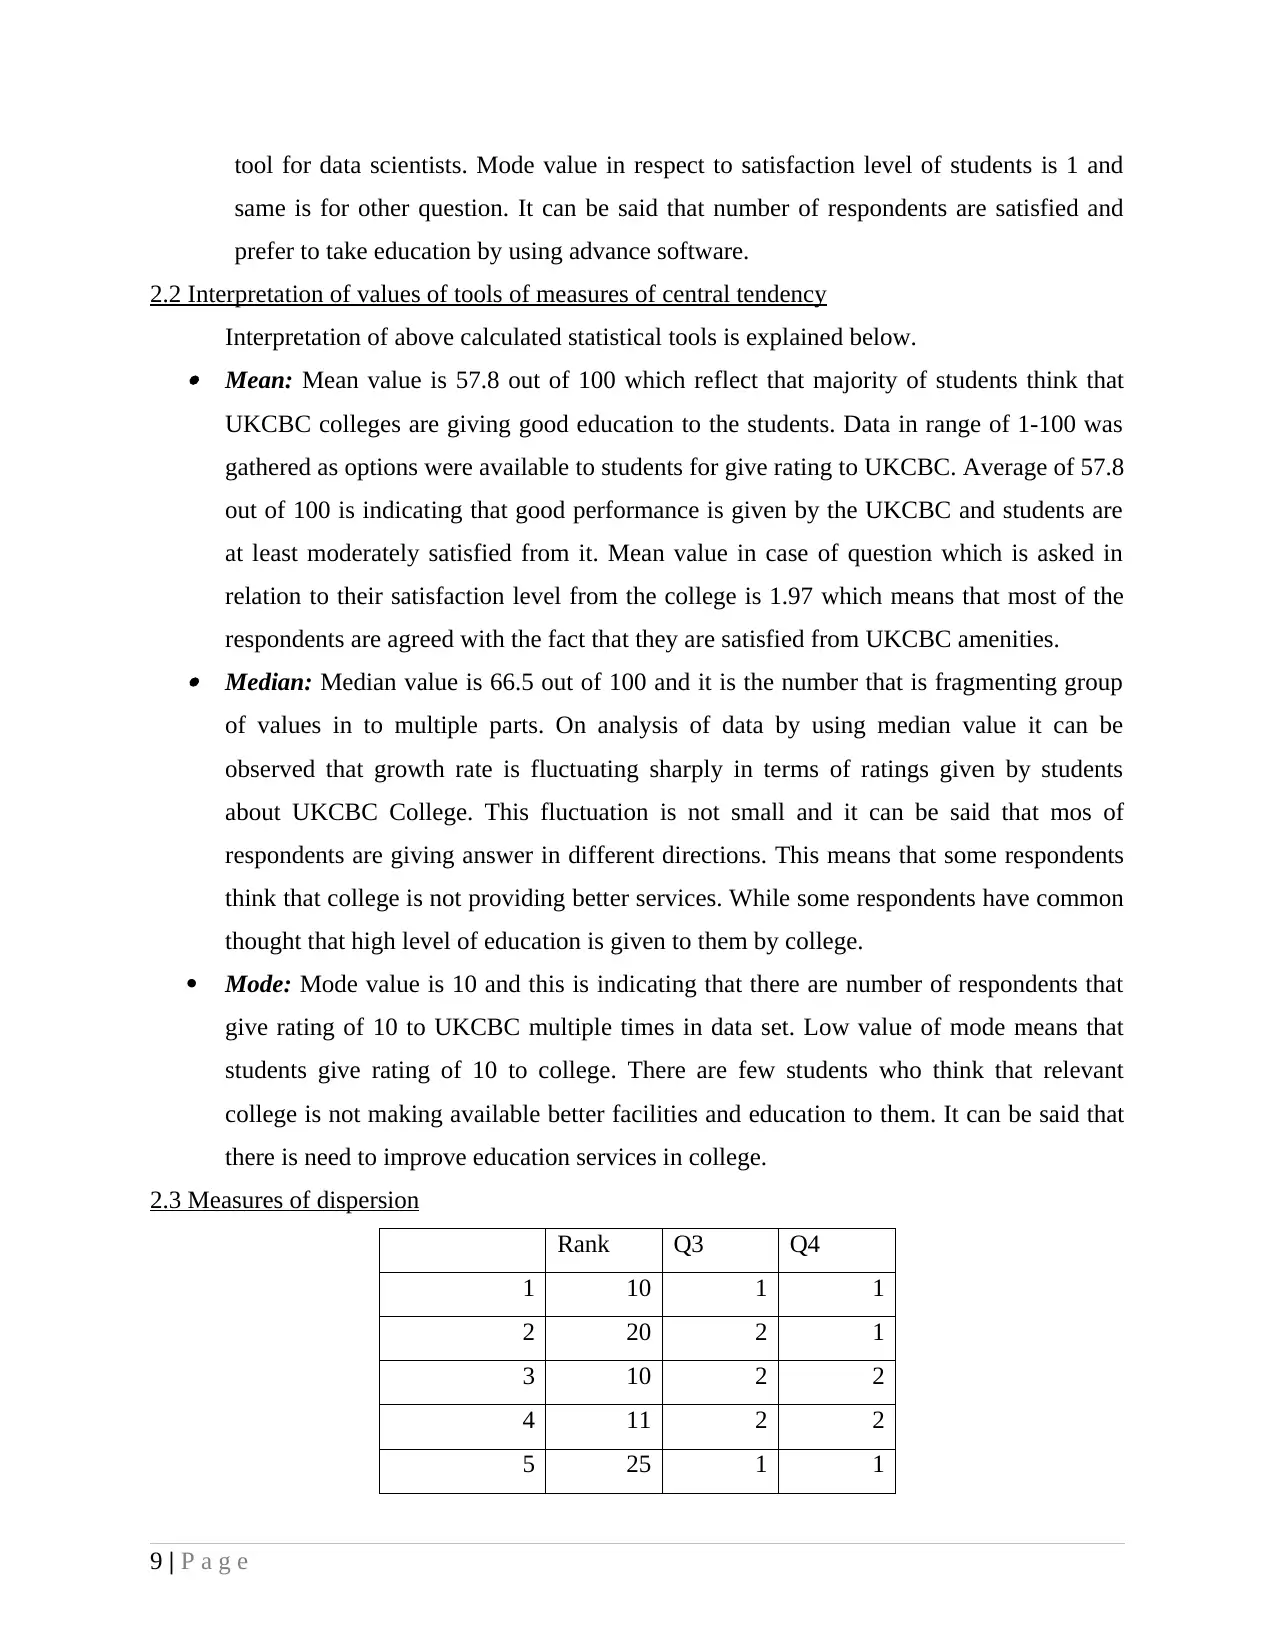
2.2 Interpretation of values of tools of measures of central tendency
Interpretation of above calculated statistical tools is explained below. Mean: Mean value is 57.8 out of 100 which reflect that majority of students think that
UKCBC colleges are giving good education to the students. Data in range of 1-100 was
gathered as options were available to students for give rating to UKCBC. Average of 57.8
out of 100 is indicating that good performance is given by the UKCBC and students are
at least moderately satisfied from it. Mean value in case of question which is asked in
relation to their satisfaction level from the college is 1.97 which means that most of the
respondents are agreed with the fact that they are satisfied from UKCBC amenities. Median: Median value is 66.5 out of 100 and it is the number that is fragmenting group
of values in to multiple parts. On analysis of data by using median value it can be
observed that growth rate is fluctuating sharply in terms of ratings given by students
about UKCBC College. This fluctuation is not small and it can be said that mos of
respondents are giving answer in different directions. This means that some respondents
think that college is not providing better services. While some respondents have common
thought that high level of education is given to them by college.
Mode: Mode value is 10 and this is indicating that there are number of respondents that
give rating of 10 to UKCBC multiple times in data set. Low value of mode means that
students give rating of 10 to college. There are few students who think that relevant
college is not making available better facilities and education to them. It can be said that
there is need to improve education services in college.
2.3 Measures of dispersion
Rank Q3 Q4
1 10 1 1
2 20 2 1
3 10 2 2
4 11 2 2
5 25 1 1
9 | P a g e
same is for other question. It can be said that number of respondents are satisfied and
prefer to take education by using advance software.
2.2 Interpretation of values of tools of measures of central tendency
Interpretation of above calculated statistical tools is explained below. Mean: Mean value is 57.8 out of 100 which reflect that majority of students think that
UKCBC colleges are giving good education to the students. Data in range of 1-100 was
gathered as options were available to students for give rating to UKCBC. Average of 57.8
out of 100 is indicating that good performance is given by the UKCBC and students are
at least moderately satisfied from it. Mean value in case of question which is asked in
relation to their satisfaction level from the college is 1.97 which means that most of the
respondents are agreed with the fact that they are satisfied from UKCBC amenities. Median: Median value is 66.5 out of 100 and it is the number that is fragmenting group
of values in to multiple parts. On analysis of data by using median value it can be
observed that growth rate is fluctuating sharply in terms of ratings given by students
about UKCBC College. This fluctuation is not small and it can be said that mos of
respondents are giving answer in different directions. This means that some respondents
think that college is not providing better services. While some respondents have common
thought that high level of education is given to them by college.
Mode: Mode value is 10 and this is indicating that there are number of respondents that
give rating of 10 to UKCBC multiple times in data set. Low value of mode means that
students give rating of 10 to college. There are few students who think that relevant
college is not making available better facilities and education to them. It can be said that
there is need to improve education services in college.
2.3 Measures of dispersion
Rank Q3 Q4
1 10 1 1
2 20 2 1
3 10 2 2
4 11 2 2
5 25 1 1
9 | P a g e
⊘ This is a preview!⊘
Do you want full access?
Subscribe today to unlock all pages.
Trusted by 1+ million students worldwide
6 60 1 1
7 65 1 1
8 69 3 2
9 70 3 3
10 59 4 1
11 55 1 1
12 50 1 1
13 80 2 2
14 85 1 1
15 89 1 1
16 90 1 1
17 84 5 1
18 83 1 1
19 73 1 1
20 68 5 2
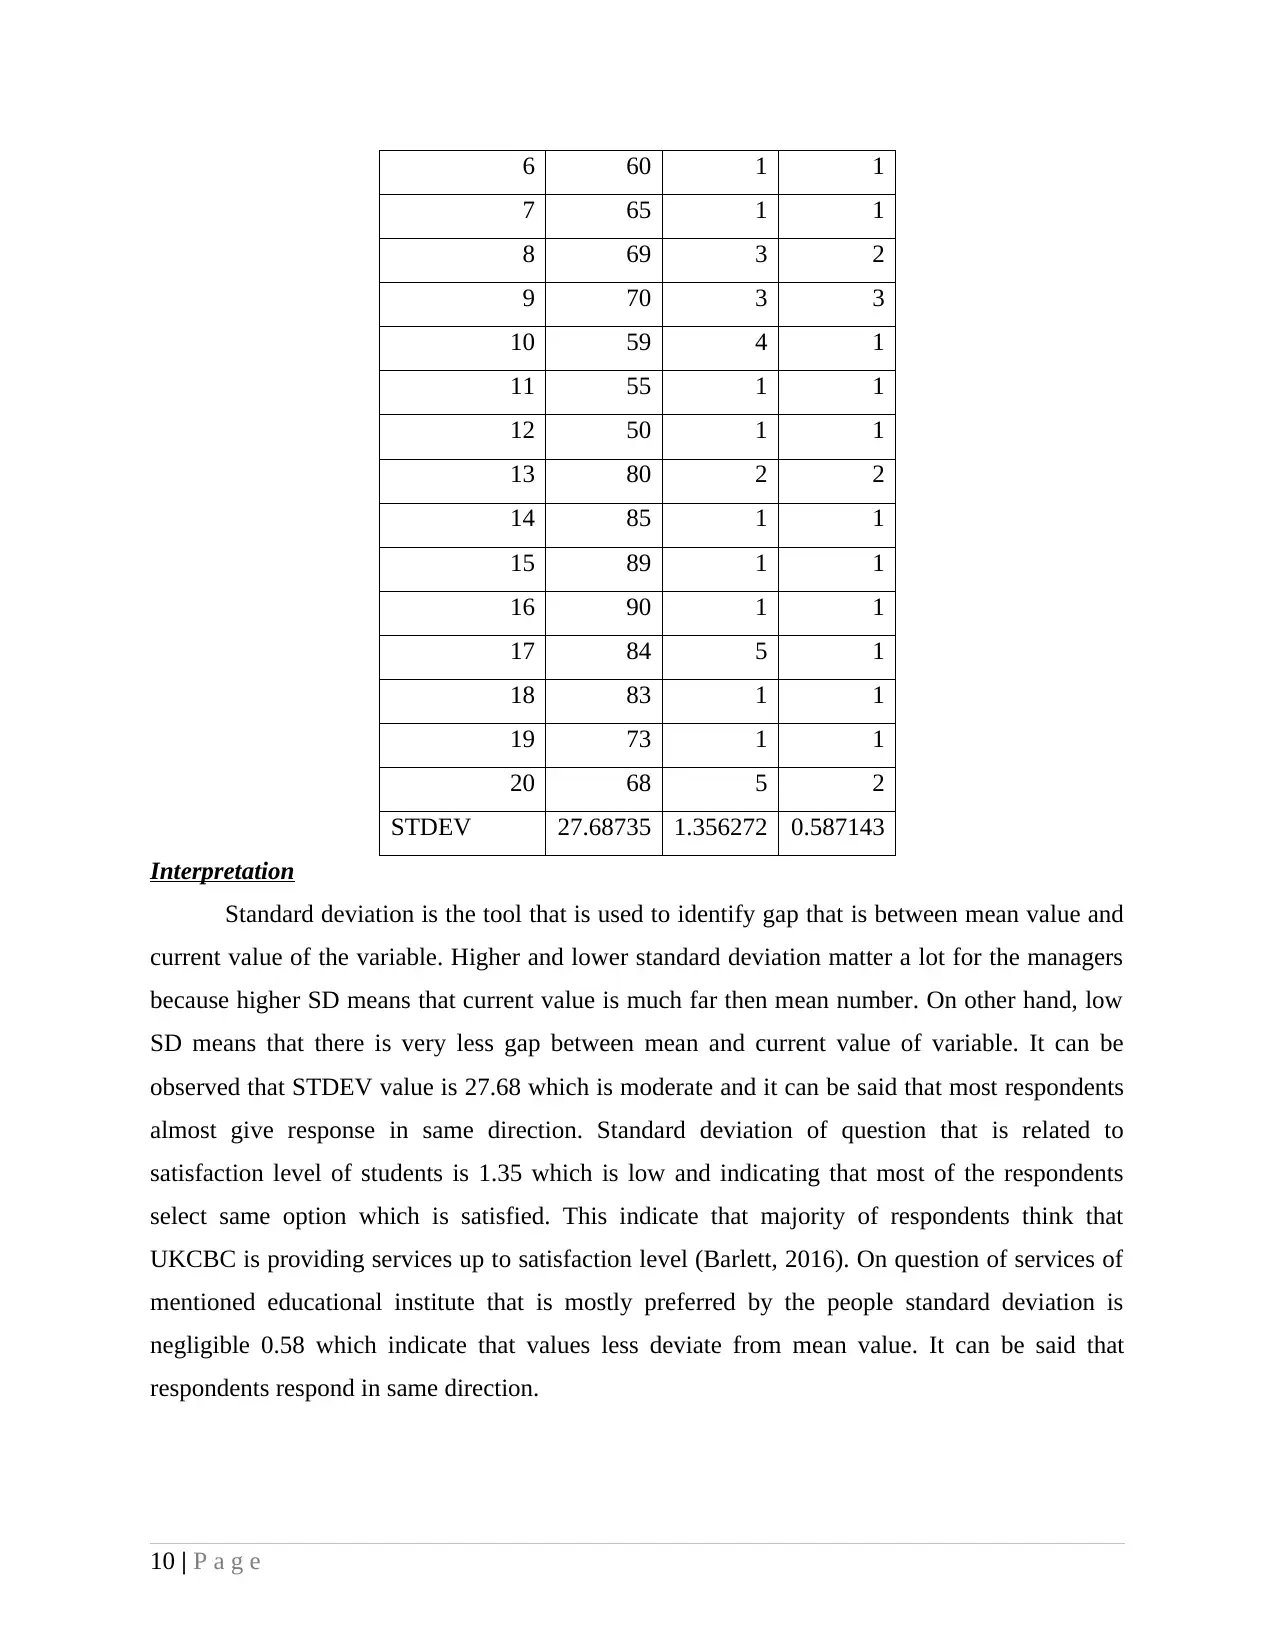
STDEV 27.68735 1.356272 0.587143
Interpretation
Standard deviation is the tool that is used to identify gap that is between mean value and
current value of the variable. Higher and lower standard deviation matter a lot for the managers
because higher SD means that current value is much far then mean number. On other hand, low
SD means that there is very less gap between mean and current value of variable. It can be
observed that STDEV value is 27.68 which is moderate and it can be said that most respondents
almost give response in same direction. Standard deviation of question that is related to
satisfaction level of students is 1.35 which is low and indicating that most of the respondents
select same option which is satisfied. This indicate that majority of respondents think that
UKCBC is providing services up to satisfaction level (Barlett, 2016). On question of services of
mentioned educational institute that is mostly preferred by the people standard deviation is
negligible 0.58 which indicate that values less deviate from mean value. It can be said that
respondents respond in same direction.
10 | P a g e
7 65 1 1
8 69 3 2
9 70 3 3
10 59 4 1
11 55 1 1
12 50 1 1
13 80 2 2
14 85 1 1
15 89 1 1
16 90 1 1
17 84 5 1
18 83 1 1
19 73 1 1
20 68 5 2
STDEV 27.68735 1.356272 0.587143
Interpretation
Standard deviation is the tool that is used to identify gap that is between mean value and
current value of the variable. Higher and lower standard deviation matter a lot for the managers
because higher SD means that current value is much far then mean number. On other hand, low
SD means that there is very less gap between mean and current value of variable. It can be
observed that STDEV value is 27.68 which is moderate and it can be said that most respondents
almost give response in same direction. Standard deviation of question that is related to
satisfaction level of students is 1.35 which is low and indicating that most of the respondents
select same option which is satisfied. This indicate that majority of respondents think that
UKCBC is providing services up to satisfaction level (Barlett, 2016). On question of services of
mentioned educational institute that is mostly preferred by the people standard deviation is
negligible 0.58 which indicate that values less deviate from mean value. It can be said that
respondents respond in same direction.
10 | P a g e
Paraphrase This Document
Need a fresh take? Get an instant paraphrase of this document with our AI Paraphraser
2.4 Quartile, percentile and correlation coefficient
Rank Q3 Q4
1 10 1 1
2 20 2 1
3 10 2 2
4 11 2 2
5 25 1 1
6 60 1 1
7 65 1 1
8 69 3 2
9 70 3 3
10 59 4 1
11 55 1 1
12 50 1 1
13 80 2 2
14 85 1 1
15 89 1 1
16 90 1 1
17 84 5 1
18 83 1 1
19 73 1 1
20 68 5 2
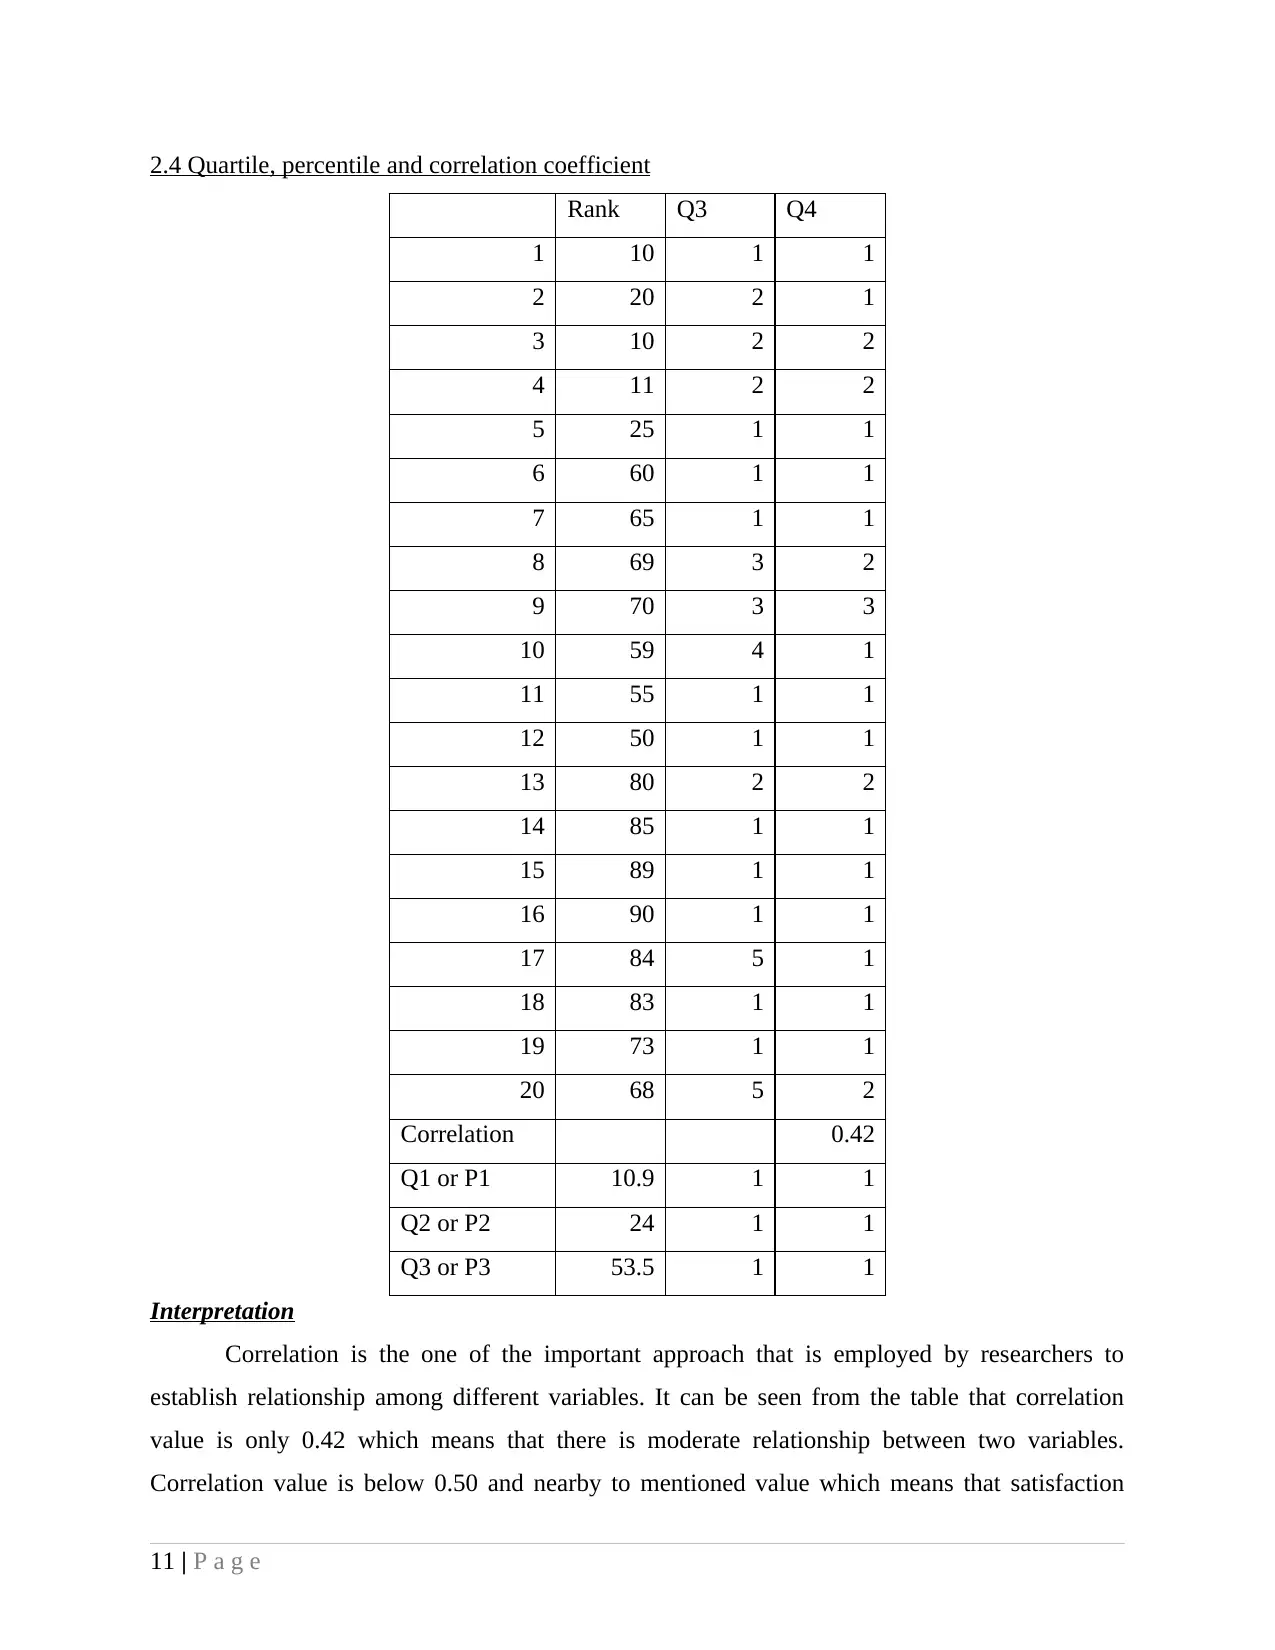
Correlation 0.42
Q1 or P1 10.9 1 1
Q2 or P2 24 1 1
Q3 or P3 53.5 1 1
Interpretation
Correlation is the one of the important approach that is employed by researchers to
establish relationship among different variables. It can be seen from the table that correlation
value is only 0.42 which means that there is moderate relationship between two variables.
Correlation value is below 0.50 and nearby to mentioned value which means that satisfaction
11 | P a g e
Rank Q3 Q4
1 10 1 1
2 20 2 1
3 10 2 2
4 11 2 2
5 25 1 1
6 60 1 1
7 65 1 1
8 69 3 2
9 70 3 3
10 59 4 1
11 55 1 1
12 50 1 1
13 80 2 2
14 85 1 1
15 89 1 1
16 90 1 1
17 84 5 1
18 83 1 1
19 73 1 1
20 68 5 2
Correlation 0.42
Q1 or P1 10.9 1 1
Q2 or P2 24 1 1
Q3 or P3 53.5 1 1
Interpretation
Correlation is the one of the important approach that is employed by researchers to
establish relationship among different variables. It can be seen from the table that correlation
value is only 0.42 which means that there is moderate relationship between two variables.
Correlation value is below 0.50 and nearby to mentioned value which means that satisfaction
11 | P a g e
level of students from college and use of technology to teach them new things by use of software
are not interrelated to each other (He and et.al., 2017). It can be said that use of advance
technology by college moderately have correlation with the satisfaction level of students from
college.
There is relevance of correlation to decision making because it helps one in identifying
relationship between different variables. Thus, one can easily identify changes that comes in one
variable with change in other variable. On the basis of value of correlation one can determine
that if changes comes in one variable then in what likely deviation can be observed in other
variable. Thus, identification of this strength of relationship help managers to great extent in
making business decisions.
Quartile is the approach that is used to explore data sets more deeply than any other
statistical tool. It can be observed that quartile divide set of values in two fold segments then
median. Thus, in depth trends can be identified and analysed by using discussed statistical tool.
Quartile and percentile both are same things (Black, 2016). Only difference between both is that
quartile use values whereas percentile use percentage. There is relevance of quartile and
percentile to decision making. This is because in real analytics world work is done on large
dataset and they contain rows about 4000 and columns about 80 on average basis. It is very
difficult to identify trends that are hidden in the dataset. Quartile is the tool that solve this
problem by breaking group of values in multiple parts. It can be said that there is huge
significance of the mentioned tool for data scientists.
Quartile is greatly used in decision making. Data scientists before using any data identify
outliers that are in it. These outliers are identified by using box and whisker plot and quartile
help mangers in finding same. Identified outliers are removed from data set and this is known as
data cleansing work. After data cleaning same is used to analyse data and to make business
decisions. It can be said that quartile help a lot to managers to make relevant business decisions.
TASK 3
3.1 Graphical representation of data
12 | P a g e
⊘ This is a preview!⊘
Do you want full access?
Subscribe today to unlock all pages.
Trusted by 1+ million students worldwide
1 out of 22
Related Documents


Your All-in-One AI-Powered Toolkit for Academic Success.
+13062052269
info@desklib.com
Available 24*7 on WhatsApp / Email
![[object Object]](/_next/static/media/star-bottom.7253800d.svg)
Unlock your academic potential
Copyright © 2020–2026 A2Z Services. All Rights Reserved. Developed and managed by ZUCOL.