Capital Budgeting: Evaluating New Project at Booli Ltd with Analysis
VerifiedAdded on 2023/06/11
|19
|3251
|364
Report
AI Summary
This report presents a comprehensive capital budgeting analysis for Booli Ltd's new project, evaluating its financial viability through various tools and techniques. The analysis includes calculations of the non-discounted pay-back period, profitability index, internal rate of return (IRR), and net present value (NPV). Sensitivity analysis is performed to assess the impact of changes in sales price and sales quantity on the project's outcome. The report also considers the potential loss of sales from existing models due to the introduction of the new product, treating it as an opportunity cost. Based on the quantitative data, the project is expected to generate profits, with a positive NPV of $40.2 million over five years, a low pay-back period of 2.02 years, and a high IRR of 37%. The report concludes with a recommendation to accept the project, contingent upon consideration of qualitative factors alongside the financial analysis. Desklib provides access to similar solved assignments for students.

Business Finance
1
1
Paraphrase This Document
Need a fresh take? Get an instant paraphrase of this document with our AI Paraphraser
Contents
INTRODUCTION.................................................................................................................................3
FINANCIAL VIABILITY OF THE PROJECT....................................................................................4
Non-Discounted Pay-Back Period.....................................................................................................4
Profitability Index..............................................................................................................................4
Internal Rate of Return......................................................................................................................4
Net Present Value..............................................................................................................................4
SENSITIVITY ANALYSIS..................................................................................................................6
Change in sales price.........................................................................................................................6
Change in sales quantity....................................................................................................................6
EFFECT OF LOSS OF SALE OF OTHER MODELS DUE TO NEW PROJECT...............................8
CONCLUSION AND RECOMMENDATION.....................................................................................9
Bibliography........................................................................................................................................10
Appendix.............................................................................................................................................11
2
INTRODUCTION
Whenever we are provided we a new investment opportunity, we try to makes sure that this
opportunity will turn out to be profitable with us. (Adelaja, 2015) There are various analysis
and studied conducted in order to evaluate the output of the said opportunity. Similarly, when
a company is to engage in the production of a new product, then such situation is similar to
new investment opportunity.
We are provided with data of Booli Ltd. the company is evaluating the production of a new
product. We have conducted a thorough capital budgeting analysis of the said proposal in
order to determine if this will be a profitable opportunity for the company or not. Details of
such analysis have been mentioned below.
3
⊘ This is a preview!⊘
Do you want full access?
Subscribe today to unlock all pages.
Trusted by 1+ million students worldwide
FINANCIAL VIABILITY OF THE PROJECT
Given below are few of tools which will help us evaluate the financial profitability of the new
proposal of Booli Ltd.
Non-Discounted Pay-Back Period
Pay- back period is the tool of capital budgeting that helps the investor calculates the
recovery time of the initially invested amount in the project. Lower the pay- back period,
better the project is considered. The pay- back period this is calculated using discounted cash
flows is the discounted pay- back period, and the one which is calculated using normal cash
flows is called non- discounted cash flows. (Atkinson, 2012)
The pay- back period of the new proposal of the company is 2.02 years. The project life is for
5 years. This means that the company will have almost 3 years in order to generate profits.
Profitability Index
Profitability index is the capital budgeting tool or ratio that helps calculate the return per unit
of investment. This is calculated by dividing the present value of cash inflows by the cash
outflows. Higher the ratio better it is. (Berry, 2009)
The profitability index for the company is 1.71 times. The investor is expected to earn $1.71
for $1 invested in the new proposal. This gives the investor a margin of $0.71 on every dollar
invested.
Internal Rate of Return
The internal rate of return is that tool of capital budgeting which helps the investor calculate
the actual return from the cash inflows of the new proposal. This is calculated by equating the
cash inflows and cash outflows. The hidden rate which equates them is the internal rate of
return. The project is generally accepted when the internal rate of return is higher than the
discount rate. (Bierman & Smidt, 2010)
The internal rate of return for the proposal of the company is 37%. This is higher than the
discount rate of 12%. This indicates high profitability from the new proposal.
Net Present Value
Net present value is the tool that helps calculate the present value of net cash inflows of the
said investment strategy. It is the most commonly use feature of capital budgeting analysis. If
4
Paraphrase This Document
Need a fresh take? Get an instant paraphrase of this document with our AI Paraphraser

the Net present value is positive the project is considered, if it is negative then it is not to be
accepted. (Dayananda, Irons, Harrison, Herbohn, & Rowland, 2008)
The net present value of the new proposal amounts to $ 40.2 million. This project is expected
to create positive net present values, and hence seems viable.
5
accepted. (Dayananda, Irons, Harrison, Herbohn, & Rowland, 2008)
The net present value of the new proposal amounts to $ 40.2 million. This project is expected
to create positive net present values, and hence seems viable.
5
SENSITIVITY ANALYSIS
Sensitivity analysis is a part of capital budgeting analysis that helps the investor calculates the
effect of deviations in the input variables on the result of the project. (Kuti, 2014) Due to
uncertainties involved the output from the project may change, sensitivity analysis helps
analyse these variances.
Change in sales price
We have calculated the effect of change in price of the product on the result of the new
project. Increasing the sale price of the new product by 1% will increase the cash inflows,
which will in turn increase the net present value. The one percent increase in the sale price
resulted in 4.35% increase in net present value. The net present value increased to $ 41.9
million from 40.2 million. We have also, calculated the effect of this increase on pay-back
period, profitability index and internal rate of return:
- IRR increases form 37% to 38% with one percent increase in sales price
- Profitability index increases from 1.71 times to 1.74 time with one percent increase in
sales price
- Pay- back period decreases from 2.02 years to 1.99 years with one percent increase in
sales price
Therefore we see that the net present value of the project is most sensitive to change in sale
price of the product.
Change in sales quantity
We have calculated the effect of change in quantity of the product on the result of the new
project. Increasing the sale quantity of the new product by 1% will increase the cash inflows,
which will in turn increase the net present value. The one percent increase in the sale quantity
resulted in 2.23% increase in net present value. The net present value increased to $ 41.1
million from $40.2 million. We have also, calculated the effect of this increase on pay-back
period, profitability index and internal rate of return:
- IRR increases form 37% to 37.48% with one percent increase in sales quantity
- Profitability index increases from 1.71 times to 1.73 time with one percent increase in
sales quantity
6
⊘ This is a preview!⊘
Do you want full access?
Subscribe today to unlock all pages.
Trusted by 1+ million students worldwide
- Pay- back period decreases from 2.02 years to 2 years with one percent increase in sales
quantity
Therefore we see that the net present value of the project is most sensitive to change in sale
quantity of the product.
Capital budgeting analysis is a detailed investigation into the cash flows of the project. These
cash flows are calculated based on market survey and studies. Any change in the market
conditions will have impact on the result of the project. (Lerner, 2009) The result of the
project is very sensitive to any change in the assumptions. This creates risk of uncertainty in
the project. The discount rate that is used in the evaluation of the project should also be
chosen based on lot of study. This is a very relevant factor. Any wrong assumption or lack of
use of any small information may have a huge impact on this discount rate. The discount rate
should be calculated based on all of the qualitative and quantitative data. The capital
budgeting analysis will always have a risk that pertains to uncertainty and also of wrong rate
being used in evaluation of the project. It is important the investor takes into consideration
the impact of all this risk that might affect the result of the project. (Menifield, 2014)
7
Paraphrase This Document
Need a fresh take? Get an instant paraphrase of this document with our AI Paraphraser
EFFECT OF LOSS OF SALE OF OTHER MODELS DUE TO NEW PROJECT
The cost in decision making may be classified into many categories. The major two
categories in which these costs can be classified are relevant cost and irrelevant cost.
(Noreen, 2015) Relevant cost are those cost which are to be included while evaluating the
decision of investment proposal acceptance. Irrelevant costs are those cost which do not
affect the decision making of an enterprise (Peterson & Fabozzi, 2012). Opportunity costs are
kind of relevant cost. Opportunity cost is the cost which the company incurs due to
acceptance of the new project.
In the given case the company is proposing to sell a new electronic item which will be
technologically advanced. Introduction of this product may lead to loss of sales of the other
products of the company. (Rivenbark, Vogt, & Marlowe, 2009)Loss of revenue for existing
products due to new project is a kind of opportunity cost and is relevant in decision making
process. Therefore, the loss of revenue due to acceptance of new project is to be considered
as cost and is to be included while evaluating the financial viability of this new proposal.
8

CONCLUSION AND RECOMMENDATION
Taking all the data and information provided above we can see that the project is expected to
generate profits for the company. The introduction of new project is likely to create profits up
to $40.2 million in the period of 5 years. The project has a low pay- back period of 2.02 years
and a high internal rate of return of up to 37%. The financial output of the project is very
good. This is the quantitative analysis. All other qualitative data should also be taken into
account before the final decision is taken. (Seal, 2012)
Based on the current information the project and the evaluation of financial data, we
recommend that the production of new product should be accepted.
9
⊘ This is a preview!⊘
Do you want full access?
Subscribe today to unlock all pages.
Trusted by 1+ million students worldwide

Bibliography
Adelaja, T. (2015). Capital Budgeting: Investment Appraisal Techniques Under Certainty.
Chicago: CreateSpace Independent Publishing Platform .
Atkinson, A. A. (2012). Management accounting. Upper Saddle River, N.J.: Paerson.
Berry, L. E. (2009). Management accounting demystified. New York: McGraw-Hill.
Bierman, H., & Smidt, S. (2010). The Capital Budgeting Decision. Boston: Routledge.
Dayananda, D., Irons, R., Harrison, S., Herbohn, J., & Rowland, P. (2008). Capital
Budgeting: Financial Appraisal of Investment Projects. Cambridge: Cambridge University
Press.
Kuti, M. (2014). Crowdfunding: How to Fund Your Business Idea. Retrieved from
www.business.gov.au:
https://www.business.gov.au/info/run/finance-and-accounting/finance/crowdfunding-how-to-
fund-your-business-idea
Lerner, J. J. (2009). Schaum's outline of principles of accounting. New York: Schaum.
Menifield, C. E. (2014). The Basics of Public Budgeting and Financial Management: A
Handbook for Academics and Practitioners. Lanham, Md.: University Press of America.
Noreen, E. (2015). The theory of constraints and its implications for management accounting.
Great Barrington, MA: North River Press.
Peterson, P. P., & Fabozzi, F. J. (2012). Capital Budgeting. New York, NY: Wiley.
Rivenbark, W. C., Vogt, J., & Marlowe, J. (2009). Capital Budgeting and Finance: A Guide
for Local Governments. Washington, D.C.: ICMA Press.
Seal, W. (2012). Management accounting. Maidenhead: McGraw-Hill Higher Education.
10
Paraphrase This Document
Need a fresh take? Get an instant paraphrase of this document with our AI Paraphraser
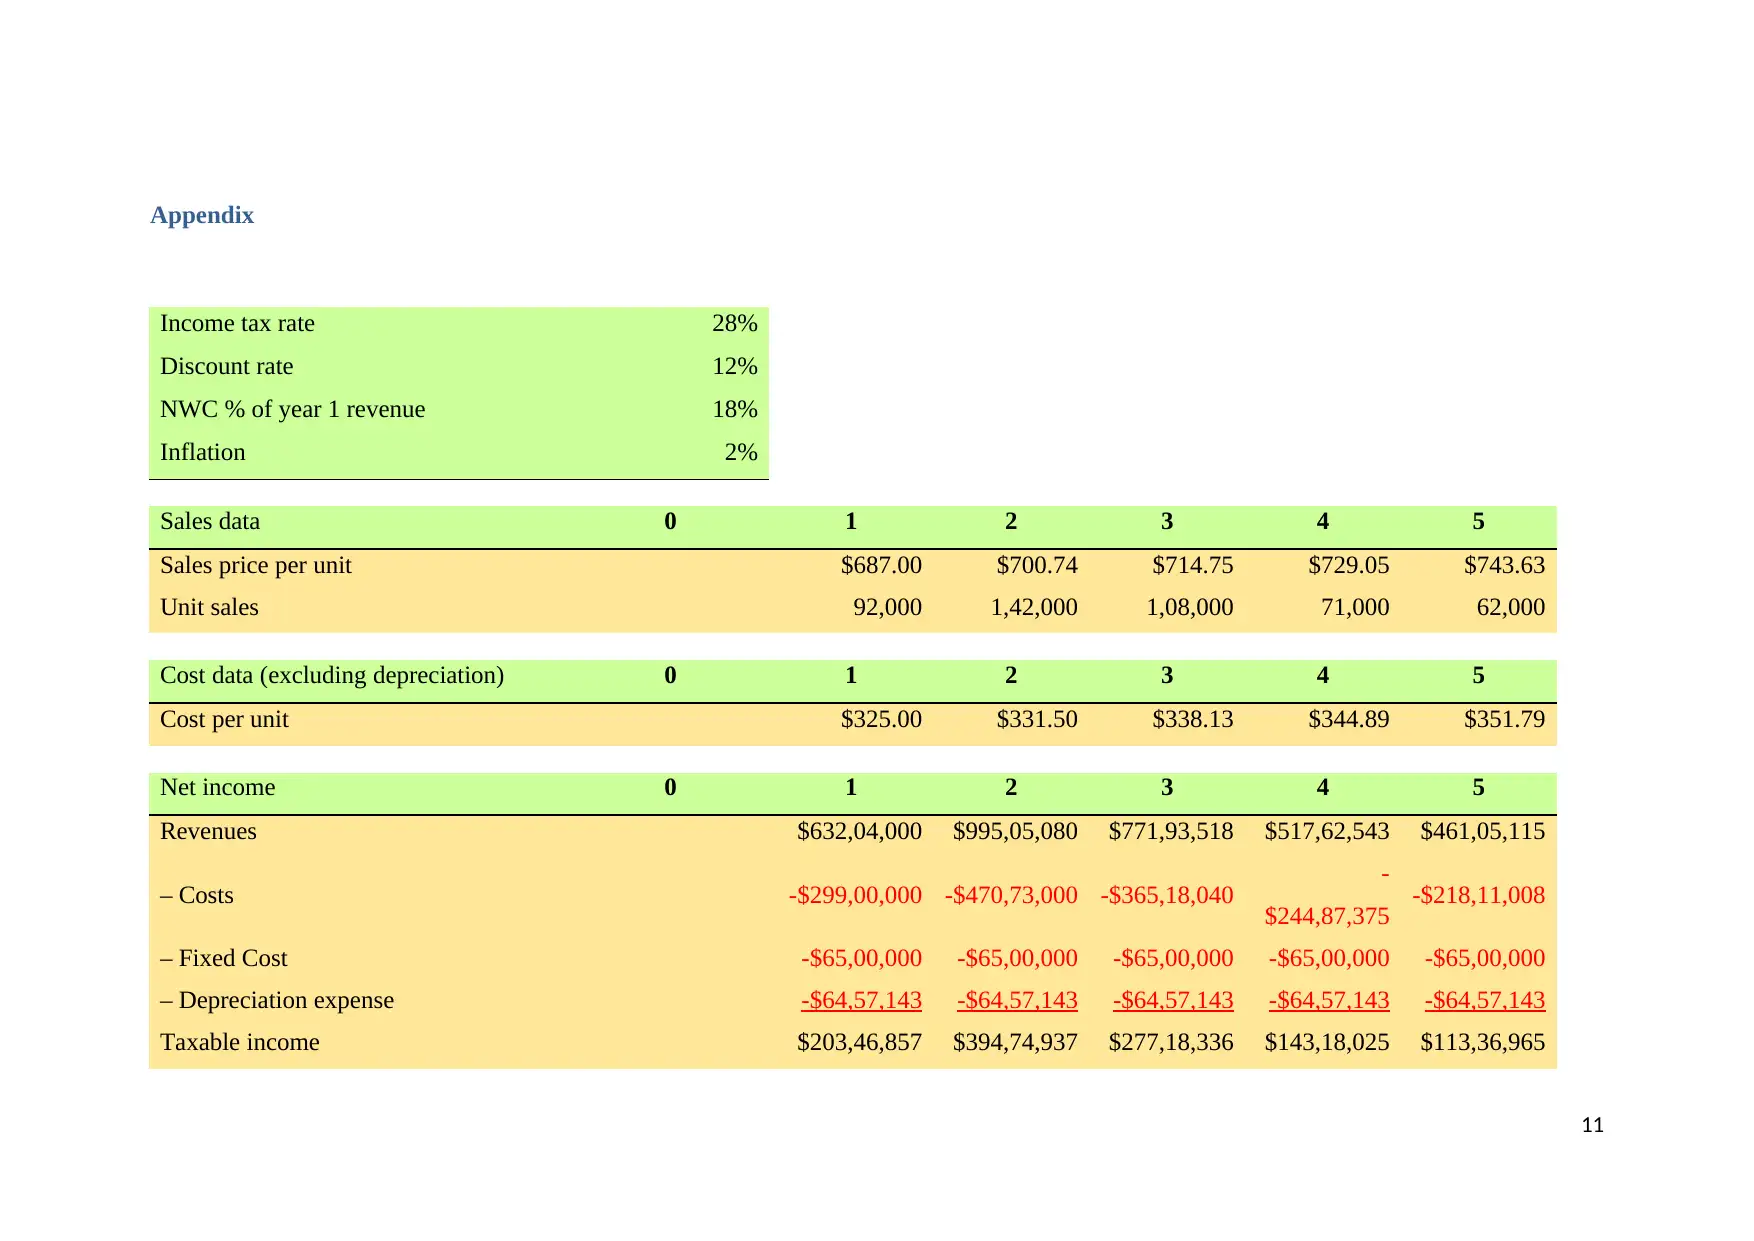
Appendix
Income tax rate 28%
Discount rate 12%
NWC % of year 1 revenue 18%
Inflation 2%
Sales data 0 1 2 3 4 5
Sales price per unit $687.00 $700.74 $714.75 $729.05 $743.63
Unit sales 92,000 1,42,000 1,08,000 71,000 62,000
Cost data (excluding depreciation) 0 1 2 3 4 5
Cost per unit $325.00 $331.50 $338.13 $344.89 $351.79
Net income 0 1 2 3 4 5
Revenues $632,04,000 $995,05,080 $771,93,518 $517,62,543 $461,05,115
– Costs -$299,00,000 -$470,73,000 -$365,18,040 -
$244,87,375 -$218,11,008
– Fixed Cost -$65,00,000 -$65,00,000 -$65,00,000 -$65,00,000 -$65,00,000
– Depreciation expense -$64,57,143 -$64,57,143 -$64,57,143 -$64,57,143 -$64,57,143
Taxable income $203,46,857 $394,74,937 $277,18,336 $143,18,025 $113,36,965
11
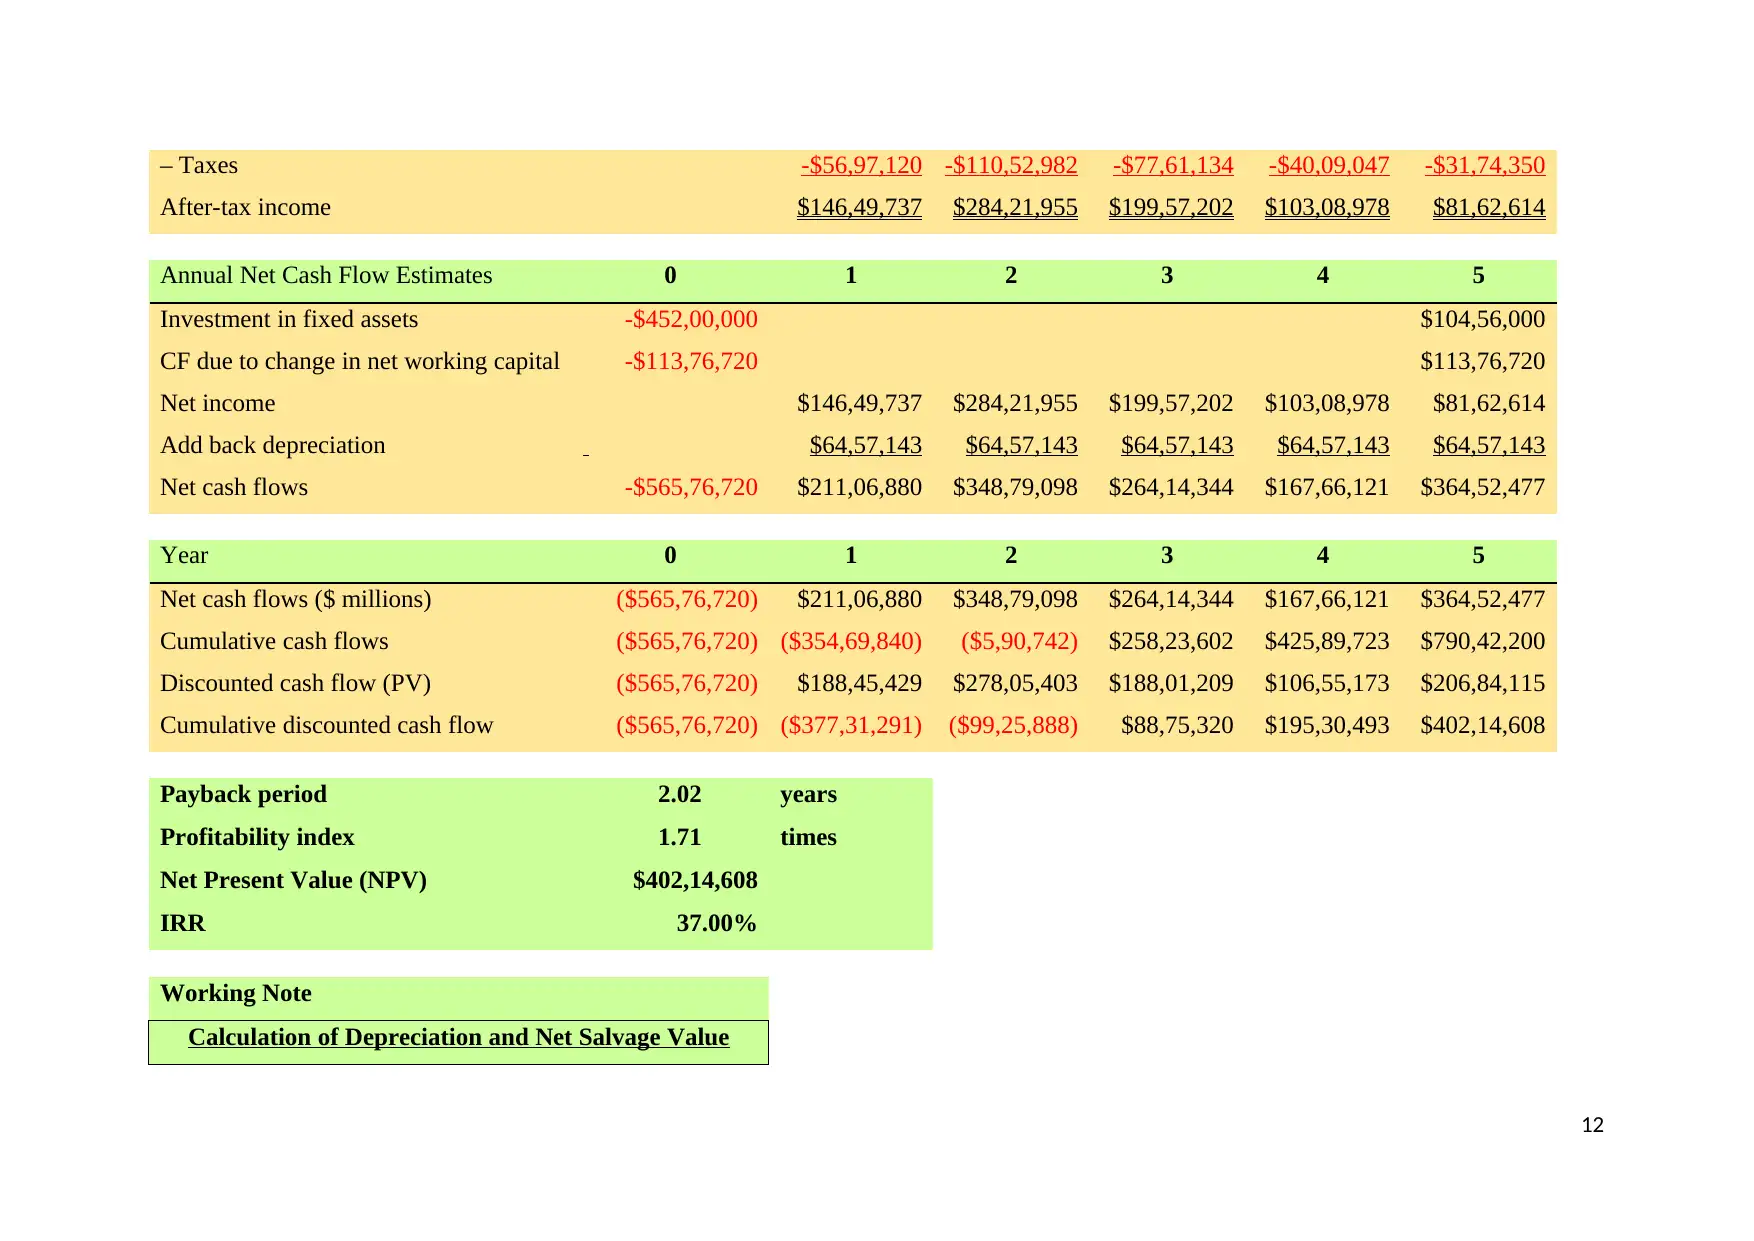
– Taxes -$56,97,120 -$110,52,982 -$77,61,134 -$40,09,047 -$31,74,350
After-tax income $146,49,737 $284,21,955 $199,57,202 $103,08,978 $81,62,614
Annual Net Cash Flow Estimates 0 1 2 3 4 5
Investment in fixed assets -$452,00,000 $104,56,000
CF due to change in net working capital -$113,76,720 $113,76,720
Net income $146,49,737 $284,21,955 $199,57,202 $103,08,978 $81,62,614
Add back depreciation $64,57,143 $64,57,143 $64,57,143 $64,57,143 $64,57,143
Net cash flows -$565,76,720 $211,06,880 $348,79,098 $264,14,344 $167,66,121 $364,52,477
Year 0 1 2 3 4 5
Net cash flows ($ millions) ($565,76,720) $211,06,880 $348,79,098 $264,14,344 $167,66,121 $364,52,477
Cumulative cash flows ($565,76,720) ($354,69,840) ($5,90,742) $258,23,602 $425,89,723 $790,42,200
Discounted cash flow (PV) ($565,76,720) $188,45,429 $278,05,403 $188,01,209 $106,55,173 $206,84,115
Cumulative discounted cash flow ($565,76,720) ($377,31,291) ($99,25,888) $88,75,320 $195,30,493 $402,14,608
Payback period 2.02 years
Profitability index 1.71 times
Net Present Value (NPV) $402,14,608
IRR 37.00%
Working Note
Calculation of Depreciation and Net Salvage Value
12
⊘ This is a preview!⊘
Do you want full access?
Subscribe today to unlock all pages.
Trusted by 1+ million students worldwide
1 out of 19
Related Documents


Your All-in-One AI-Powered Toolkit for Academic Success.
+13062052269
info@desklib.com
Available 24*7 on WhatsApp / Email
![[object Object]](/_next/static/media/star-bottom.7253800d.svg)
Unlock your academic potential
Copyright © 2020–2026 A2Z Services. All Rights Reserved. Developed and managed by ZUCOL.