MGT723 Research Project Semester 2 2017: Carbon Emission Disclosure
VerifiedAdded on 2020/04/07
|8
|1755
|90
Project
AI Summary
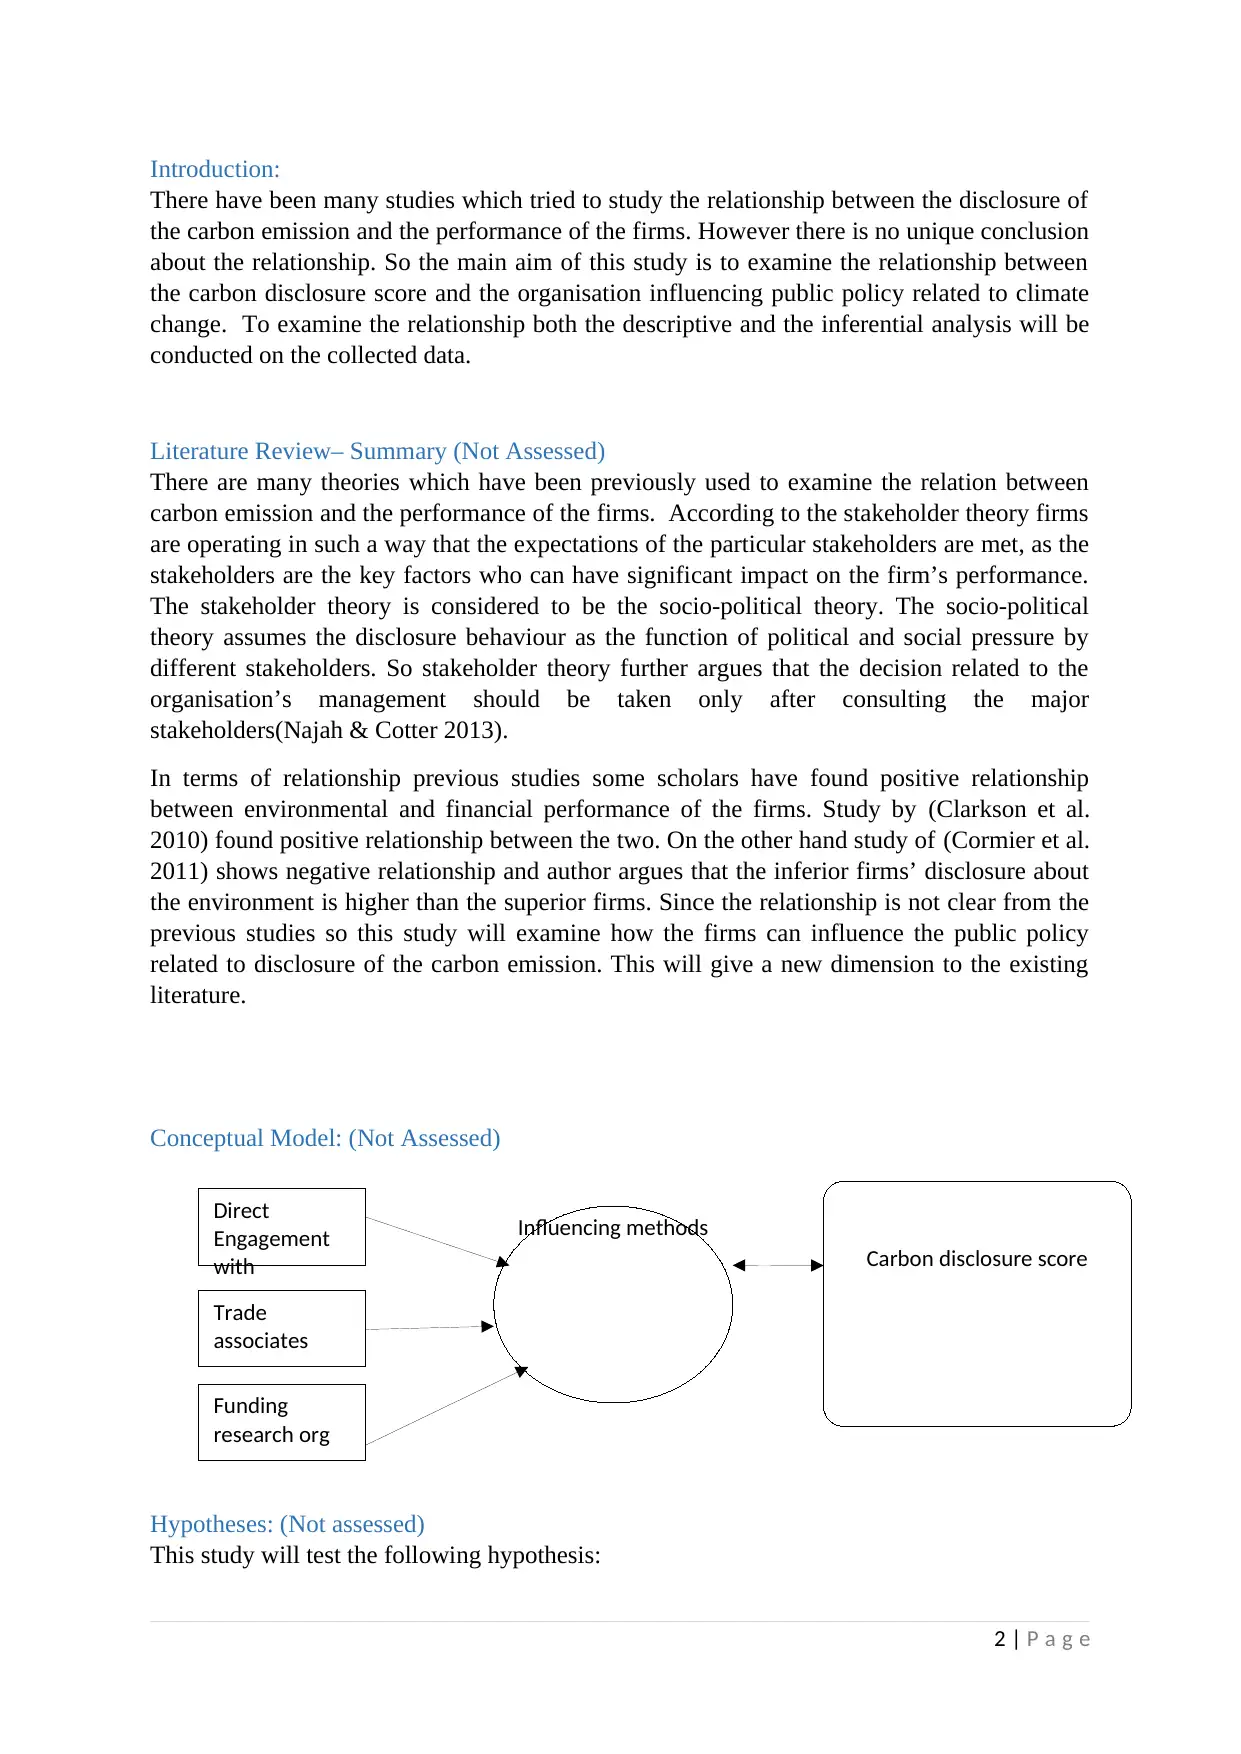
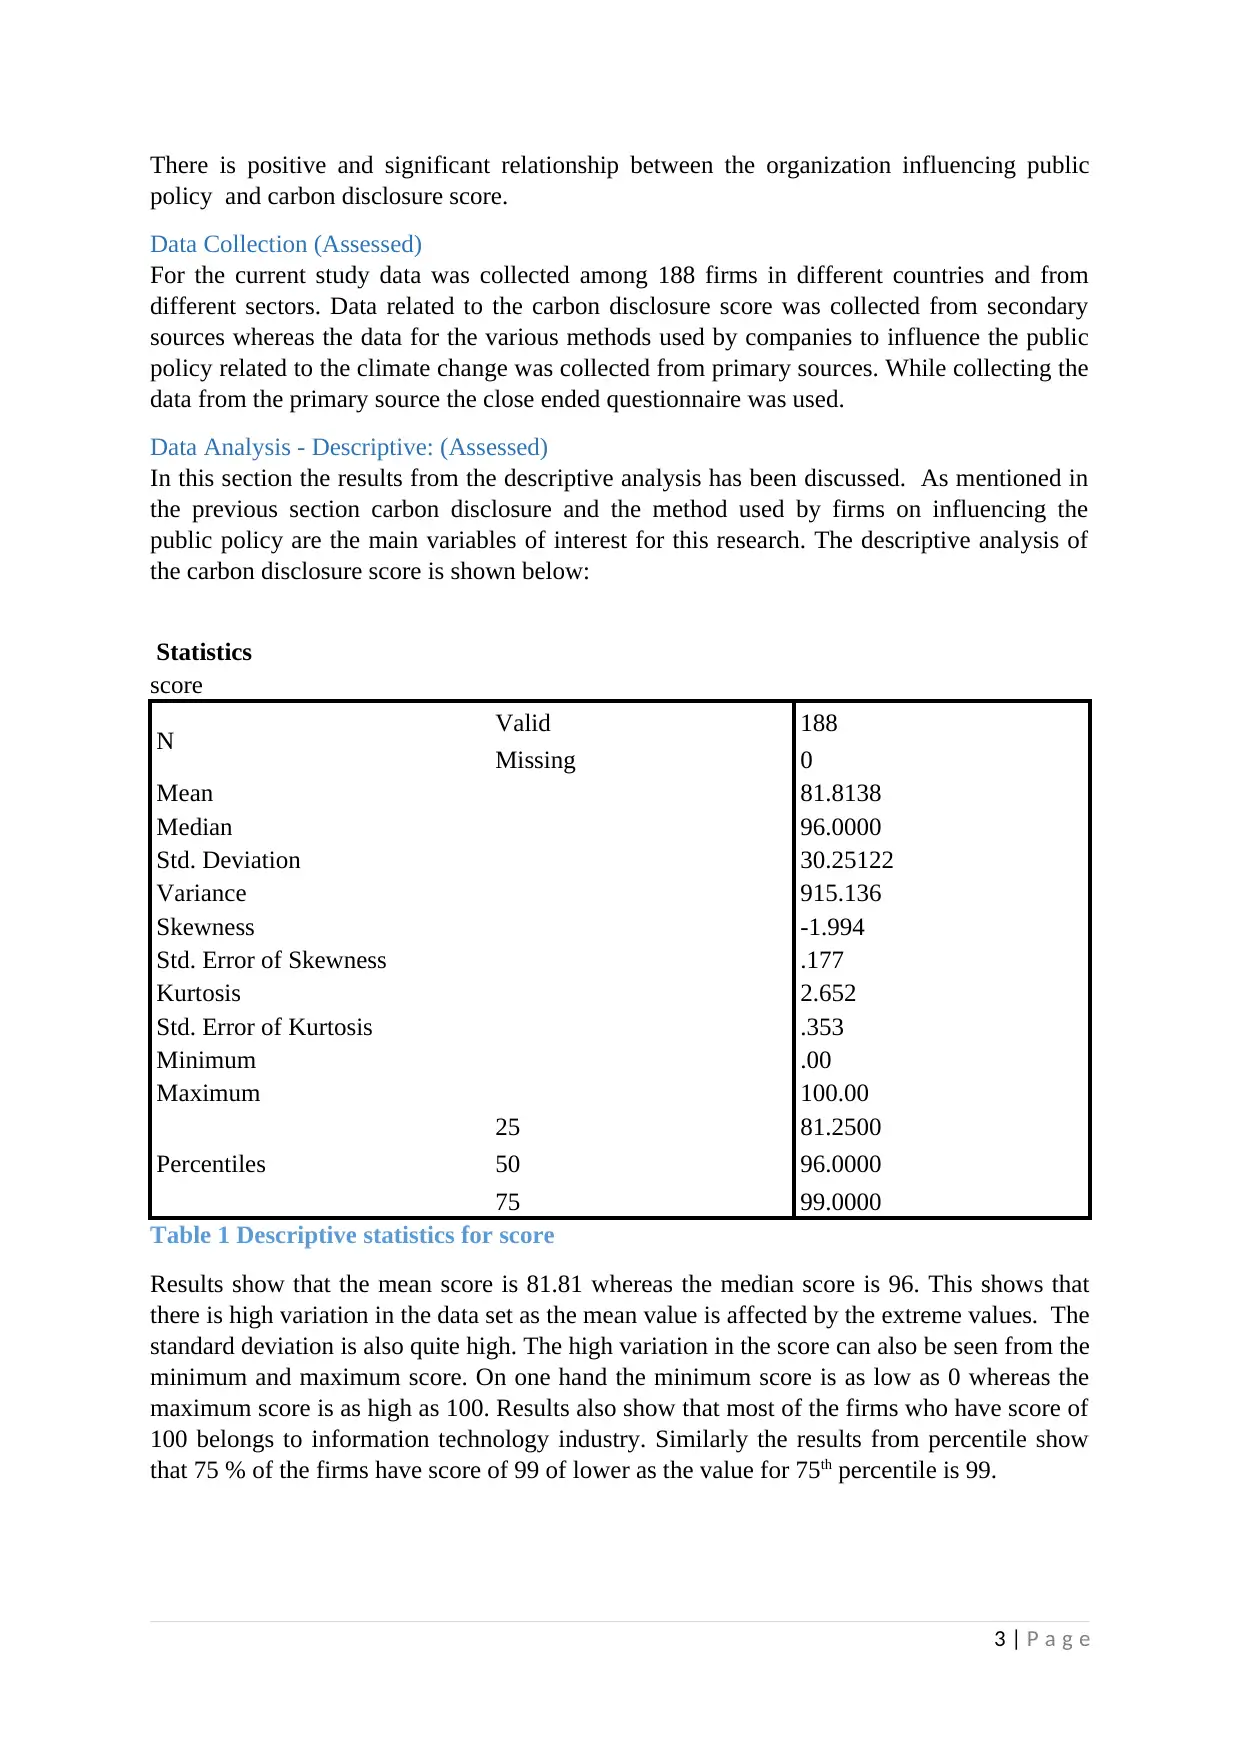
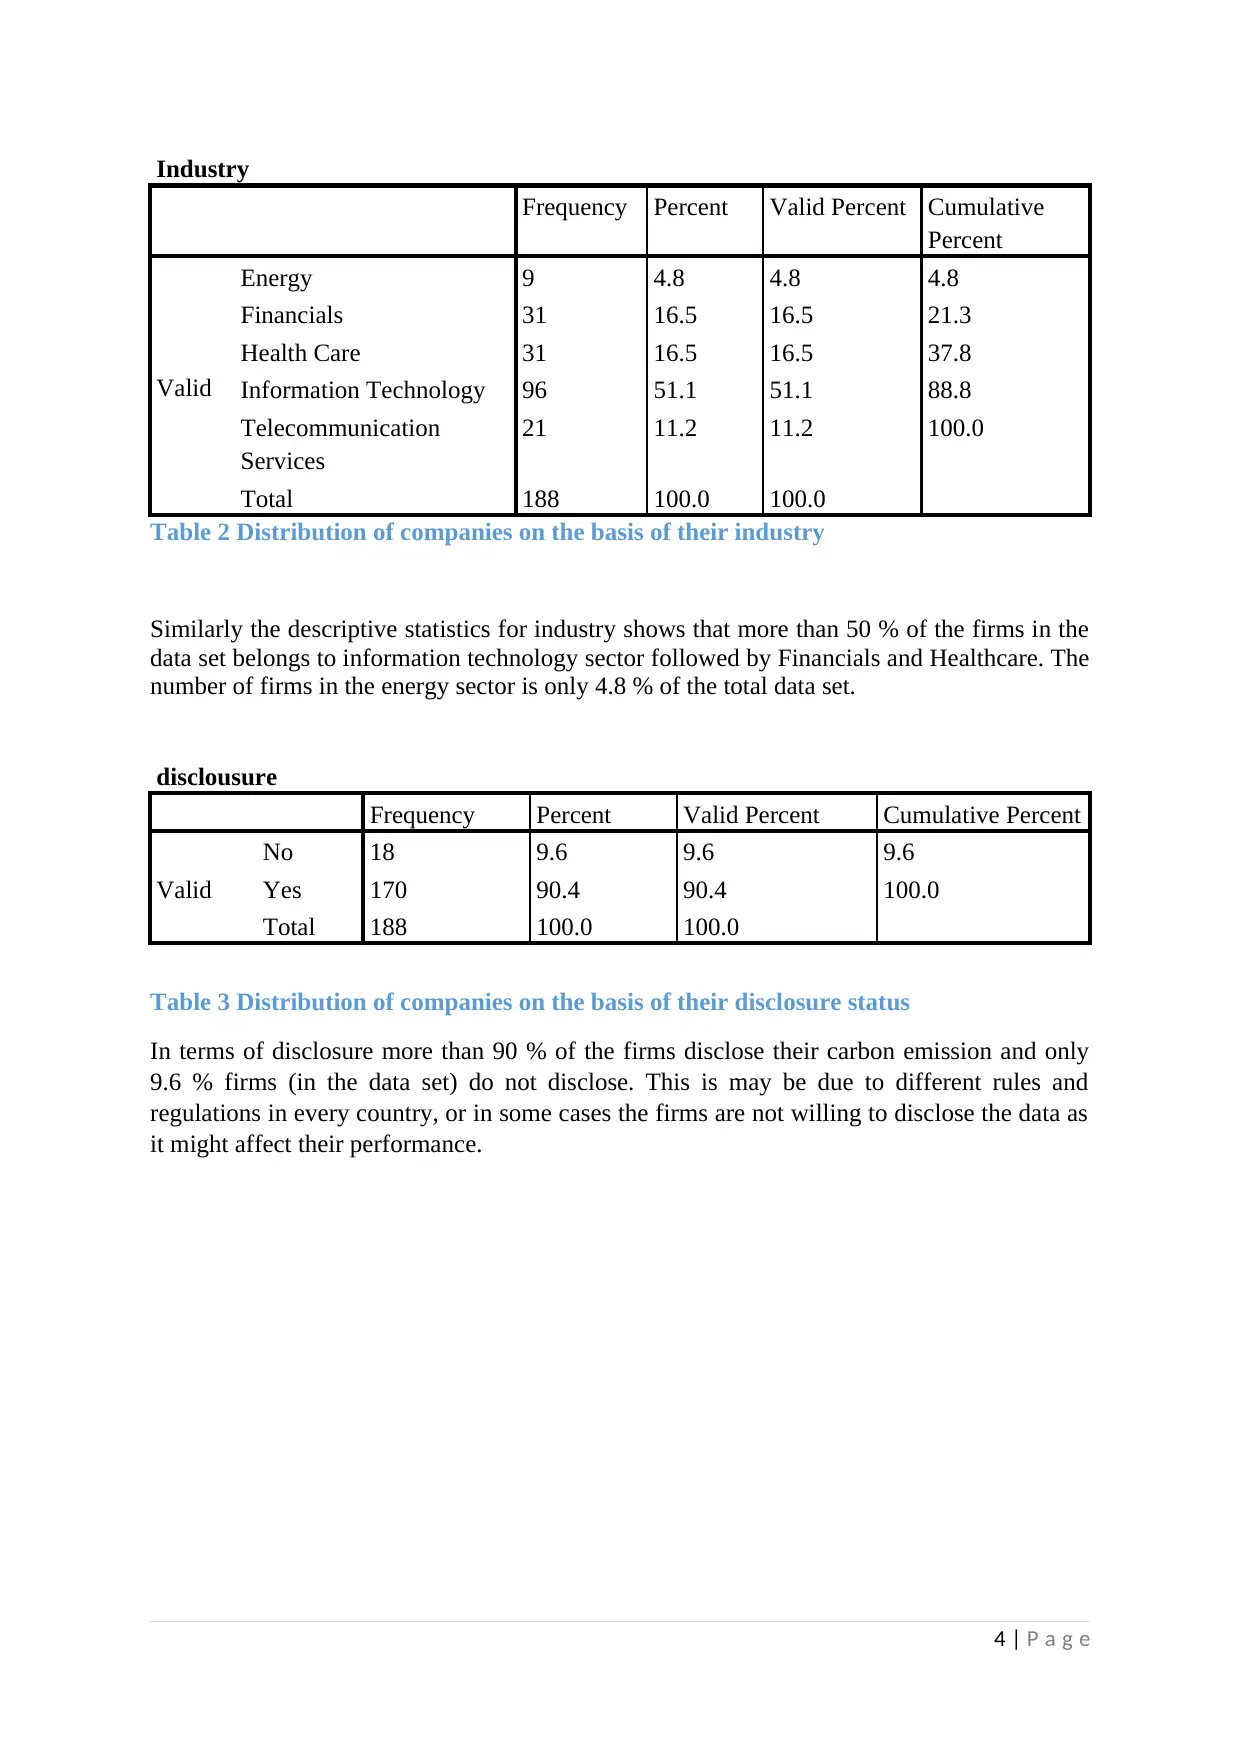
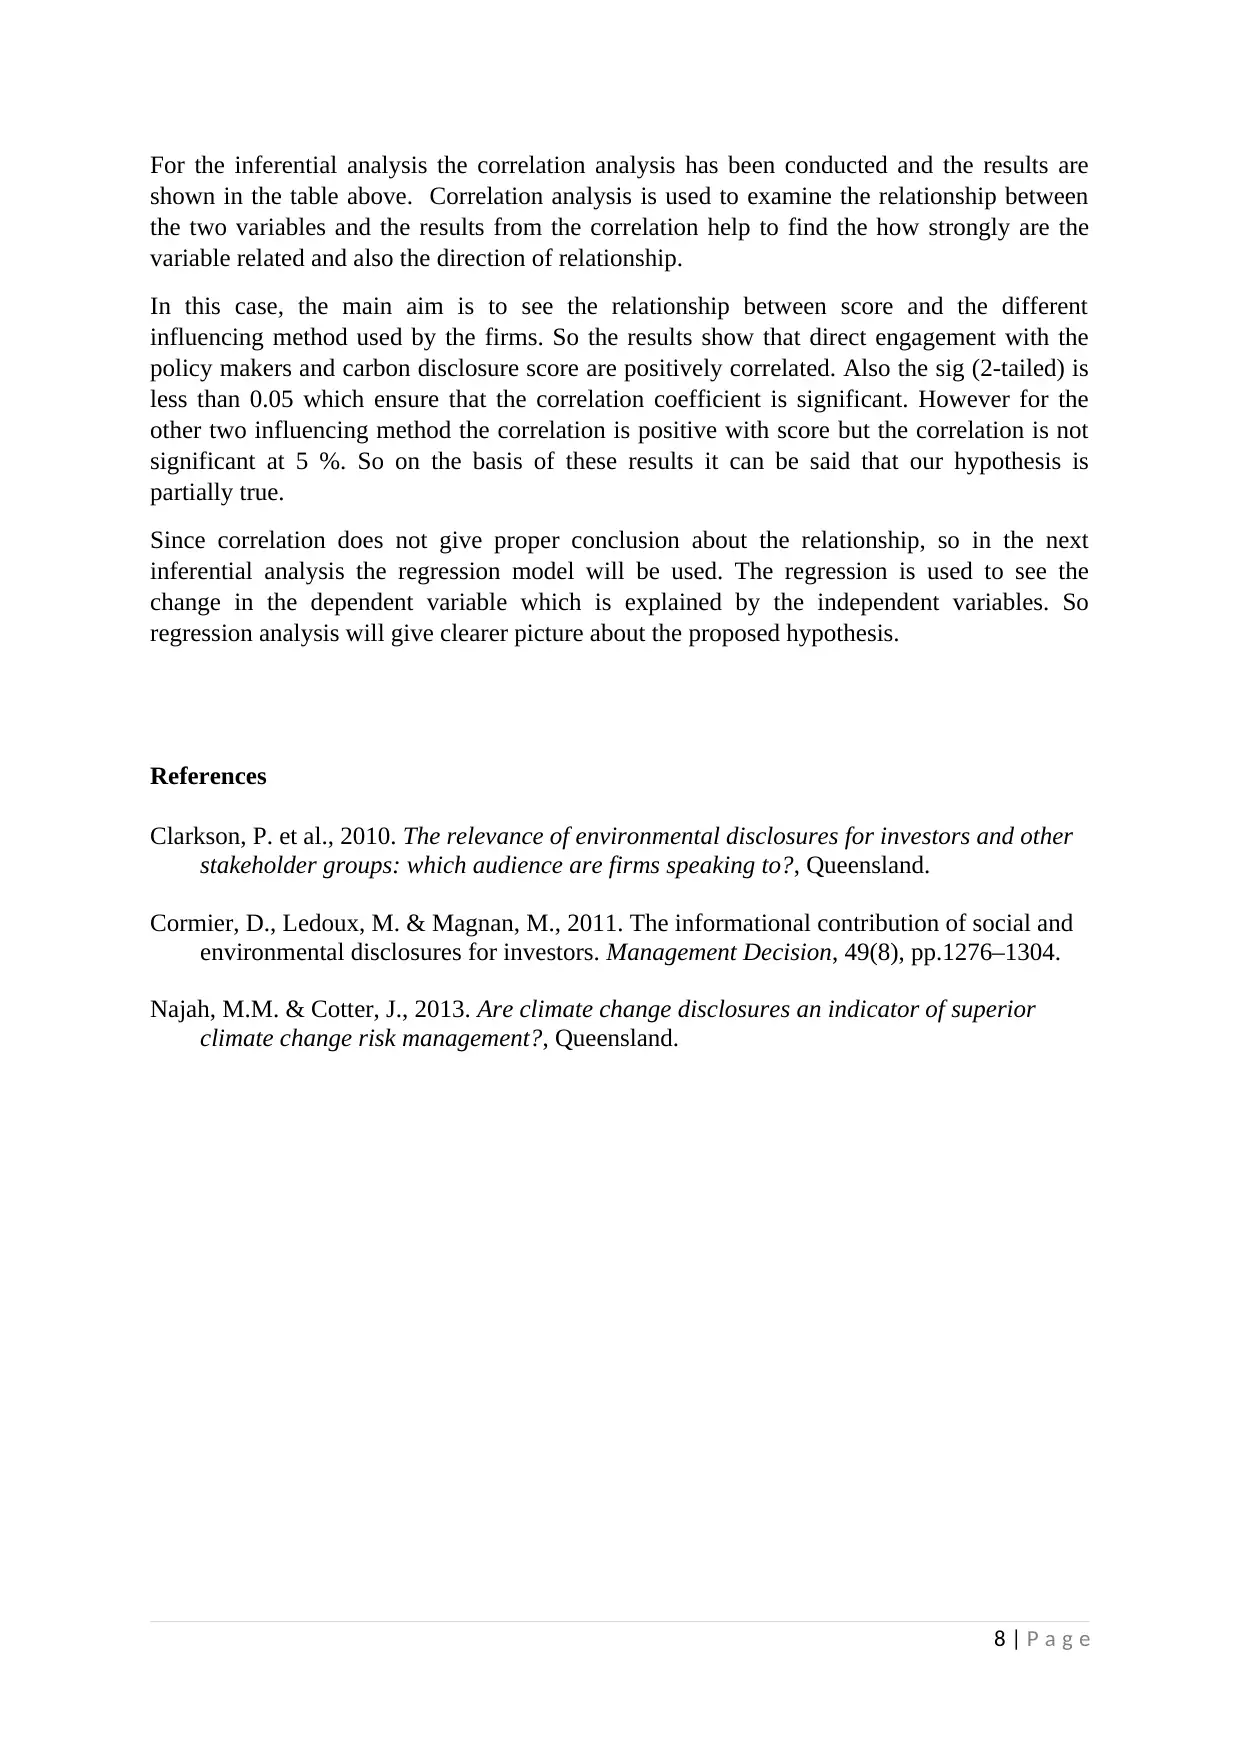
This research project, for MGT723, investigates the relationship between carbon disclosure scores and how organizations influence public policy related to climate change. The study analyzes data from 188 firms across different countries and sectors, collected through secondary sources for carbon disclosure scores and primary sources via questionnaires for influencing methods. The research employs descriptive statistics to analyze the carbon disclosure score, revealing a high variation in the data, and examines the distribution of companies across industries and their disclosure status. Inferential analysis, using correlation analysis, explores the relationships between carbon disclosure and various influencing methods, such as direct engagement with policy makers, trade associations, and funding research organizations. The findings indicate a positive correlation between direct engagement and carbon disclosure scores, providing insights into the complex dynamics between environmental performance and public policy influence.

MGT723 Research Project
Semester 2 2017
Assessment Task 2: Data Collection
Student Name:
Your assigned research question*:
Title:
Submission Date:
Acknowledgement:
I certify that I have carefully reviewed the university’s academic misconduct policy. I
understand that the source of ideas must be referenced and that quotation marks and a
reference are required when directly quoting anyone else’s words.
Unless otherwise approved by the course coordinator, all students will be considering the
general issue of the Voluntary Disclosure of Environmental Performance. In Week 1 Students
will be assigned to a specific research problem.
Paraphrase This Document
Need a fresh take? Get an instant paraphrase of this document with our AI Paraphraser

Direct
Engagement
with
Trade
associates
Funding
research org
Influencing methods
Carbon disclosure score
Introduction:
There have been many studies which tried to study the relationship between the disclosure of
the carbon emission and the performance of the firms. However there is no unique conclusion
about the relationship. So the main aim of this study is to examine the relationship between
the carbon disclosure score and the organisation influencing public policy related to climate
change. To examine the relationship both the descriptive and the inferential analysis will be
conducted on the collected data.
Literature Review– Summary (Not Assessed)
There are many theories which have been previously used to examine the relation between
carbon emission and the performance of the firms. According to the stakeholder theory firms
are operating in such a way that the expectations of the particular stakeholders are met, as the
stakeholders are the key factors who can have significant impact on the firm’s performance.
The stakeholder theory is considered to be the socio-political theory. The socio-political
theory assumes the disclosure behaviour as the function of political and social pressure by
different stakeholders. So stakeholder theory further argues that the decision related to the
organisation’s management should be taken only after consulting the major
stakeholders(Najah & Cotter 2013).
In terms of relationship previous studies some scholars have found positive relationship
between environmental and financial performance of the firms. Study by (Clarkson et al.
2010) found positive relationship between the two. On the other hand study of (Cormier et al.
2011) shows negative relationship and author argues that the inferior firms’ disclosure about
the environment is higher than the superior firms. Since the relationship is not clear from the
previous studies so this study will examine how the firms can influence the public policy
related to disclosure of the carbon emission. This will give a new dimension to the existing
literature.
Conceptual Model: (Not Assessed)
Hypotheses: (Not assessed)
This study will test the following hypothesis:
2 | P a g e

There is positive and significant relationship between the organization influencing public
policy and carbon disclosure score.
Data Collection (Assessed)
For the current study data was collected among 188 firms in different countries and from
different sectors. Data related to the carbon disclosure score was collected from secondary
sources whereas the data for the various methods used by companies to influence the public
policy related to the climate change was collected from primary sources. While collecting the
data from the primary source the close ended questionnaire was used.
Data Analysis - Descriptive: (Assessed)
In this section the results from the descriptive analysis has been discussed. As mentioned in
the previous section carbon disclosure and the method used by firms on influencing the
public policy are the main variables of interest for this research. The descriptive analysis of
the carbon disclosure score is shown below:
Statistics
score
N Valid 188
Missing 0
Mean 81.8138
Median 96.0000
Std. Deviation 30.25122
Variance 915.136
Skewness -1.994
Std. Error of Skewness .177
Kurtosis 2.652
Std. Error of Kurtosis .353
Minimum .00
Maximum 100.00
Percentiles
25 81.2500
50 96.0000
75 99.0000
Table 1 Descriptive statistics for score
Results show that the mean score is 81.81 whereas the median score is 96. This shows that
there is high variation in the data set as the mean value is affected by the extreme values. The
standard deviation is also quite high. The high variation in the score can also be seen from the
minimum and maximum score. On one hand the minimum score is as low as 0 whereas the
maximum score is as high as 100. Results also show that most of the firms who have score of
100 belongs to information technology industry. Similarly the results from percentile show
that 75 % of the firms have score of 99 of lower as the value for 75th percentile is 99.
3 | P a g e
⊘ This is a preview!⊘
Do you want full access?
Subscribe today to unlock all pages.

Trusted by 1+ million students worldwide

Industry
Frequency Percent Valid Percent Cumulative
Percent
Valid
Energy 9 4.8 4.8 4.8
Financials 31 16.5 16.5 21.3
Health Care 31 16.5 16.5 37.8
Information Technology 96 51.1 51.1 88.8
Telecommunication
Services
21 11.2 11.2 100.0
Total 188 100.0 100.0
Table 2 Distribution of companies on the basis of their industry
Similarly the descriptive statistics for industry shows that more than 50 % of the firms in the
data set belongs to information technology sector followed by Financials and Healthcare. The
number of firms in the energy sector is only 4.8 % of the total data set.
disclousure
Frequency Percent Valid Percent Cumulative Percent
Valid
No 18 9.6 9.6 9.6
Yes 170 90.4 90.4 100.0
Total 188 100.0 100.0
Table 3 Distribution of companies on the basis of their disclosure status
In terms of disclosure more than 90 % of the firms disclose their carbon emission and only
9.6 % firms (in the data set) do not disclose. This is may be due to different rules and
regulations in every country, or in some cases the firms are not willing to disclose the data as
it might affect their performance.
4 | P a g e
Paraphrase This Document
Need a fresh take? Get an instant paraphrase of this document with our AI Paraphraser

Australia
Belgium
Canada
China
Denmark
Finland
France
Germany
Guernsey
India
Ireland
Italy
Japan
Korea
Netherlands
Norway
Portugal
Singapore
South Africa
South Korea
Spain
Sweden
Switzerland
Taiwan
United Kingdom
USA
0.0
10.0
20.0
30.0
40.0
Country
Country
Figure 1 Distribution of the companies included in the study on the basis of the country
Results for countries shows that most of the firms are from United States followed by United
Kingdom and Japan. This indicates that most of the firms in the data set are from the
developed world where the advancement in technology has helped them to reduce the carbon
emission as compared to the developing countries.
Not influencing Influencing
0.00%
10.00%
20.00%
30.00%
40.00%
50.00%
60.00%
70.00%
80.00%
90.00%
Status of the companies in the study
Figure 2 Status of the companies included in the study related to their influence on
public policy on climate change
As already discussed around 10 % of the total firms in the data set do not disclose their
carbon emission data where rest of the 90 % firms disclose their data.
While collecting the primary data the respondents were asked whether their firm influence on
public policy related to climate change and four different options were also given to know
how the firms influence. The four different options were direct engagement with policy
makers, trade associations, funding research organisation and others.
5 | P a g e

Results from the influence data shows that around 55 % of the firms influence on public
policy through direct engagement with the policy makers.
Direct engagemen with policy makers Others
0.00%
10.00%
20.00%
30.00%
40.00%
50.00%
60.00%
method of influencing public policy
Figure 3 Influencing through direct engagement with policy makers
Trade associates Others
0.00%
10.00%
20.00%
30.00%
40.00%
50.00%
60.00%
70.00%
80.00%
90.00%
Method of influencing public policy
Figure 4 influencing the public policy on climate change through trade associates
Similarly around 15 % firms use the method of trade associated to influence the public policy
as shown the above figure.
6 | P a g e
⊘ This is a preview!⊘
Do you want full access?
Subscribe today to unlock all pages.

Trusted by 1+ million students worldwide

Funding researah organisation Others
0.00%
10.00%
20.00%
30.00%
40.00%
50.00%
60.00%
70.00%
80.00%
Funding research organisations
Figure 5 Influencing the public policy through funding research organisations on
climate change
Finally 30 % of the firms said they use the method of funding research organisation as a
process of influencing the public policy. This can be called as the indirect influencing as the
firms are not directly involving in the process. However one should note that there are many
firms which follow two or more than two methods for influencing.
Data Analysis - Inferential: (Assessed)
Correlations
score DE TA FR
score
Pearson Correlation 1 .224** .118 .142
Sig. (2-tailed) .002 .108 .052
N 188 188 188 188
DE
Pearson Correlation .224** 1 -.544** .393**
Sig. (2-tailed) .002 .000 .000
N 188 188 188 188
TA
Pearson Correlation .118 -.544** 1 -.107
Sig. (2-tailed) .108 .000 .142
N 188 188 188 188
FR
Pearson Correlation .142 .393** -.107 1
Sig. (2-tailed) .052 .000 .142
N 188 188 188 188
**. Correlation is significant at the 0.01 level (2-tailed).
Table 4 Correlation analysis between carbon disclosure score and various influencing
methods used by companies
7 | P a g e
Paraphrase This Document
Need a fresh take? Get an instant paraphrase of this document with our AI Paraphraser

For the inferential analysis the correlation analysis has been conducted and the results are
shown in the table above. Correlation analysis is used to examine the relationship between
the two variables and the results from the correlation help to find the how strongly are the
variable related and also the direction of relationship.
In this case, the main aim is to see the relationship between score and the different
influencing method used by the firms. So the results show that direct engagement with the
policy makers and carbon disclosure score are positively correlated. Also the sig (2-tailed) is
less than 0.05 which ensure that the correlation coefficient is significant. However for the
other two influencing method the correlation is positive with score but the correlation is not
significant at 5 %. So on the basis of these results it can be said that our hypothesis is
partially true.
Since correlation does not give proper conclusion about the relationship, so in the next
inferential analysis the regression model will be used. The regression is used to see the
change in the dependent variable which is explained by the independent variables. So
regression analysis will give clearer picture about the proposed hypothesis.
References
Clarkson, P. et al., 2010. The relevance of environmental disclosures for investors and other
stakeholder groups: which audience are firms speaking to?, Queensland.
Cormier, D., Ledoux, M. & Magnan, M., 2011. The informational contribution of social and
environmental disclosures for investors. Management Decision, 49(8), pp.1276–1304.
Najah, M.M. & Cotter, J., 2013. Are climate change disclosures an indicator of superior
climate change risk management?, Queensland.
8 | P a g e
1 out of 8
Related Documents

Your All-in-One AI-Powered Toolkit for Academic Success.
+13062052269
info@desklib.com
Available 24*7 on WhatsApp / Email
Unlock your academic potential
Copyright © 2020–2025 A2Z Services. All Rights Reserved. Developed and managed by ZUCOL.