MGT723 Research Project: Carbon Disclosure and Industry Performance
VerifiedAdded on 2021/05/31
|11
|1870
|33
Report
AI Summary
This research project, identified as MGT723, investigates the impact of voluntary carbon disclosure and carbon emissions on organizational performance. The study utilizes data from the Carbon Disclosure Project (CDP) survey, encompassing 306 organizations. The project formulates hypotheses, detailing the data collection process, which includes disclosure scores, carbon emission scopes, and organizational initiatives. The analysis employs descriptive statistics, correlation analysis, and the Mann-Whitney U Test, with results presented through tables and figures. The findings reveal a weak negative correlation between carbon emissions and disclosure scores, alongside an insignificant relationship. The report concludes with references to relevant literature.
Running Head: MGT723 RESEARCH PROJECT
MGT723 Research Project
Legitimacy Theory and Carbon Disclosure
Name of the Student
Name of the University
Author Note
MGT723 Research Project
Legitimacy Theory and Carbon Disclosure
Name of the Student
Name of the University
Author Note
Paraphrase This Document
Need a fresh take? Get an instant paraphrase of this document with our AI Paraphraser
1MGT723 RESEARCH PROJECT
Table of Contents
Introduction................................................................................................................................2
Conceptual Framework..............................................................................................................2
Hypothesis..................................................................................................................................2
Data Collection...........................................................................................................................3
Data Analysis – Descriptive.......................................................................................................4
Descriptive Statistics..............................................................................................................5
Inferential Statistics....................................................................................................................8
References................................................................................................................................10
2MGT723 RESEARCH PROJECT
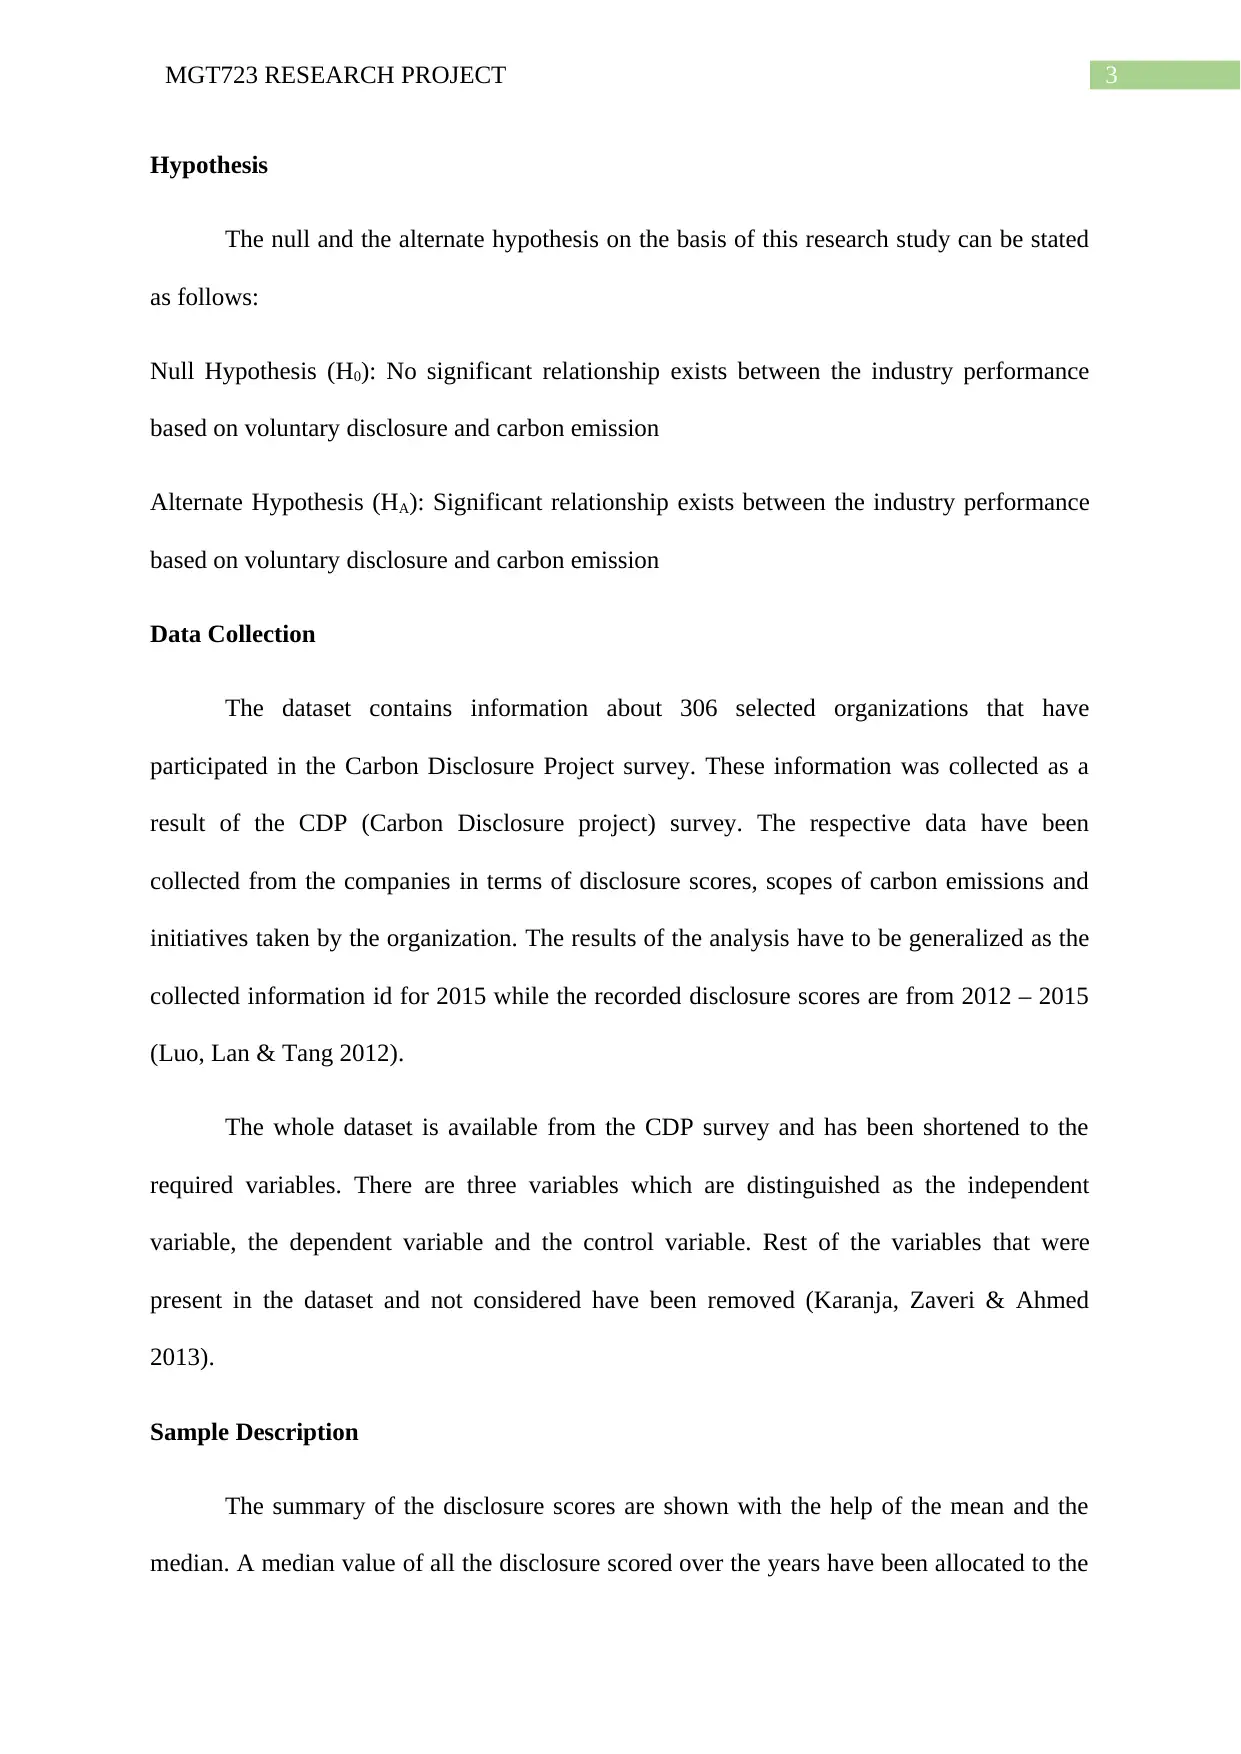
Introduction
This is a research project where the main interest of the study is assessing the impact
of voluntary disclosure and carbon emission on the performance of the organization
(Albertini 2013). This is a new concept and assessment of the actions to be taken in the future
in order to manage the risks and the opportunities to the organization is done with the help of
quantitative analysis (Saka & Oshika 2014). The data collection and the analysis and
interpretation of the data is presented in this report. Analysis will be conducted with the help
of SPSS. Analysis will be conducted based on the information collected from 306
organizations on 2015.
Conceptual Framework
⊘ This is a preview!⊘
Do you want full access?
Subscribe today to unlock all pages.
Trusted by 1+ million students worldwide
3MGT723 RESEARCH PROJECT
Hypothesis
The null and the alternate hypothesis on the basis of this research study can be stated
as follows:
Null Hypothesis (H0): No significant relationship exists between the industry performance
based on voluntary disclosure and carbon emission
Alternate Hypothesis (HA): Significant relationship exists between the industry performance
based on voluntary disclosure and carbon emission
Data Collection
The dataset contains information about 306 selected organizations that have
participated in the Carbon Disclosure Project survey. These information was collected as a
result of the CDP (Carbon Disclosure project) survey. The respective data have been
collected from the companies in terms of disclosure scores, scopes of carbon emissions and
initiatives taken by the organization. The results of the analysis have to be generalized as the
collected information id for 2015 while the recorded disclosure scores are from 2012 – 2015
(Luo, Lan & Tang 2012).
The whole dataset is available from the CDP survey and has been shortened to the
required variables. There are three variables which are distinguished as the independent
variable, the dependent variable and the control variable. Rest of the variables that were
present in the dataset and not considered have been removed (Karanja, Zaveri & Ahmed
2013).
Sample Description
The summary of the disclosure scores are shown with the help of the mean and the
median. A median value of all the disclosure scored over the years have been allocated to the
Paraphrase This Document
Need a fresh take? Get an instant paraphrase of this document with our AI Paraphraser
4MGT723 RESEARCH PROJECT
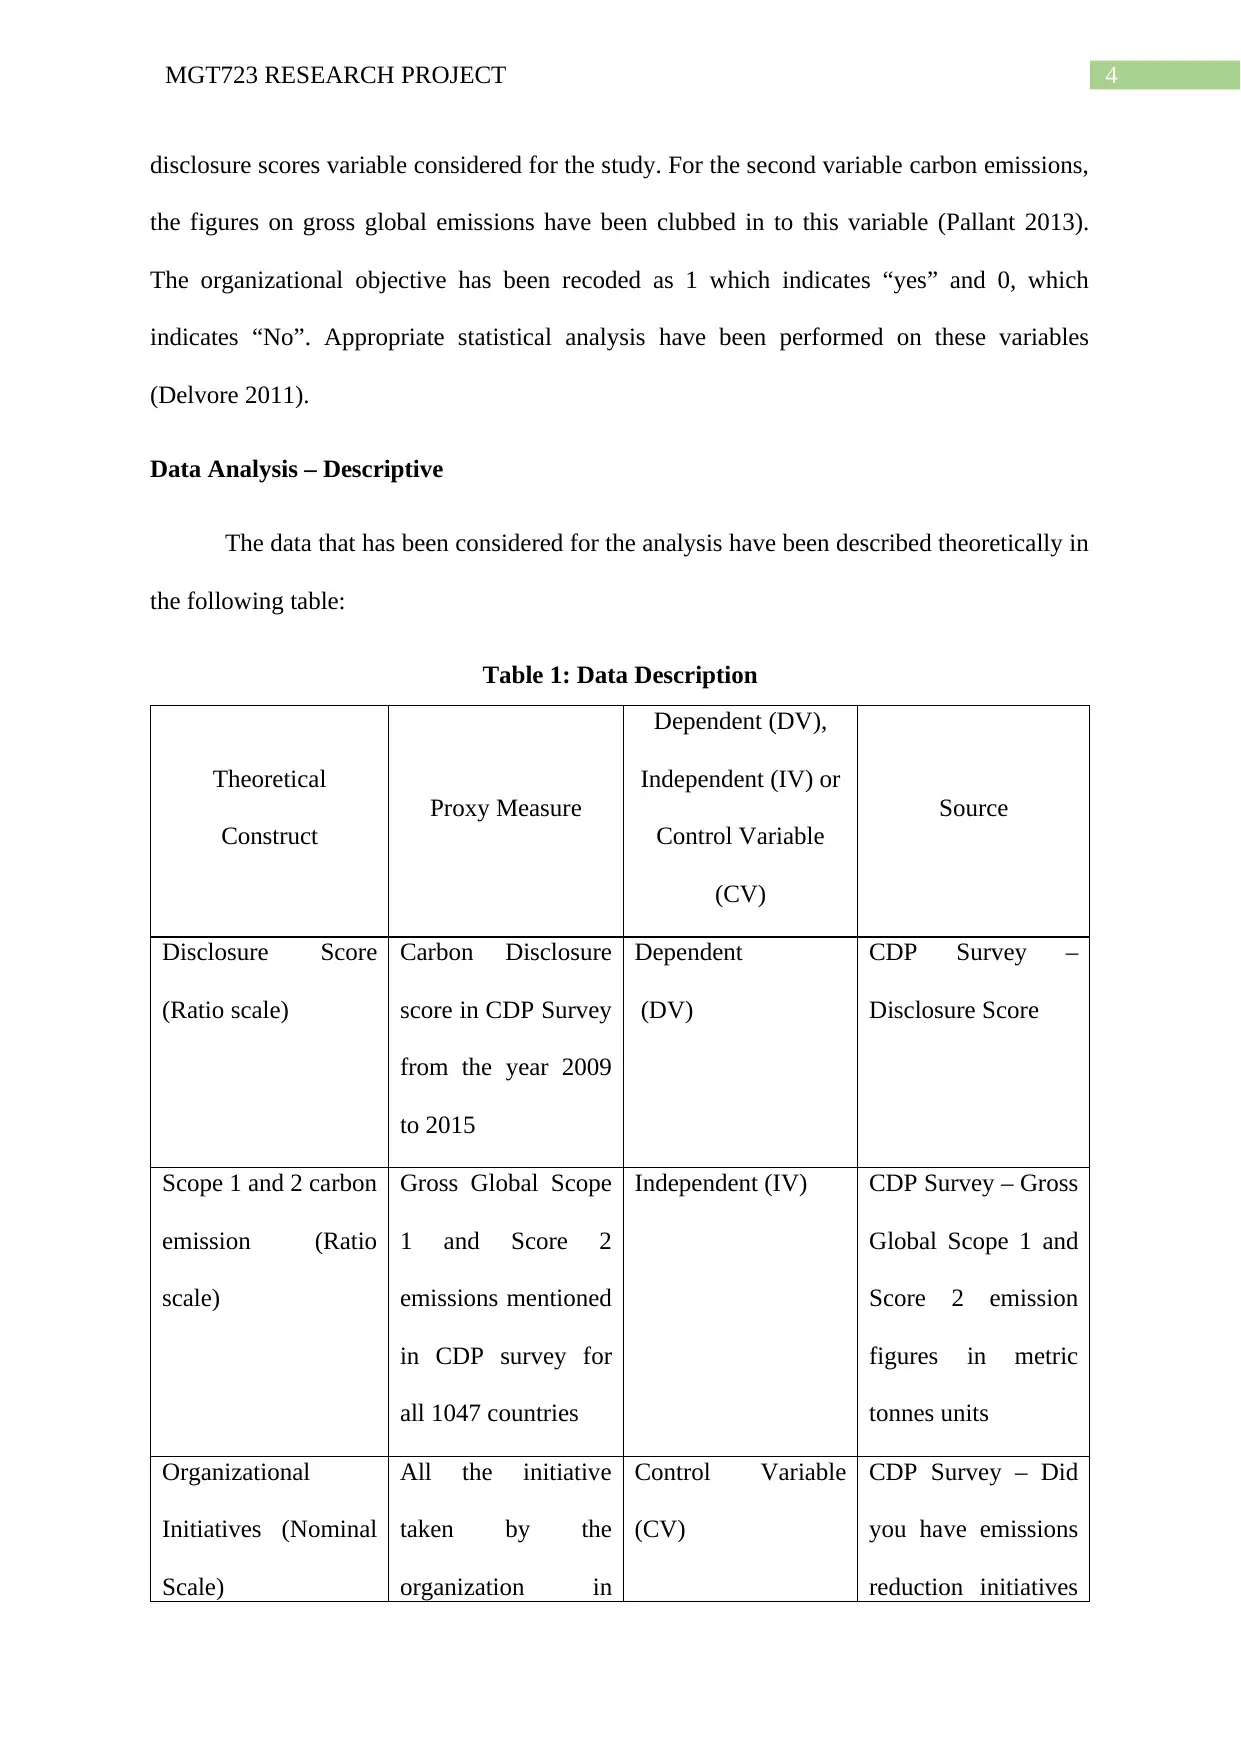
disclosure scores variable considered for the study. For the second variable carbon emissions,
the figures on gross global emissions have been clubbed in to this variable (Pallant 2013).
The organizational objective has been recoded as 1 which indicates “yes” and 0, which
indicates “No”. Appropriate statistical analysis have been performed on these variables
(Delvore 2011).
Data Analysis – Descriptive
The data that has been considered for the analysis have been described theoretically in
the following table:
Table 1: Data Description
Theoretical
Construct
Proxy Measure
Dependent (DV),
Independent (IV) or
Control Variable
(CV)
Source
Disclosure Score
(Ratio scale)
Carbon Disclosure
score in CDP Survey
from the year 2009
to 2015
Dependent
(DV)
CDP Survey –
Disclosure Score
Scope 1 and 2 carbon
emission (Ratio
scale)
Gross Global Scope
1 and Score 2
emissions mentioned
in CDP survey for
all 1047 countries
Independent (IV) CDP Survey – Gross
Global Scope 1 and
Score 2 emission
figures in metric
tonnes units
Organizational
Initiatives (Nominal
Scale)
All the initiative
taken by the
organization in
Control Variable
(CV)
CDP Survey – Did
you have emissions
reduction initiatives
5MGT723 RESEARCH PROJECT
categorical values
(Yes = 2 and No =
1)
that were active?
The descriptive statistics for the data has been calculated according to the nature of
the data that has been described in the above given table.
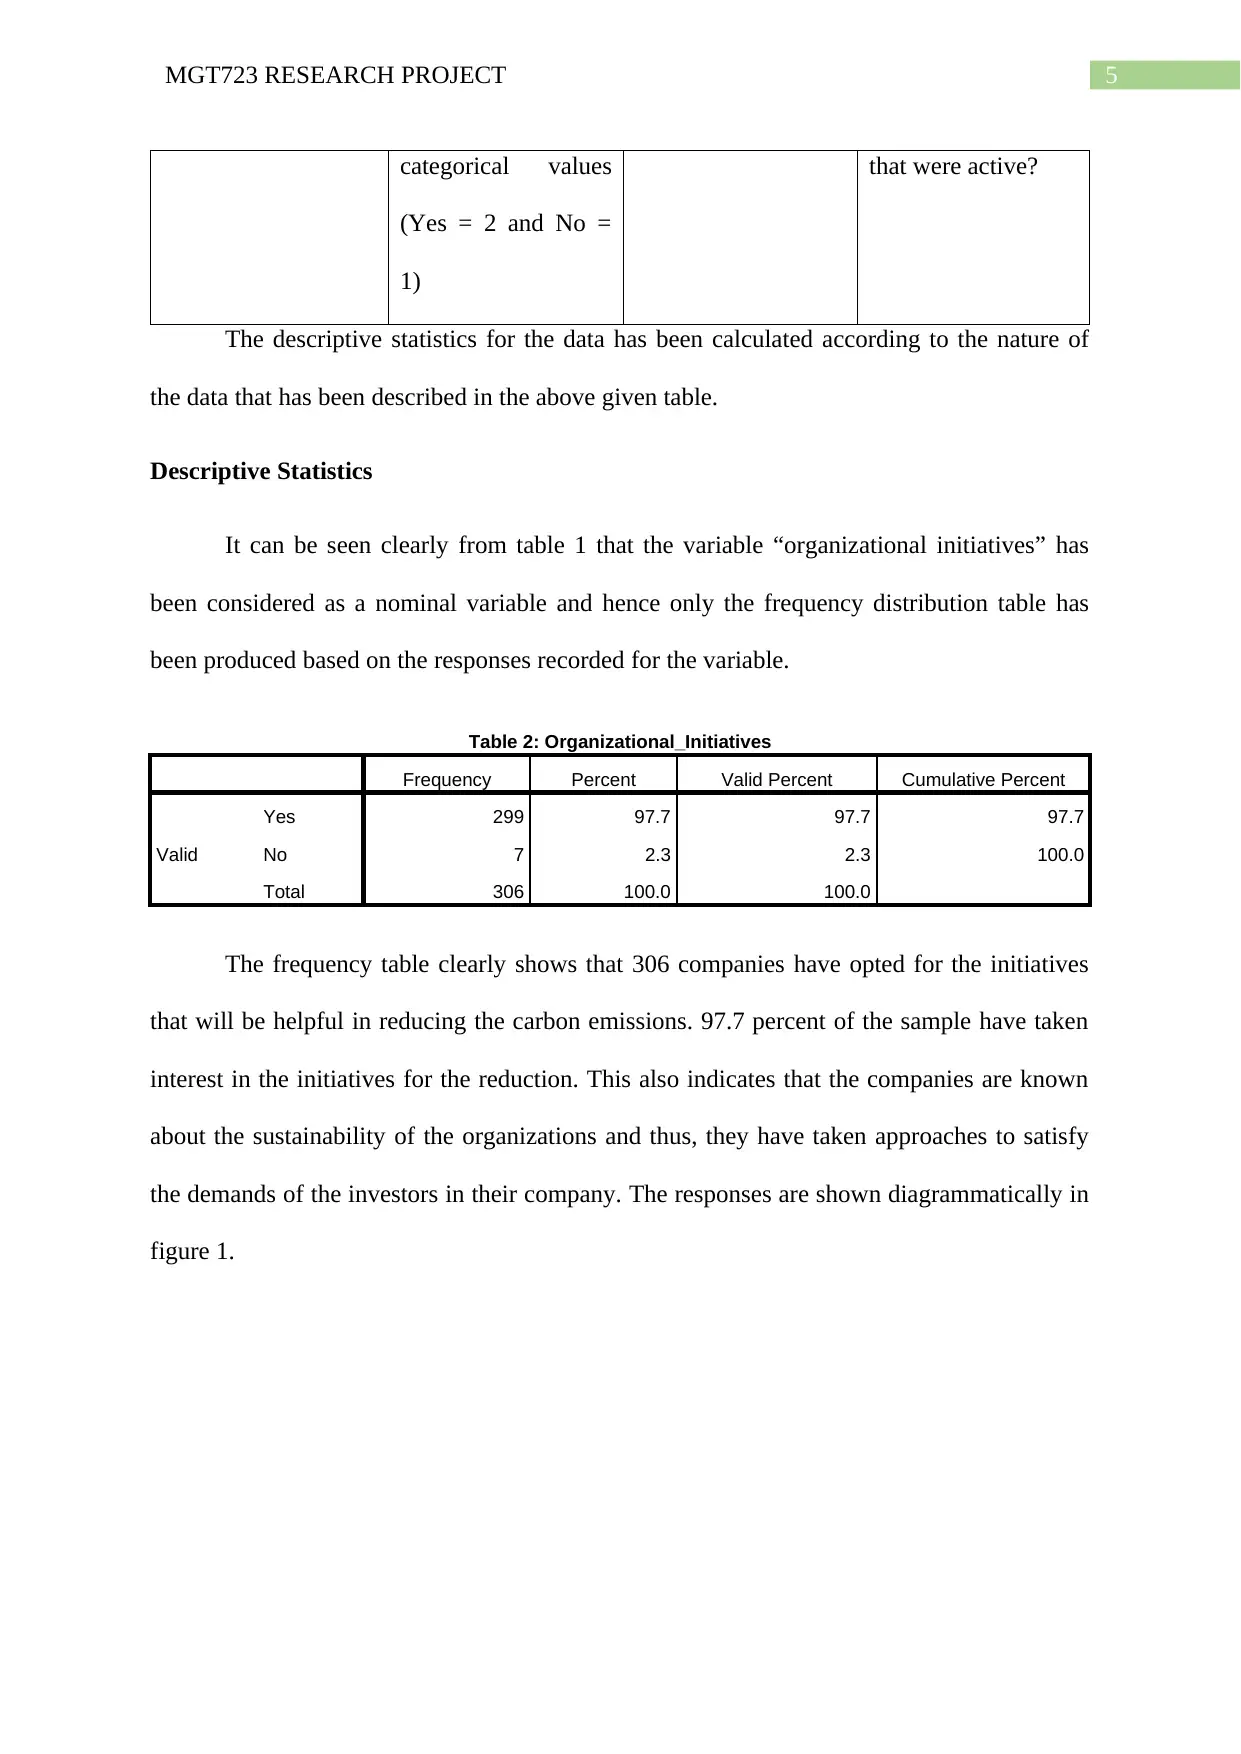
Descriptive Statistics
It can be seen clearly from table 1 that the variable “organizational initiatives” has
been considered as a nominal variable and hence only the frequency distribution table has
been produced based on the responses recorded for the variable.
Table 2: Organizational_Initiatives
Frequency Percent Valid Percent Cumulative Percent
Valid
Yes 299 97.7 97.7 97.7
No 7 2.3 2.3 100.0
Total 306 100.0 100.0
The frequency table clearly shows that 306 companies have opted for the initiatives
that will be helpful in reducing the carbon emissions. 97.7 percent of the sample have taken
interest in the initiatives for the reduction. This also indicates that the companies are known
about the sustainability of the organizations and thus, they have taken approaches to satisfy
the demands of the investors in their company. The responses are shown diagrammatically in
figure 1.
categorical values
(Yes = 2 and No =
1)
that were active?
The descriptive statistics for the data has been calculated according to the nature of
the data that has been described in the above given table.
Descriptive Statistics
It can be seen clearly from table 1 that the variable “organizational initiatives” has
been considered as a nominal variable and hence only the frequency distribution table has
been produced based on the responses recorded for the variable.
Table 2: Organizational_Initiatives
Frequency Percent Valid Percent Cumulative Percent
Valid
Yes 299 97.7 97.7 97.7
No 7 2.3 2.3 100.0
Total 306 100.0 100.0
The frequency table clearly shows that 306 companies have opted for the initiatives
that will be helpful in reducing the carbon emissions. 97.7 percent of the sample have taken
interest in the initiatives for the reduction. This also indicates that the companies are known
about the sustainability of the organizations and thus, they have taken approaches to satisfy
the demands of the investors in their company. The responses are shown diagrammatically in
figure 1.
⊘ This is a preview!⊘
Do you want full access?
Subscribe today to unlock all pages.
Trusted by 1+ million students worldwide
6MGT723 RESEARCH PROJECT
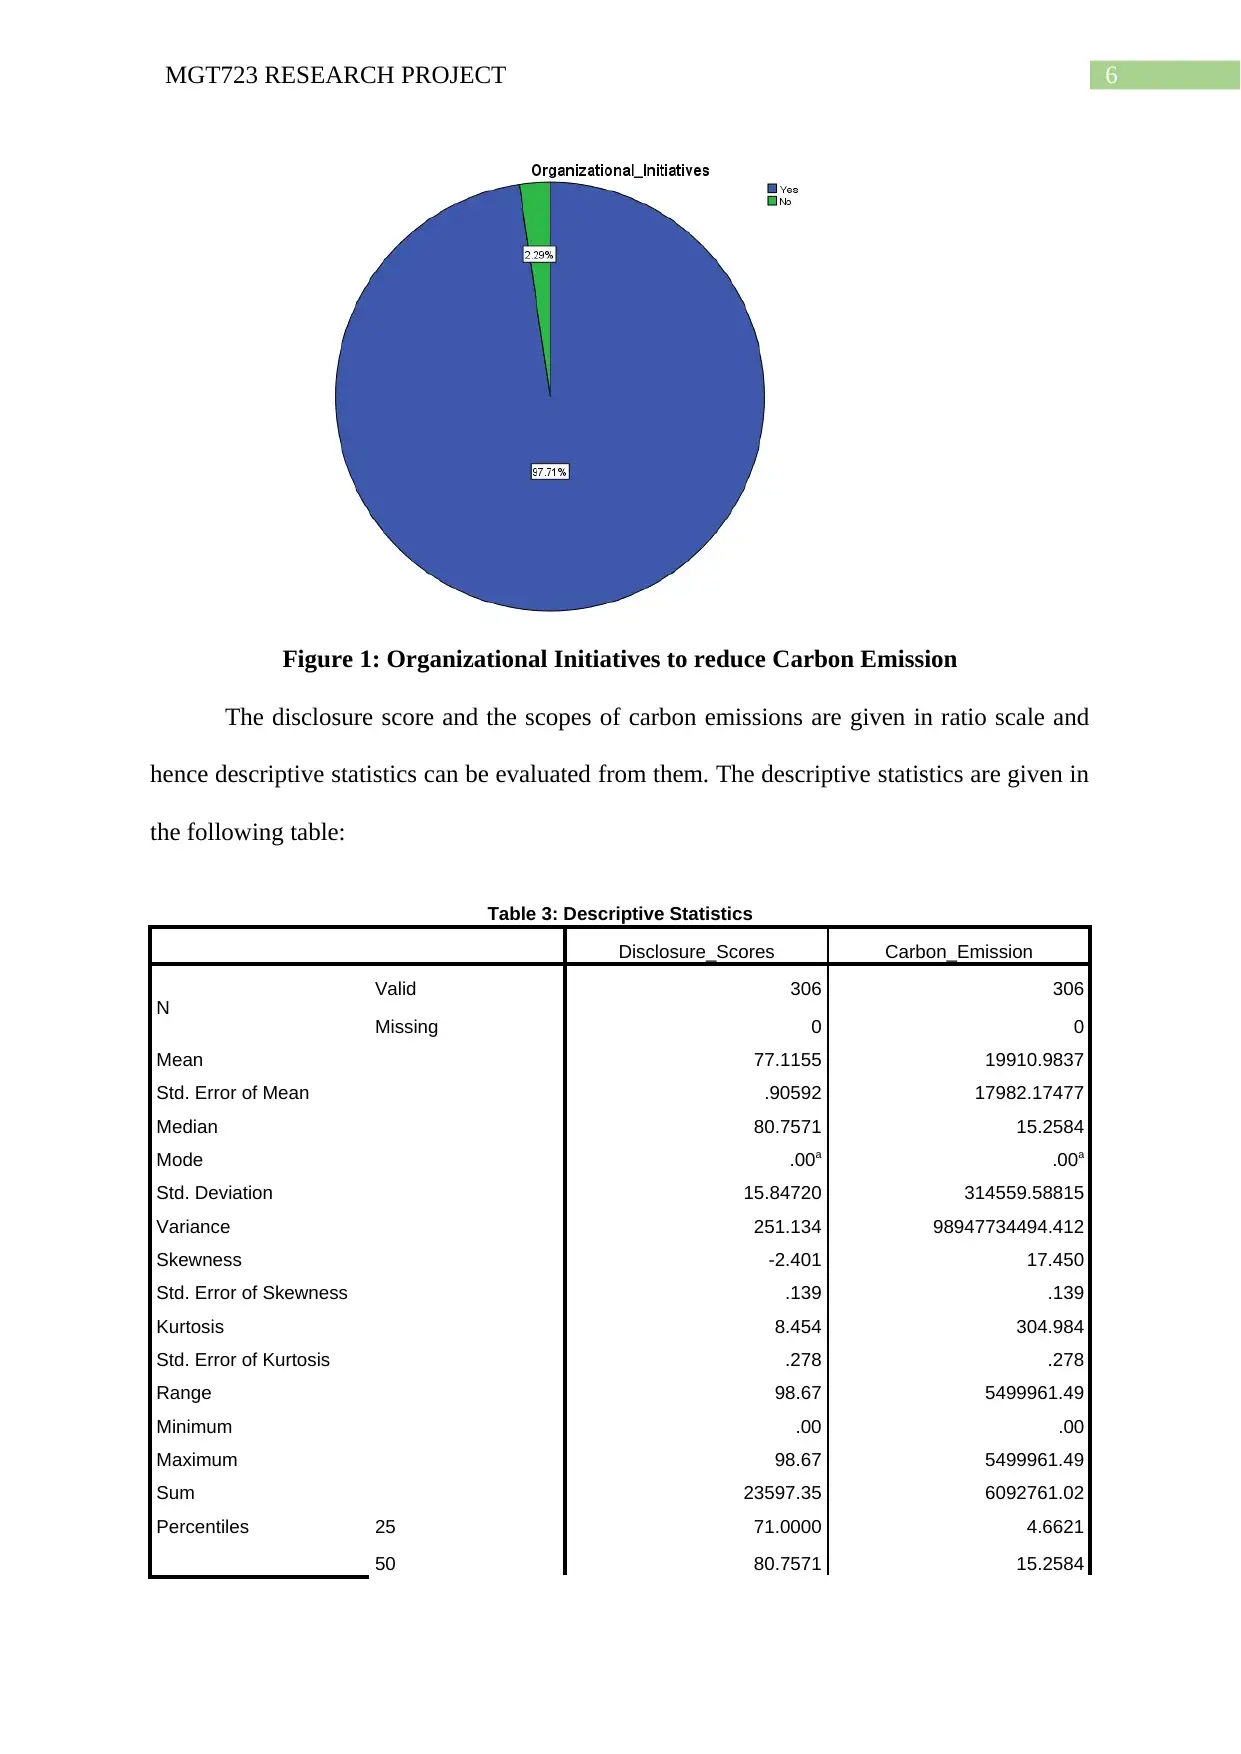
Figure 1: Organizational Initiatives to reduce Carbon Emission
The disclosure score and the scopes of carbon emissions are given in ratio scale and
hence descriptive statistics can be evaluated from them. The descriptive statistics are given in
the following table:
Table 3: Descriptive Statistics
Disclosure_Scores Carbon_Emission
N Valid 306 306
Missing 0 0
Mean 77.1155 19910.9837
Std. Error of Mean .90592 17982.17477
Median 80.7571 15.2584
Mode .00a .00a
Std. Deviation 15.84720 314559.58815
Variance 251.134 98947734494.412
Skewness -2.401 17.450
Std. Error of Skewness .139 .139
Kurtosis 8.454 304.984
Std. Error of Kurtosis .278 .278
Range 98.67 5499961.49
Minimum .00 .00
Maximum 98.67 5499961.49
Sum 23597.35 6092761.02
Percentiles 25 71.0000 4.6621
50 80.7571 15.2584
Paraphrase This Document
Need a fresh take? Get an instant paraphrase of this document with our AI Paraphraser
7MGT723 RESEARCH PROJECT
75 86.5714 86.3346
a. Multiple modes exist. The smallest value is shown
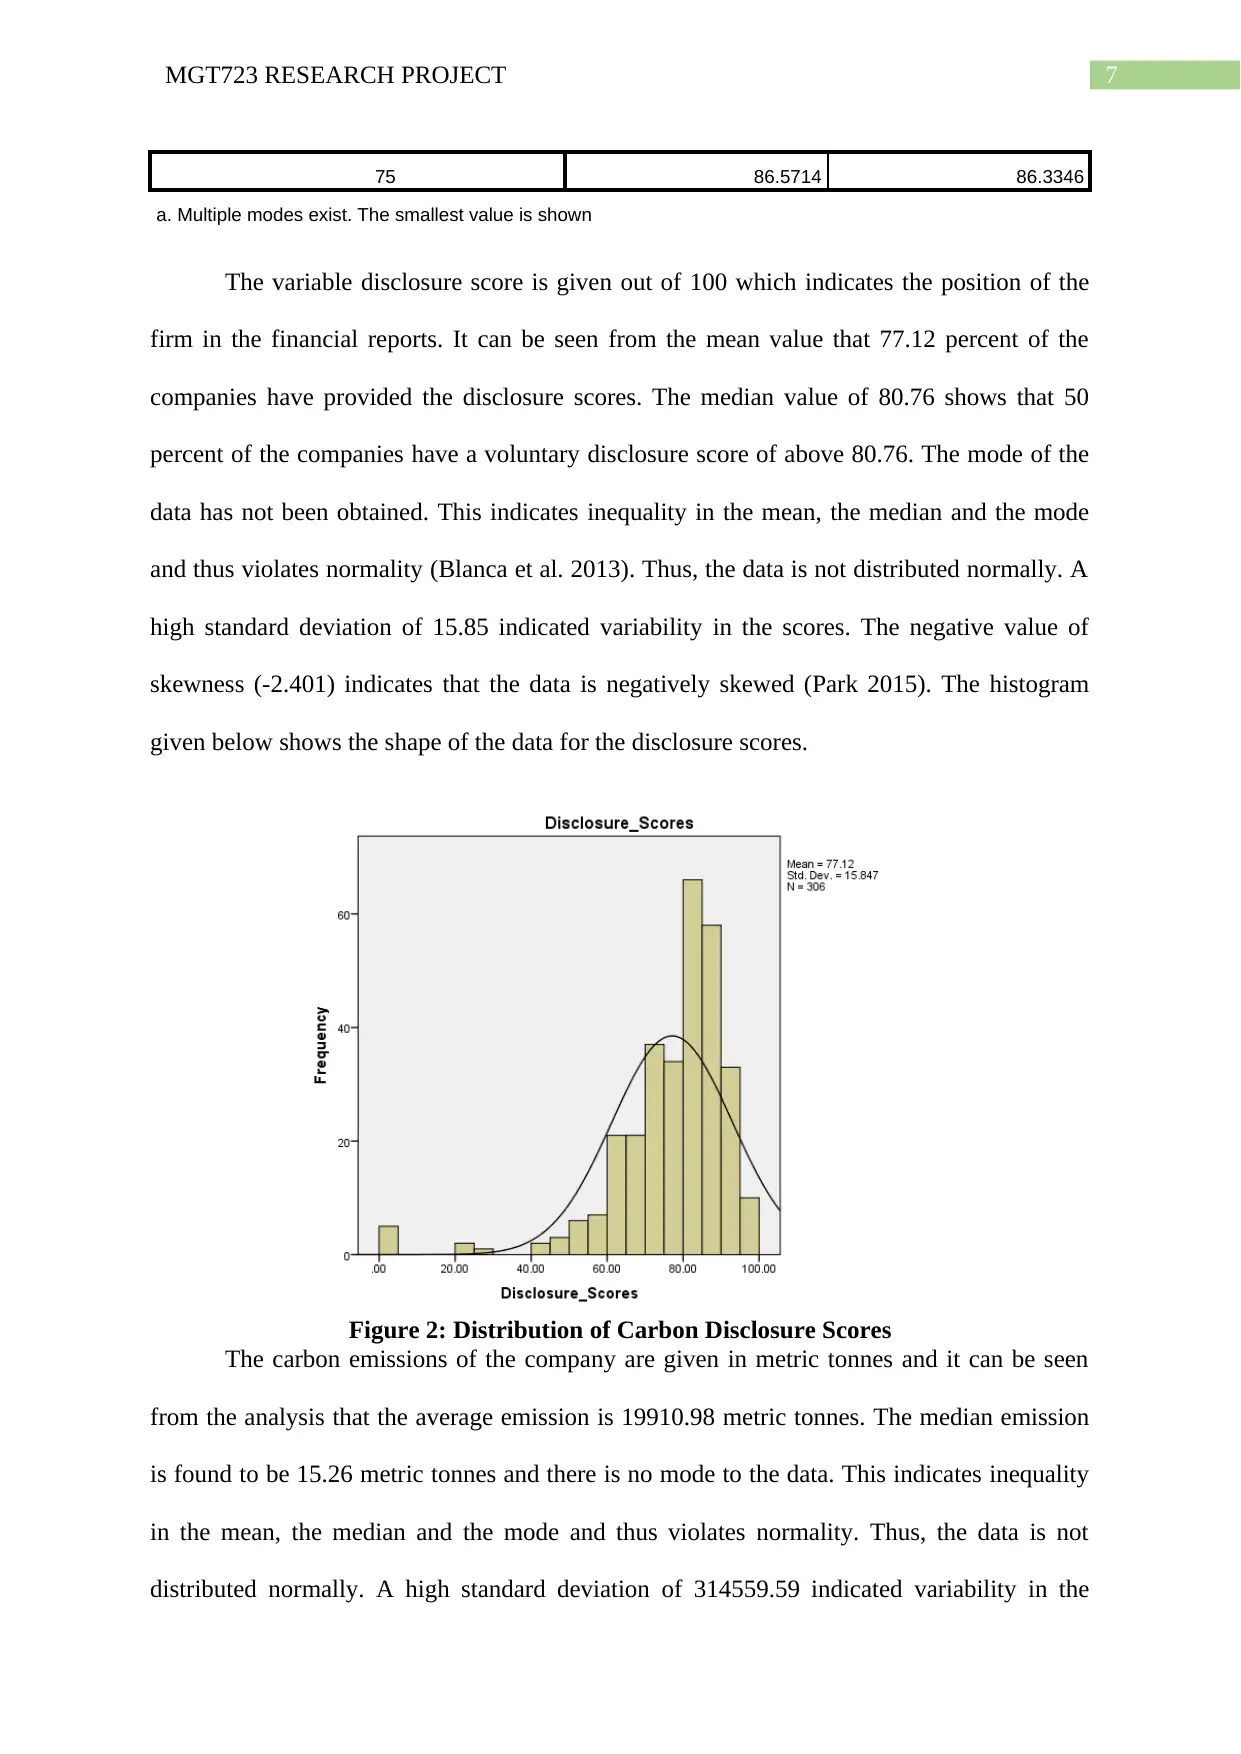
The variable disclosure score is given out of 100 which indicates the position of the
firm in the financial reports. It can be seen from the mean value that 77.12 percent of the
companies have provided the disclosure scores. The median value of 80.76 shows that 50
percent of the companies have a voluntary disclosure score of above 80.76. The mode of the
data has not been obtained. This indicates inequality in the mean, the median and the mode
and thus violates normality (Blanca et al. 2013). Thus, the data is not distributed normally. A
high standard deviation of 15.85 indicated variability in the scores. The negative value of
skewness (-2.401) indicates that the data is negatively skewed (Park 2015). The histogram
given below shows the shape of the data for the disclosure scores.
Figure 2: Distribution of Carbon Disclosure Scores
The carbon emissions of the company are given in metric tonnes and it can be seen
from the analysis that the average emission is 19910.98 metric tonnes. The median emission
is found to be 15.26 metric tonnes and there is no mode to the data. This indicates inequality
in the mean, the median and the mode and thus violates normality. Thus, the data is not
distributed normally. A high standard deviation of 314559.59 indicated variability in the
75 86.5714 86.3346
a. Multiple modes exist. The smallest value is shown
The variable disclosure score is given out of 100 which indicates the position of the
firm in the financial reports. It can be seen from the mean value that 77.12 percent of the
companies have provided the disclosure scores. The median value of 80.76 shows that 50
percent of the companies have a voluntary disclosure score of above 80.76. The mode of the
data has not been obtained. This indicates inequality in the mean, the median and the mode
and thus violates normality (Blanca et al. 2013). Thus, the data is not distributed normally. A
high standard deviation of 15.85 indicated variability in the scores. The negative value of
skewness (-2.401) indicates that the data is negatively skewed (Park 2015). The histogram
given below shows the shape of the data for the disclosure scores.
Figure 2: Distribution of Carbon Disclosure Scores
The carbon emissions of the company are given in metric tonnes and it can be seen
from the analysis that the average emission is 19910.98 metric tonnes. The median emission
is found to be 15.26 metric tonnes and there is no mode to the data. This indicates inequality
in the mean, the median and the mode and thus violates normality. Thus, the data is not
distributed normally. A high standard deviation of 314559.59 indicated variability in the
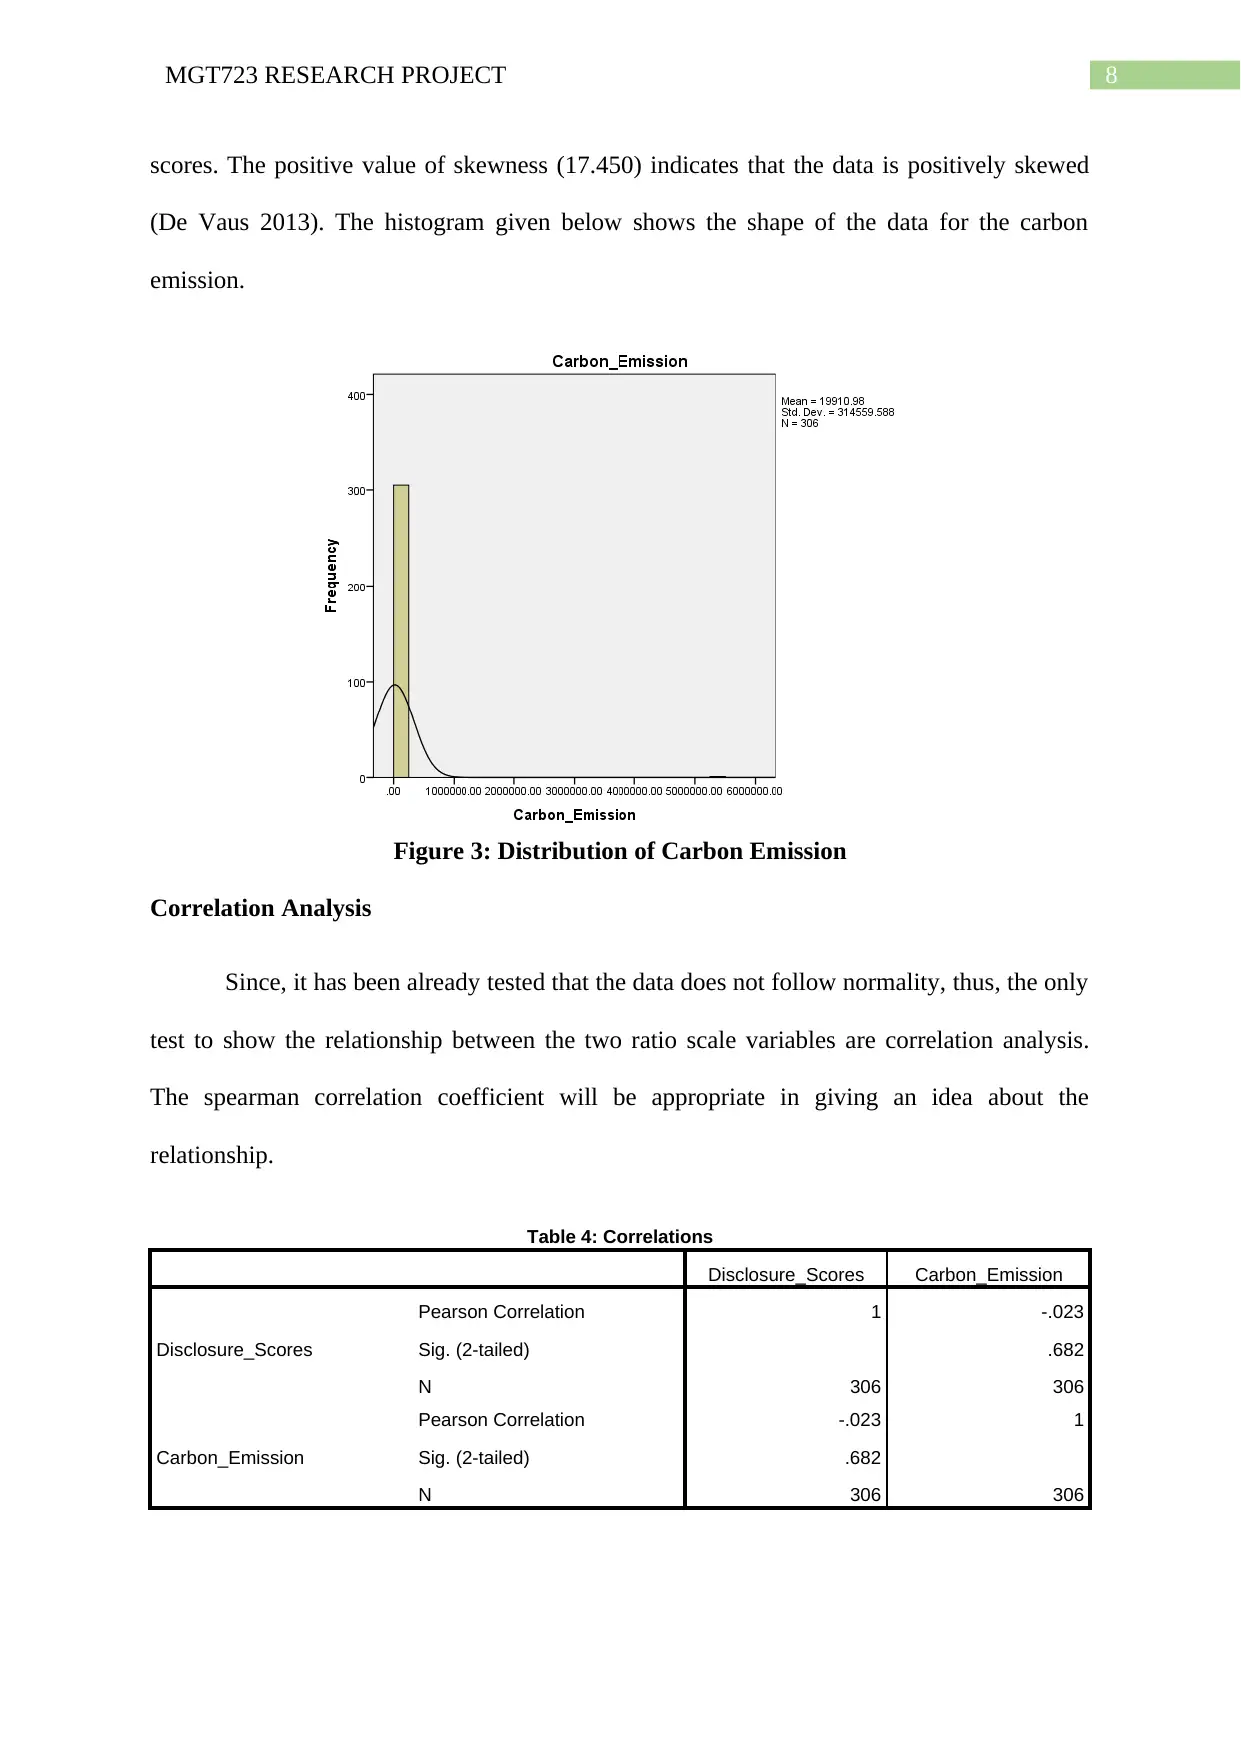
8MGT723 RESEARCH PROJECT
scores. The positive value of skewness (17.450) indicates that the data is positively skewed
(De Vaus 2013). The histogram given below shows the shape of the data for the carbon
emission.
Figure 3: Distribution of Carbon Emission
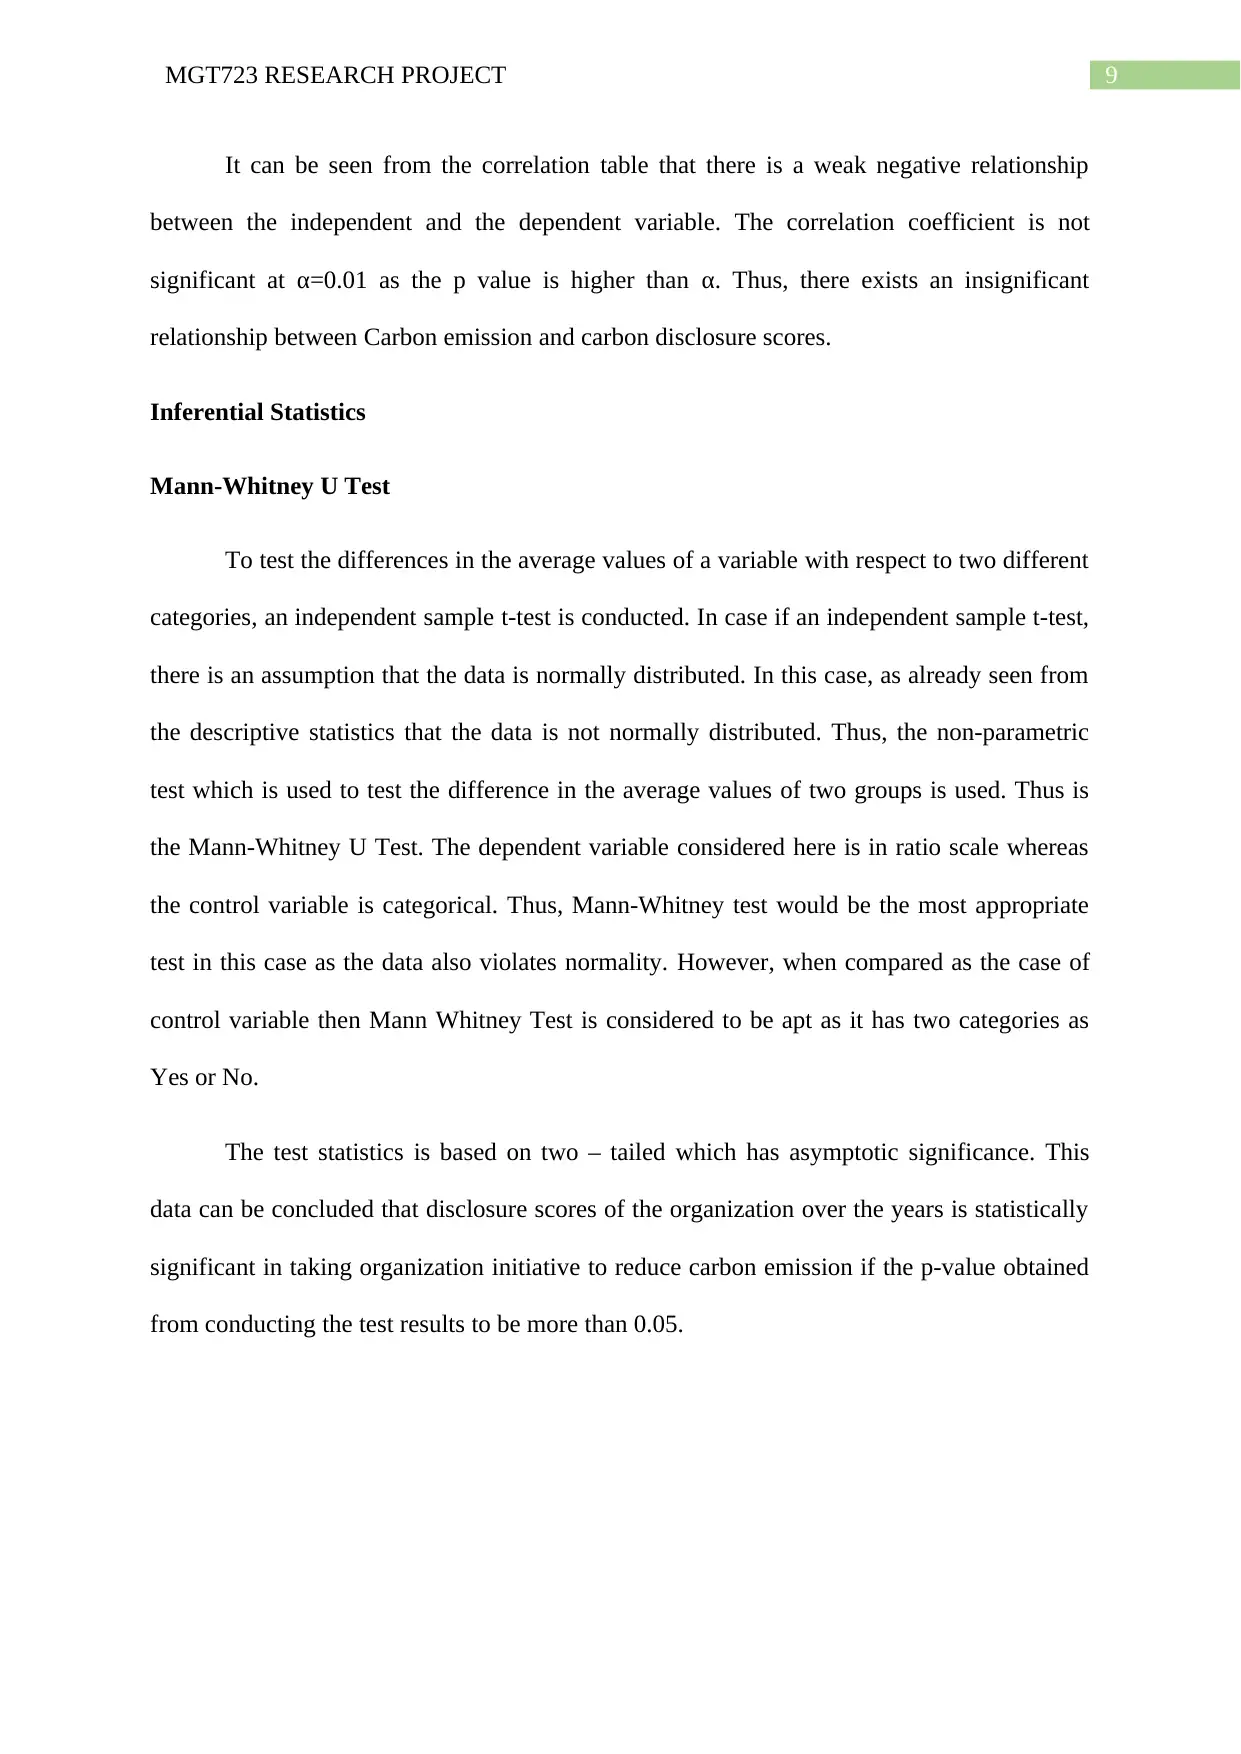
Correlation Analysis
Since, it has been already tested that the data does not follow normality, thus, the only
test to show the relationship between the two ratio scale variables are correlation analysis.
The spearman correlation coefficient will be appropriate in giving an idea about the
relationship.
Table 4: Correlations
Disclosure_Scores Carbon_Emission
Disclosure_Scores
Pearson Correlation 1 -.023
Sig. (2-tailed) .682
N 306 306
Carbon_Emission
Pearson Correlation -.023 1
Sig. (2-tailed) .682
N 306 306
scores. The positive value of skewness (17.450) indicates that the data is positively skewed
(De Vaus 2013). The histogram given below shows the shape of the data for the carbon
emission.
Figure 3: Distribution of Carbon Emission
Correlation Analysis
Since, it has been already tested that the data does not follow normality, thus, the only
test to show the relationship between the two ratio scale variables are correlation analysis.
The spearman correlation coefficient will be appropriate in giving an idea about the
relationship.
Table 4: Correlations
Disclosure_Scores Carbon_Emission
Disclosure_Scores
Pearson Correlation 1 -.023
Sig. (2-tailed) .682
N 306 306
Carbon_Emission
Pearson Correlation -.023 1
Sig. (2-tailed) .682
N 306 306
⊘ This is a preview!⊘
Do you want full access?
Subscribe today to unlock all pages.
Trusted by 1+ million students worldwide
9MGT723 RESEARCH PROJECT
It can be seen from the correlation table that there is a weak negative relationship
between the independent and the dependent variable. The correlation coefficient is not
significant at α=0.01 as the p value is higher than α. Thus, there exists an insignificant
relationship between Carbon emission and carbon disclosure scores.
Inferential Statistics
Mann-Whitney U Test
To test the differences in the average values of a variable with respect to two different
categories, an independent sample t-test is conducted. In case if an independent sample t-test,
there is an assumption that the data is normally distributed. In this case, as already seen from
the descriptive statistics that the data is not normally distributed. Thus, the non-parametric
test which is used to test the difference in the average values of two groups is used. Thus is
the Mann-Whitney U Test. The dependent variable considered here is in ratio scale whereas
the control variable is categorical. Thus, Mann-Whitney test would be the most appropriate
test in this case as the data also violates normality. However, when compared as the case of
control variable then Mann Whitney Test is considered to be apt as it has two categories as
Yes or No.
The test statistics is based on two – tailed which has asymptotic significance. This
data can be concluded that disclosure scores of the organization over the years is statistically
significant in taking organization initiative to reduce carbon emission if the p-value obtained
from conducting the test results to be more than 0.05.
Paraphrase This Document
Need a fresh take? Get an instant paraphrase of this document with our AI Paraphraser
10MGT723 RESEARCH PROJECT
References
Albertini, E., 2013. Does environmental management improve financial performance? A
meta-analytical review. Organization & Environment, 26(4), pp.431-457.
Blanca, M.J., Arnau, J., López-Montiel, D., Bono, R. and Bendayan, R., 2013. Skewness and
kurtosis in real data samples. Methodology.
De Vaus, D., 2013. Surveys in social research. Routledge.
Devore, J.L., 2011. Probability and Statistics for Engineering and the Sciences. Cengage
learning.
Karanja, E., Zaveri, J. and Ahmed, A., 2013. How do MIS researchers handle missing data in
survey-based research: A content analysis approach. International Journal of Information
Management, 33(5), pp.734-751.
Luo, L., Lan, Y.C. and Tang, Q., 2012. Corporate incentives to disclose carbon information:
Evidence from the CDP Global 500 report. Journal of International Financial Management
& Accounting, 23(2), pp.93-120.
Pallant, J., 2013. SPSS survival manual. McGraw-Hill Education (UK).
Park, H.M., 2015. Univariate analysis and normality test using SAS, Stata, and SPSS.
Saka, C. and Oshika, T., 2014. Disclosure effects, carbon emissions and corporate
value. Sustainability Accounting, Management and Policy Journal, 5(1), pp.22-45.
1 out of 11
Related Documents


Your All-in-One AI-Powered Toolkit for Academic Success.
+13062052269
info@desklib.com
Available 24*7 on WhatsApp / Email
![[object Object]](/_next/static/media/star-bottom.7253800d.svg)
Unlock your academic potential
Copyright © 2020–2026 A2Z Services. All Rights Reserved. Developed and managed by ZUCOL.