Comparative Economic Analysis: GDP, Fiscal Policies and Growth
VerifiedAdded on 2020/02/03
|15
|2967
|37
Report
AI Summary
This report provides an analysis of economic indicators, including GDP per capita, GDP growth, inflation, unemployment, government revenue, and government expenses across five countries: Australia, Brazil, India, Spain, and Zimbabwe. The report examines the trends in these indicators from 2000 to 2015, highlighting the differences and fluctuations in each country's economic performance. It then discusses the impact of fiscal policies, such as government spending and tax policies, on economic outcomes, including aggregate demand and business cycles. The report concludes by explaining how fiscal policies can be used to control economic activities, with emphasis on the challenges associated with their implementation. The report includes data tables and analysis to support its findings and recommendations. The report emphasizes the importance of understanding these economic factors for business organizations and political parties in assessing a country's economic health.

Economic Assignment
Paraphrase This Document
Need a fresh take? Get an instant paraphrase of this document with our AI Paraphraser
Table of Contents
INTRODUCTION...........................................................................................................................3
1.1 Presenting GDP per capita of each country and evaluating differences................................3
1.2 Plotting numeric data set in relation to GDP growth, inflation and unemployment.............4
1.3 Stating the graph of government expenses and revenue........................................................8
TASK 2..........................................................................................................................................11
2.1 Presenting the manner in which government expenses and tax policies have impact on
desired outcome.........................................................................................................................11
2.2 Use of fiscal policies in relation to controlling economic activities and challenges’ which
are associated with it..................................................................................................................11
CONCLUSION..............................................................................................................................12
REFERENCES..............................................................................................................................13
INTRODUCTION
Growth and success of the country is evaluated on the basis of its GDP, per capita
income, inflation, revenue and level of expenses. Hence, by making assessment of all such
elements or factors information regarding the economical aspect can be generated. Hence,
economic growth can be measured from the increase or decrease which takes place in the
capacity in relation to producing goods or services in comparison to another period. Thus, by
evaluating all such key indicator business organizations and political parties can identify the
extent to which economy of specific country is sound. For the present report, five countries have
been selected such as Australia, Brazil, India, Spain and Zimbabwe. In this, report will shed light
on the reasons due to which differences take place in the GDP per capital, growth and inflation
etc. of different countries. Besides this, report will provide deeper insight about the level to
which condition of unemployment exists in varied countries. Report will present fiscal and
monetary policies of Australian economy.
1.1 Presenting GDP per capita of each country and evaluating differences
GDP per capita
Year /
country Brazil Australia India Spain Zimbabwe
2000 3728.51 21665.1 452.41
14676.
7 535.2
2001 3135.15 19495.1 460.83
15323.
6 537.72
2002 2805.71 20059.5 480.62
17019.
5 480.62
2003 3040.51 23440 557.9
21495.
7 448.37
2004 3596.23 30440.9 640.6
24918.
7 451.17
2005 4730.65 33983 729
26510.
7 443.24
2006 5808.34 36084.9 816.73
28482.
6 816.73
2007 7246.87 40957.8 1018.13
32709.
4 1018.13
2008 8706.82 49628.1 991.52
35578.
7 327.2
⊘ This is a preview!⊘
Do you want full access?
Subscribe today to unlock all pages.
Trusted by 1+ million students worldwide
2009 8474.88 42715.1 1090.36
32333.
5 1090.36
2010 1121.42 51845.7 1345.72
30737.
8 374.27
2011 13047.2 62216.5 1461.38
31832.
2 768.56
2012 12179.6 67646.1 1446.77
28562.
3 850.83
2013 1210.6.21 67652.7 1451.53
29210.
1 905.5
2014 11917.8 62004.8 1569.94
29600.
5 931.2
2015 8677.77 56290.65 1593.25
25684.
7 924.14
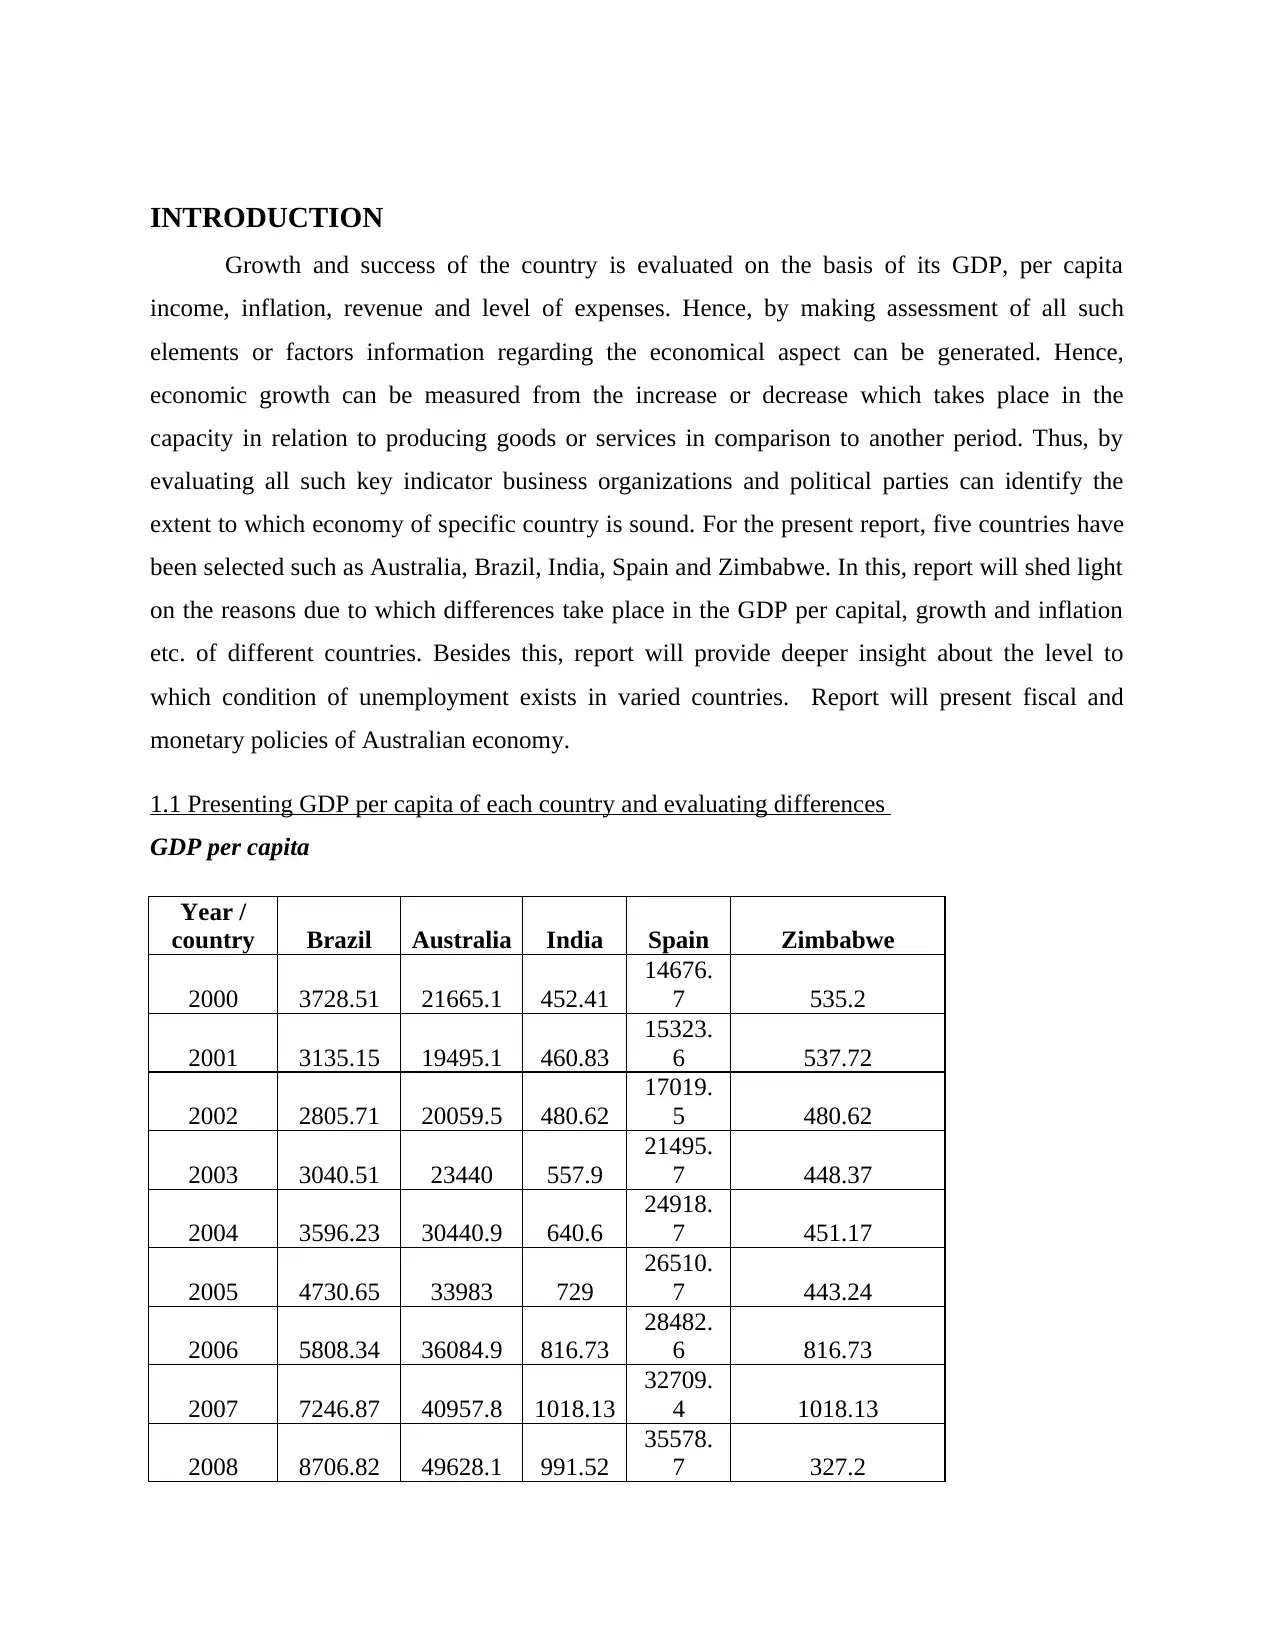
(GDP per capita, 2017)
The above depicted table or graph shows that GDP per capita of Brazil shows increasing
trend from the year of 2000 to 2013. In the year of 2000, per capita GDP of Brazil was 3728.51,
whereas it reached on 12106.21 at the end of 2013. It shows that that during such accounting
period’s productivity of Brazil increased to the significant level. However, in the year of 2014
and 2015 per capita GDP of Brazil decreased to the significant level. It presents that productivity
32333.
5 1090.36
2010 1121.42 51845.7 1345.72
30737.
8 374.27
2011 13047.2 62216.5 1461.38
31832.
2 768.56
2012 12179.6 67646.1 1446.77
28562.
3 850.83
2013 1210.6.21 67652.7 1451.53
29210.
1 905.5
2014 11917.8 62004.8 1569.94
29600.
5 931.2
2015 8677.77 56290.65 1593.25
25684.
7 924.14
(GDP per capita, 2017)
The above depicted table or graph shows that GDP per capita of Brazil shows increasing
trend from the year of 2000 to 2013. In the year of 2000, per capita GDP of Brazil was 3728.51,
whereas it reached on 12106.21 at the end of 2013. It shows that that during such accounting
period’s productivity of Brazil increased to the significant level. However, in the year of 2014
and 2015 per capita GDP of Brazil decreased to the significant level. It presents that productivity
Paraphrase This Document
Need a fresh take? Get an instant paraphrase of this document with our AI Paraphraser
level of employees affected in a negative manner during the period of 2014 and 2015. On the
other side, GDP per capita of Zimbabwe also shows fluctuating trend in the performance level.
Moreover, in 2015 GDP per capita of Zimbabwe accounts for 924.14 respectively that was high
lower as compared to before years and other countries. From assessment, it has been identified
that GDP per capita of Australia, Spain and India accounts for 56290.65, 25684.7 and 1593.25
respectively in the year of 2015. By considering this, it can be presented that GDP per capita of
Australia was high during the period of 16 years. It clearly shows that employees of Australia
are highly skilled and efficient over others.
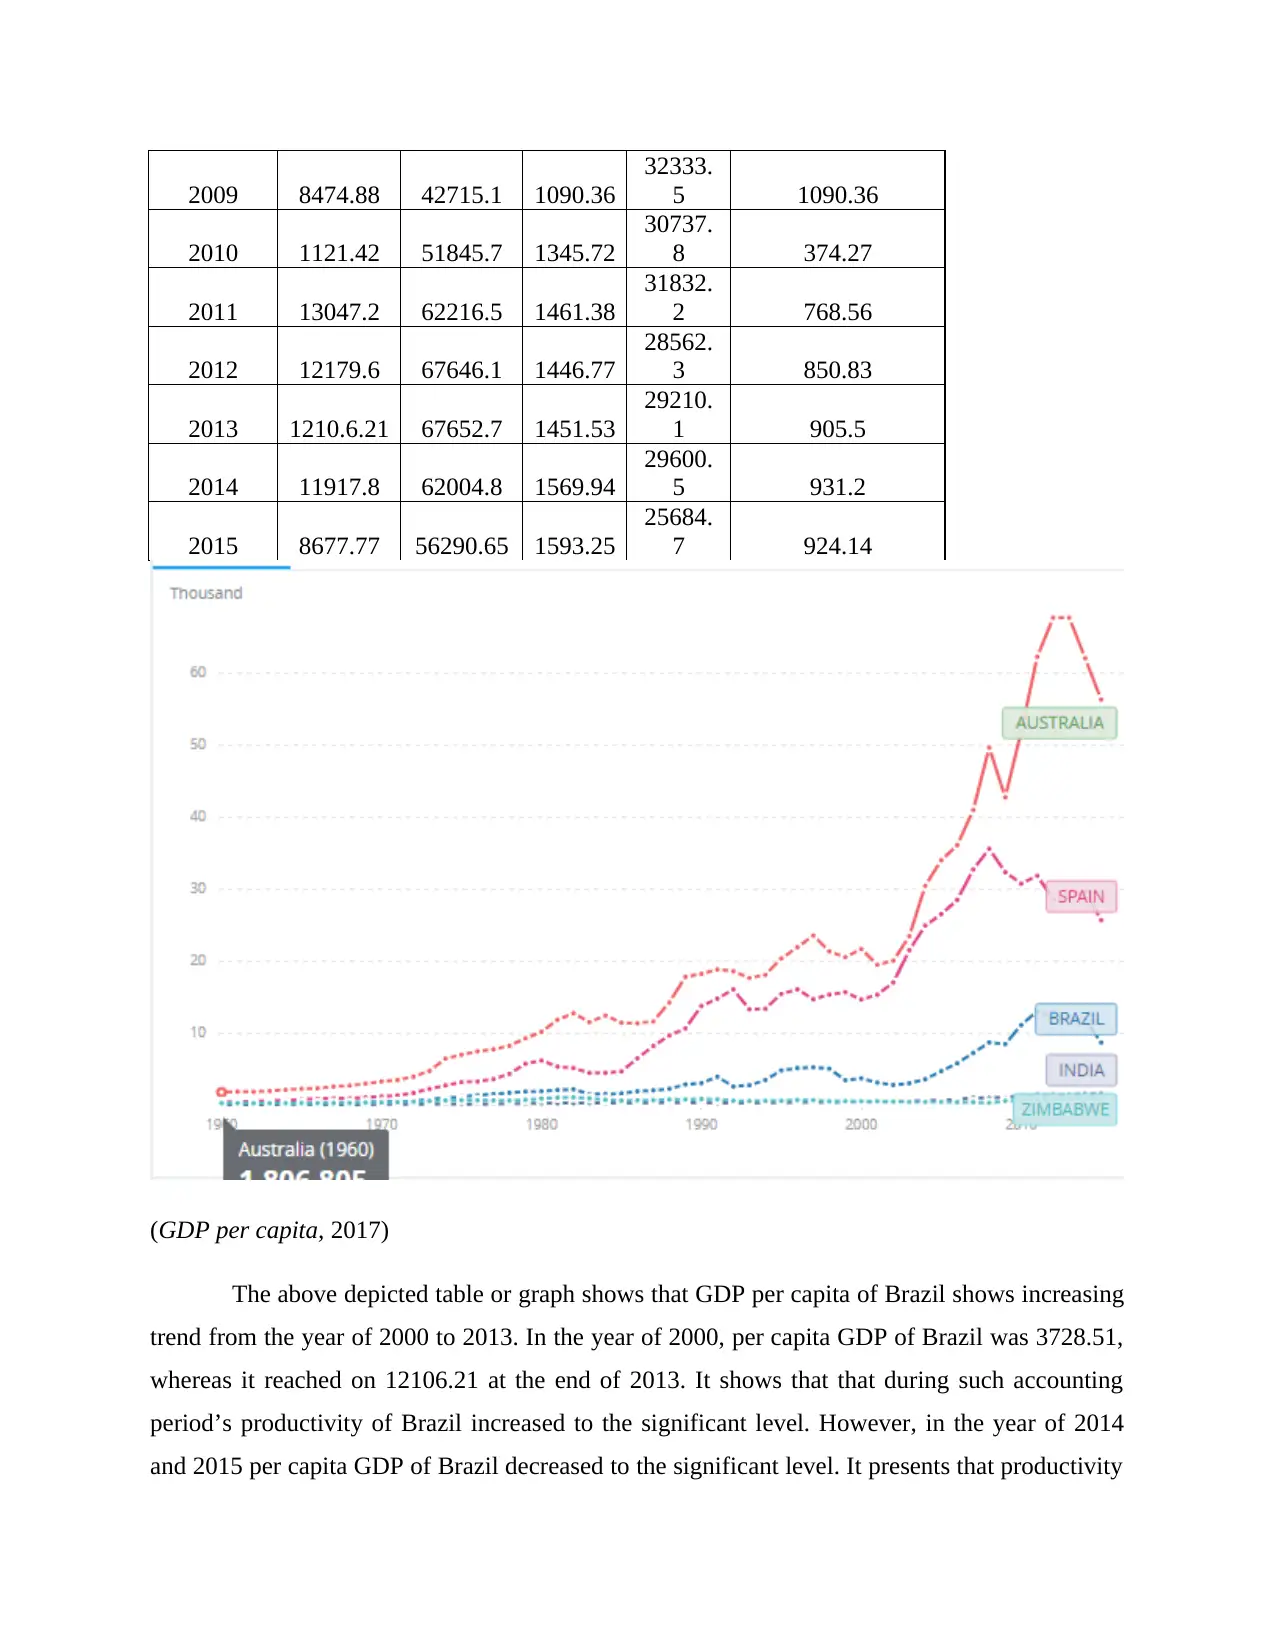
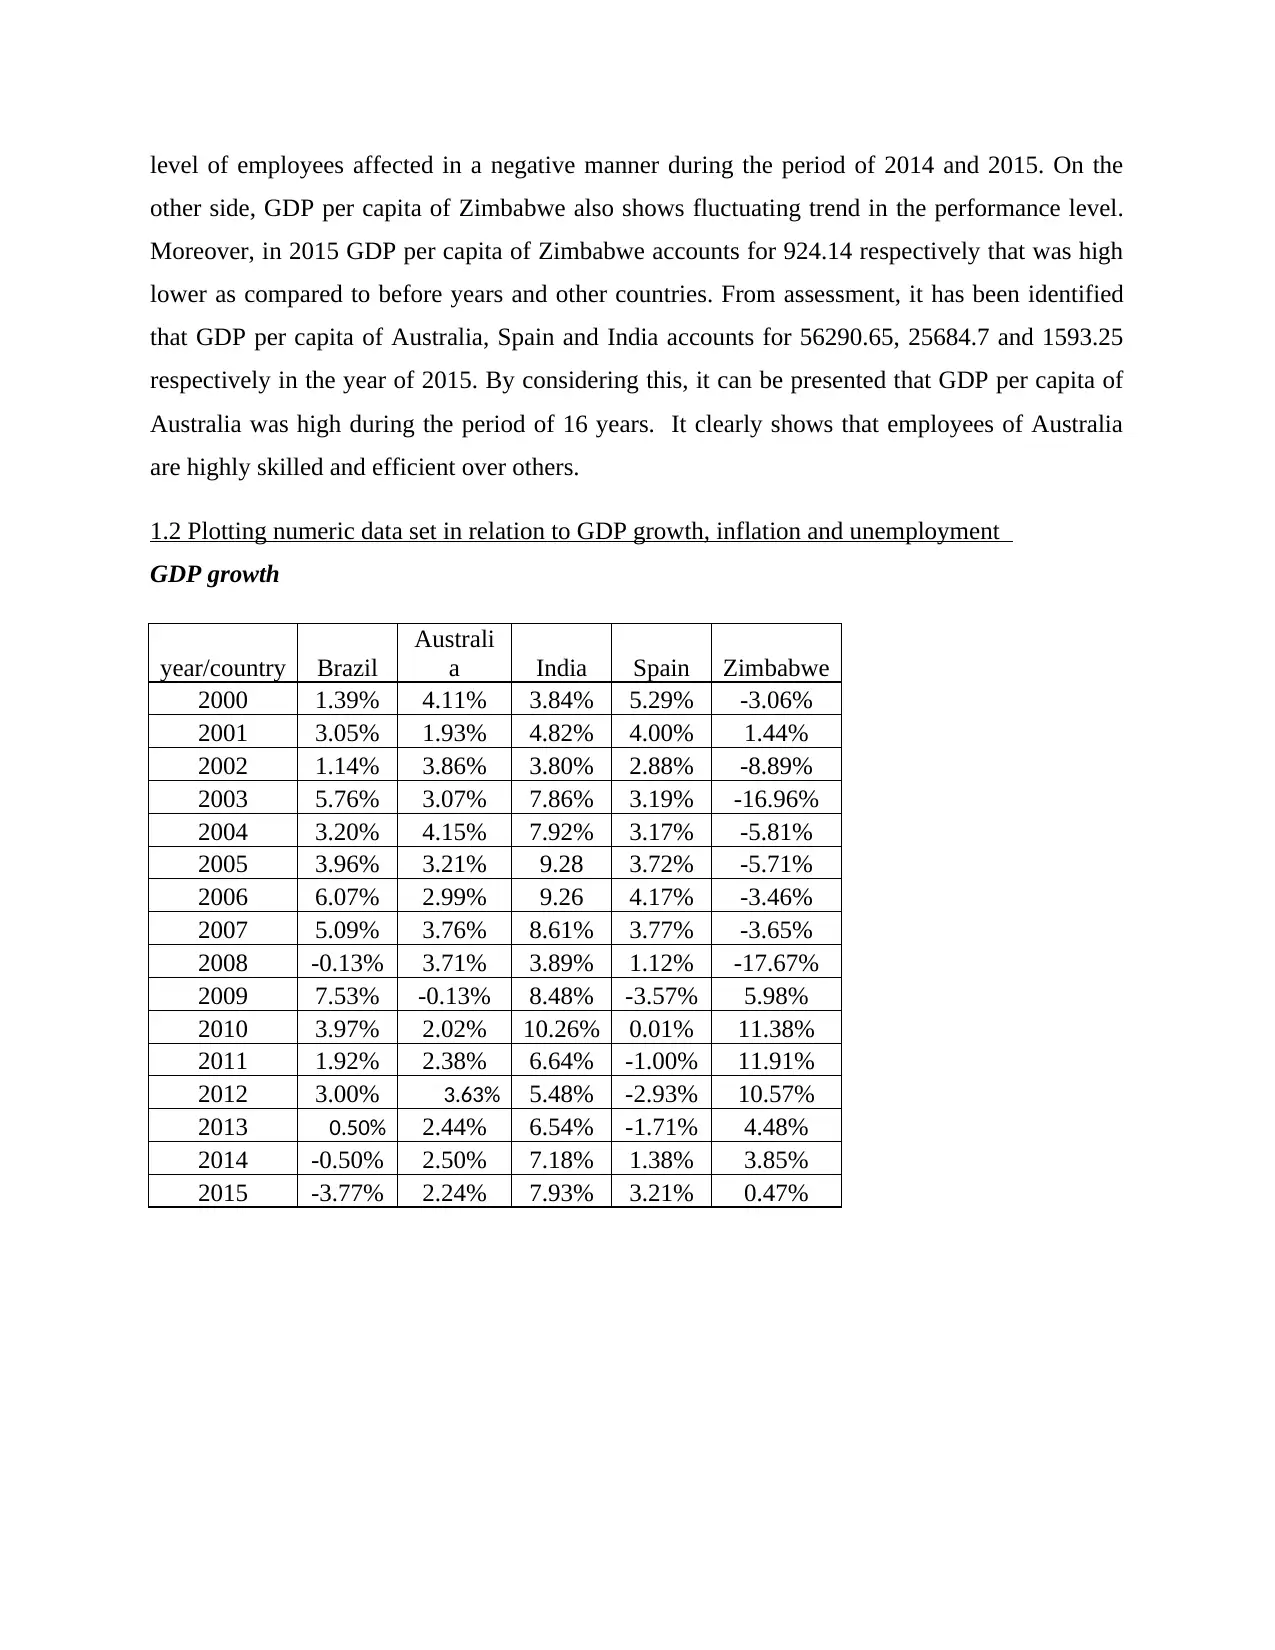
1.2 Plotting numeric data set in relation to GDP growth, inflation and unemployment
GDP growth
year/country Brazil
Australi
a India Spain Zimbabwe
2000 1.39% 4.11% 3.84% 5.29% -3.06%
2001 3.05% 1.93% 4.82% 4.00% 1.44%
2002 1.14% 3.86% 3.80% 2.88% -8.89%
2003 5.76% 3.07% 7.86% 3.19% -16.96%
2004 3.20% 4.15% 7.92% 3.17% -5.81%
2005 3.96% 3.21% 9.28 3.72% -5.71%
2006 6.07% 2.99% 9.26 4.17% -3.46%
2007 5.09% 3.76% 8.61% 3.77% -3.65%
2008 -0.13% 3.71% 3.89% 1.12% -17.67%
2009 7.53% -0.13% 8.48% -3.57% 5.98%
2010 3.97% 2.02% 10.26% 0.01% 11.38%
2011 1.92% 2.38% 6.64% -1.00% 11.91%
2012 3.00% 3.63% 5.48% -2.93% 10.57%
2013 0.50% 2.44% 6.54% -1.71% 4.48%
2014 -0.50% 2.50% 7.18% 1.38% 3.85%
2015 -3.77% 2.24% 7.93% 3.21% 0.47%
other side, GDP per capita of Zimbabwe also shows fluctuating trend in the performance level.
Moreover, in 2015 GDP per capita of Zimbabwe accounts for 924.14 respectively that was high
lower as compared to before years and other countries. From assessment, it has been identified
that GDP per capita of Australia, Spain and India accounts for 56290.65, 25684.7 and 1593.25
respectively in the year of 2015. By considering this, it can be presented that GDP per capita of
Australia was high during the period of 16 years. It clearly shows that employees of Australia
are highly skilled and efficient over others.
1.2 Plotting numeric data set in relation to GDP growth, inflation and unemployment
GDP growth
year/country Brazil
Australi
a India Spain Zimbabwe
2000 1.39% 4.11% 3.84% 5.29% -3.06%
2001 3.05% 1.93% 4.82% 4.00% 1.44%
2002 1.14% 3.86% 3.80% 2.88% -8.89%
2003 5.76% 3.07% 7.86% 3.19% -16.96%
2004 3.20% 4.15% 7.92% 3.17% -5.81%
2005 3.96% 3.21% 9.28 3.72% -5.71%
2006 6.07% 2.99% 9.26 4.17% -3.46%
2007 5.09% 3.76% 8.61% 3.77% -3.65%
2008 -0.13% 3.71% 3.89% 1.12% -17.67%
2009 7.53% -0.13% 8.48% -3.57% 5.98%
2010 3.97% 2.02% 10.26% 0.01% 11.38%
2011 1.92% 2.38% 6.64% -1.00% 11.91%
2012 3.00% 3.63% 5.48% -2.93% 10.57%
2013 0.50% 2.44% 6.54% -1.71% 4.48%
2014 -0.50% 2.50% 7.18% 1.38% 3.85%
2015 -3.77% 2.24% 7.93% 3.21% 0.47%
2000
2002
2004
2006
2008
2010
2012
2014
-200.00%
0.00%
200.00%
400.00%
600.00%
800.00%
1000.00%
Brazil
Australia
India
Spain
Zimbabwe
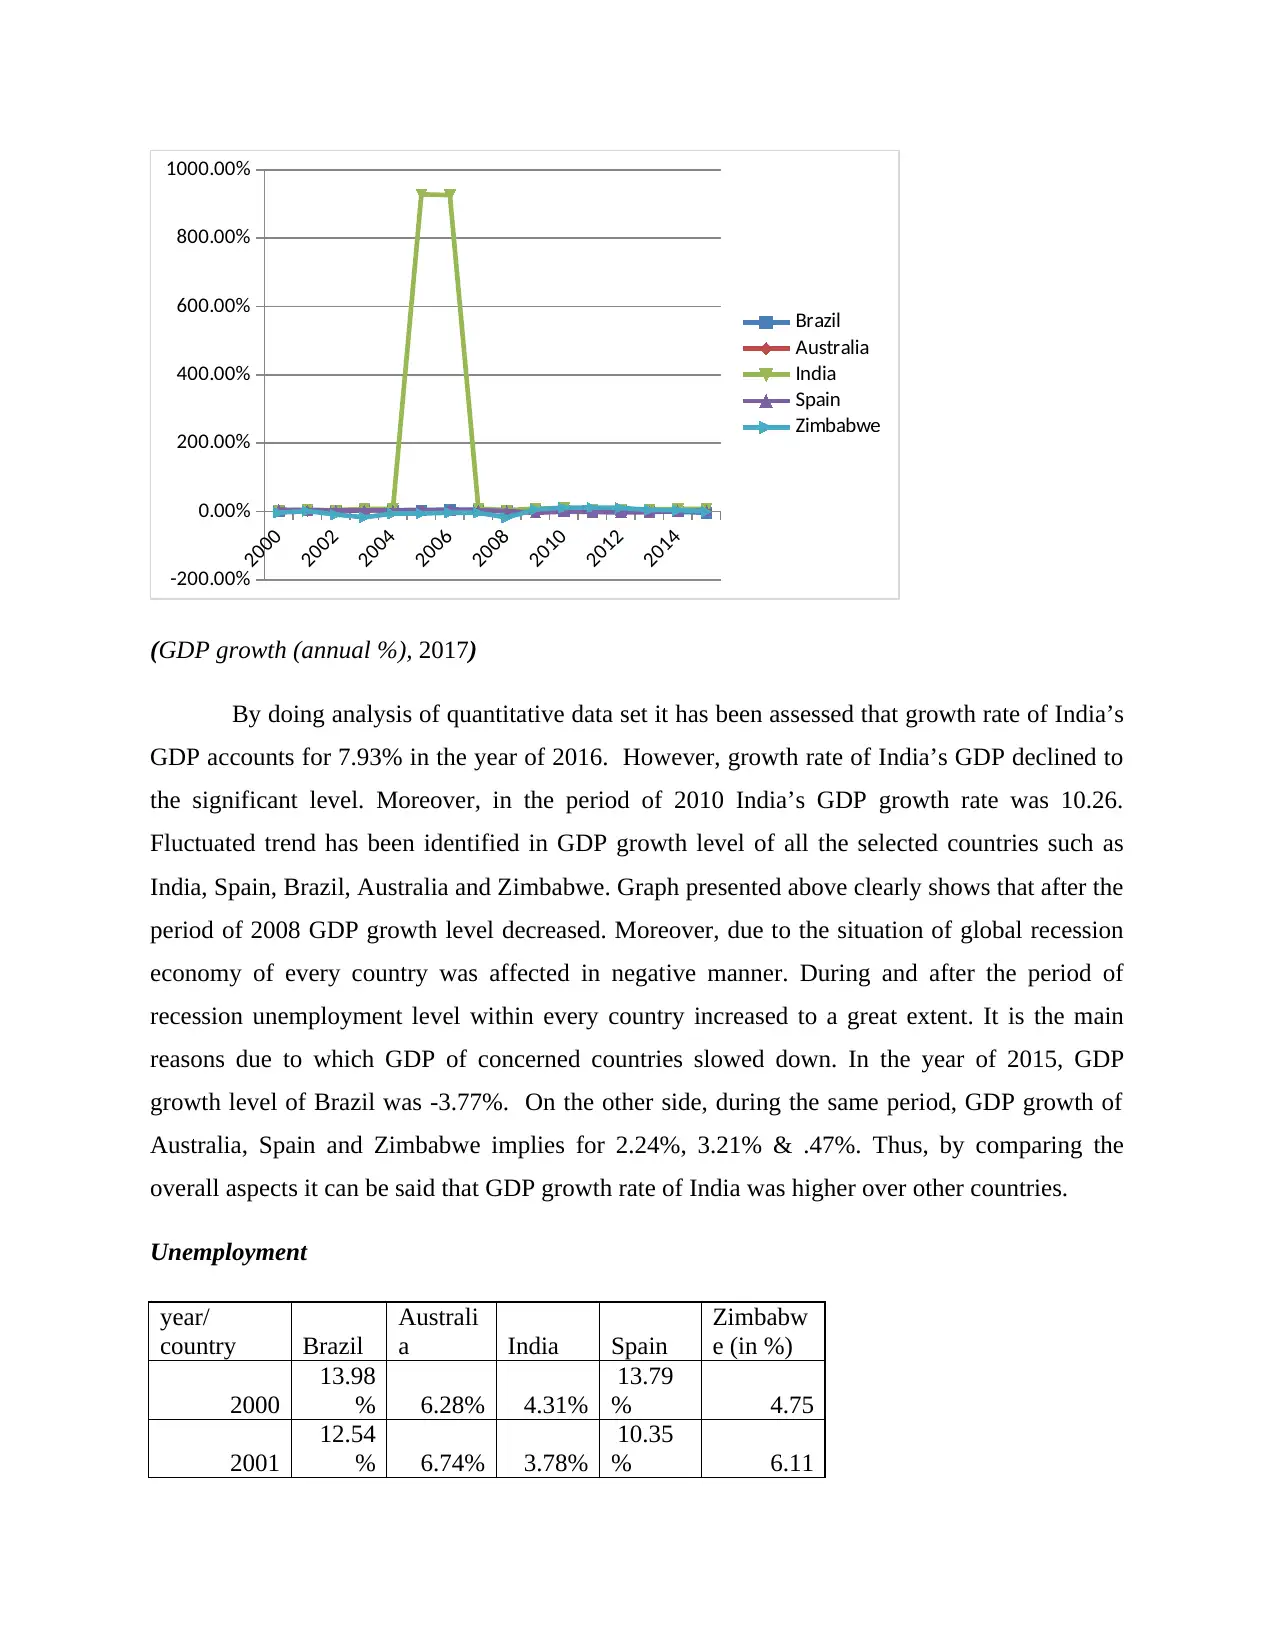
(GDP growth (annual %), 2017)
By doing analysis of quantitative data set it has been assessed that growth rate of India’s
GDP accounts for 7.93% in the year of 2016. However, growth rate of India’s GDP declined to
the significant level. Moreover, in the period of 2010 India’s GDP growth rate was 10.26.
Fluctuated trend has been identified in GDP growth level of all the selected countries such as
India, Spain, Brazil, Australia and Zimbabwe. Graph presented above clearly shows that after the
period of 2008 GDP growth level decreased. Moreover, due to the situation of global recession
economy of every country was affected in negative manner. During and after the period of
recession unemployment level within every country increased to a great extent. It is the main
reasons due to which GDP of concerned countries slowed down. In the year of 2015, GDP
growth level of Brazil was -3.77%. On the other side, during the same period, GDP growth of
Australia, Spain and Zimbabwe implies for 2.24%, 3.21% & .47%. Thus, by comparing the
overall aspects it can be said that GDP growth rate of India was higher over other countries.
Unemployment
year/
country Brazil
Australi
a India Spain
Zimbabw
e (in %)
2000
13.98
% 6.28% 4.31%
13.79
% 4.75
2001
12.54
% 6.74% 3.78%
10.35
% 6.11
2002
2004
2006
2008
2010
2012
2014
-200.00%
0.00%
200.00%
400.00%
600.00%
800.00%
1000.00%
Brazil
Australia
India
Spain
Zimbabwe
(GDP growth (annual %), 2017)
By doing analysis of quantitative data set it has been assessed that growth rate of India’s
GDP accounts for 7.93% in the year of 2016. However, growth rate of India’s GDP declined to
the significant level. Moreover, in the period of 2010 India’s GDP growth rate was 10.26.
Fluctuated trend has been identified in GDP growth level of all the selected countries such as
India, Spain, Brazil, Australia and Zimbabwe. Graph presented above clearly shows that after the
period of 2008 GDP growth level decreased. Moreover, due to the situation of global recession
economy of every country was affected in negative manner. During and after the period of
recession unemployment level within every country increased to a great extent. It is the main
reasons due to which GDP of concerned countries slowed down. In the year of 2015, GDP
growth level of Brazil was -3.77%. On the other side, during the same period, GDP growth of
Australia, Spain and Zimbabwe implies for 2.24%, 3.21% & .47%. Thus, by comparing the
overall aspects it can be said that GDP growth rate of India was higher over other countries.
Unemployment
year/
country Brazil
Australi
a India Spain
Zimbabw
e (in %)
2000
13.98
% 6.28% 4.31%
13.79
% 4.75
2001
12.54
% 6.74% 3.78%
10.35
% 6.11
⊘ This is a preview!⊘
Do you want full access?
Subscribe today to unlock all pages.
Trusted by 1+ million students worldwide
2002
13.04
% 6.37% 4.32%
11.15
% 5.26
2003
13.68
% 5.39% 3.93%
11.28
% 4.53
2004
12.87
% 5.40% 3.89%
11.09
% 4.17
2005
11.37
% 5.03% 4.40% 9.15% 4.85
2006
11.49
% 4.78% 4.33% 8.45% 5.68
2007
10.86
% 4.38%
3.72%
% 8.23% 5.53
2008 9.57% 4.23%
4.15%
%
11.26
% 5.43
2009 9.73% 5.56% 3.91%
17.86
% 5.47
2010 8.49% 5.21%% 3.55%
19.86
% 6.26
2011 7.78% 5.08%% 3.54%
21.39
% 5.37
2012 7.35% 5.22%% 3.62%
24.79
% 5.30
2013 7.13% 5.66%% 3.58% 26.09% 5.18
2014 6.81% 6.07%% 3.53%
24.44
% 5.13
2015 8.52% 6.06% 3.49%
22.06
% 5.11
2016 11.45 5.74%% 3.46%
19.45
% 5.09
2000
2002
2004
2006
2008
2010
2012
2014
2016
0.00%
200.00%
400.00%
600.00%
800.00%
1000.00%
1200.00%
1400.00%
Brazil
Australia
India
Spain
Zimbabwe
Paraphrase This Document
Need a fresh take? Get an instant paraphrase of this document with our AI Paraphraser
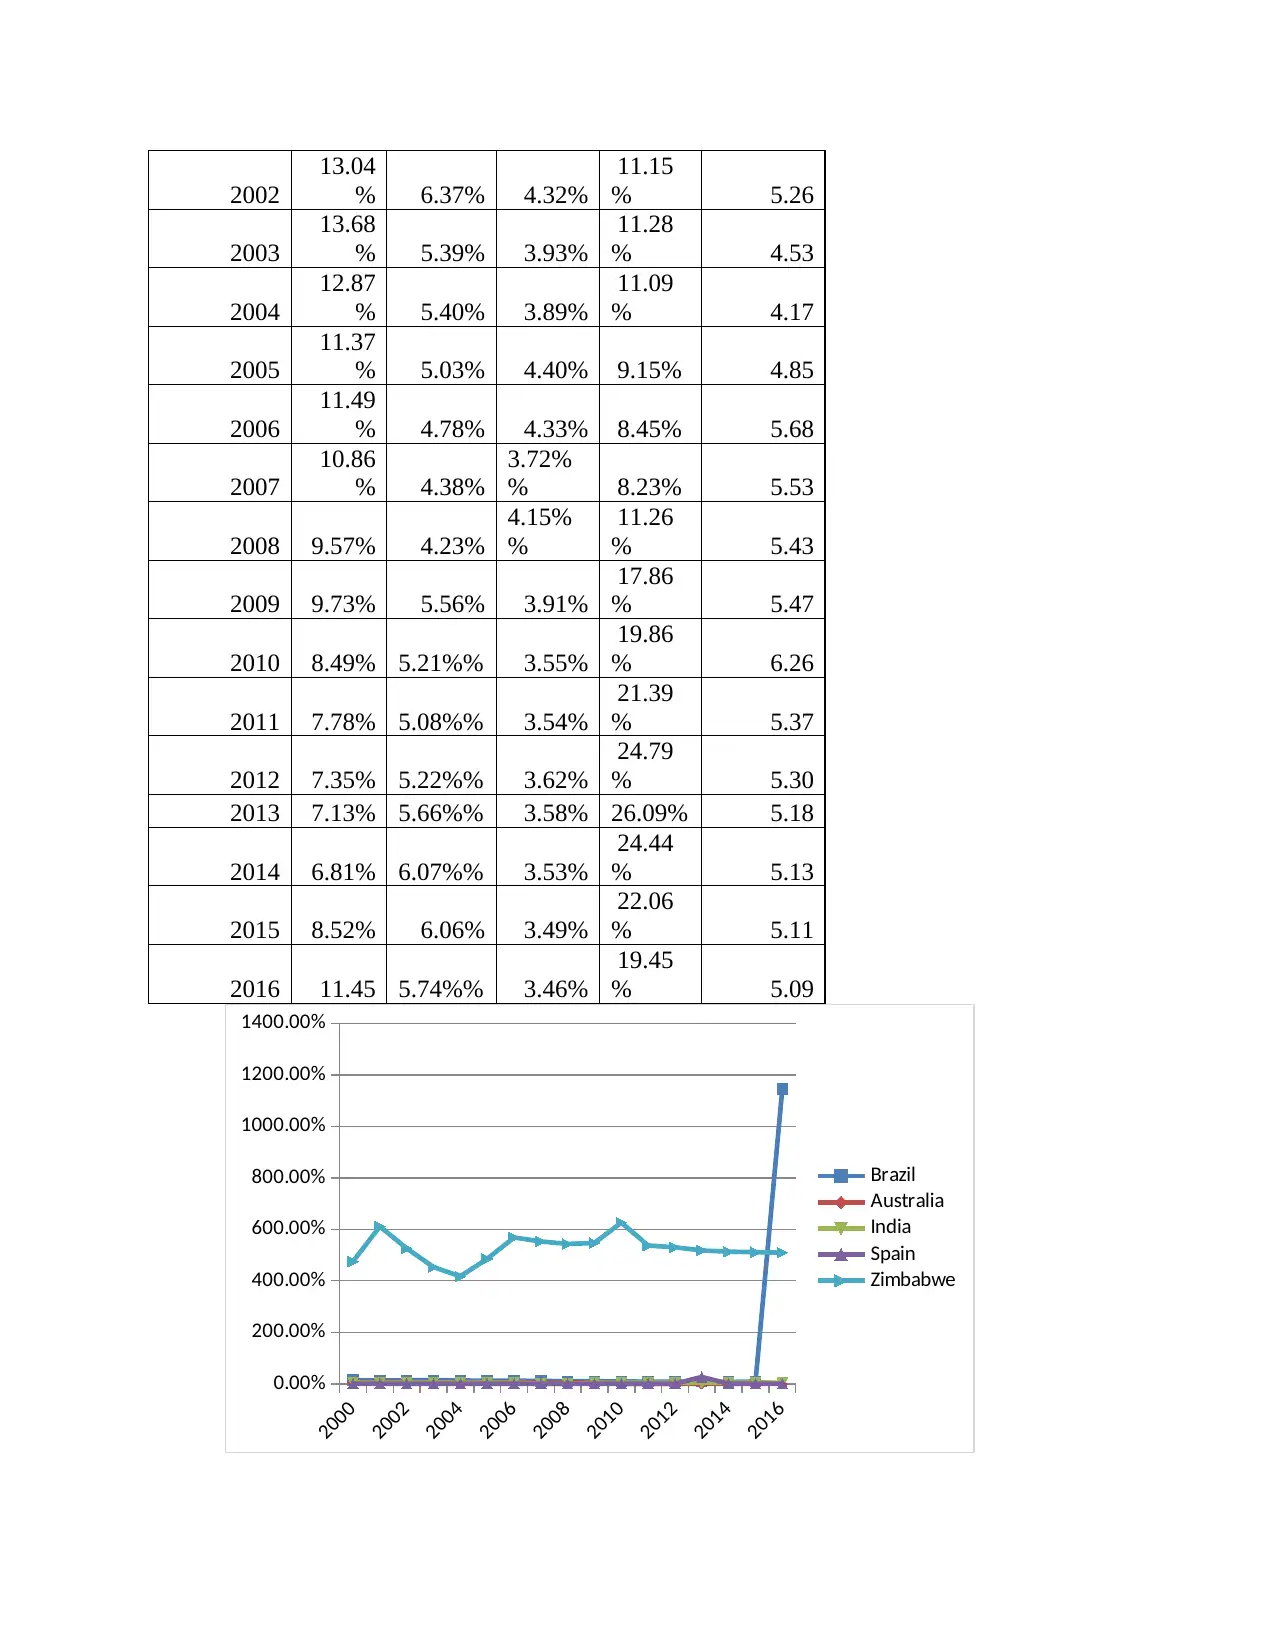
The above mentioned table shows that level of unemployment shows decreasing trend
during 17 years from 4.31% to 3.46%. Graph presents that unemployment level in Australia,
Spain, Brazil and Zimbabwe was fluctuated from 2000 to 2016. During the year of 2016,
unemployment level in Australia, Brazil, Spain and Zimbabwe accounts for 5.74%, 11.45%,
19.45% and 5.09%. Thus, it can be stated that in 2016 unemployment level in Spain and Brazil
was high such as 19.45% & 11.455% significantly. The main reasons behind the occurrence of
differences are that countries like Spain and Brazil failed to encourage FDI. It is one of the main
factors which has significant impact on employment opportunities within the country and thereby
level of unemployment.
Inflation
Year/
countr
y
Australi
a Brazil India
Zimbabw
e Spain
2000 4.47518 7.0447
4.0094
3 55.8665 3.43
2001 4.38084
6.8378
3
3.6848
1 76.7073 3.59
2002 3.00317
8.4502
2 4.3922 140.06 3.07
2003 2.77074
14.715
3
3.8058
7 431.7 3.04
2004 2.34361
6.5991
2
3.7672
4 282.38 3.37
2005 2.66873
6.8673
5
4.2463
5 302.117 3.52
2006 3.53849
4.1836
8
6.1455
2 1096.68 3.52
2007 2.33236
3.6370
3 6.37 24411 2.79
2008 4.35264 5.6631
8.3518
2 0 4.08
2009 1.82011
4.8864
1
10.877
4 0 -.29
2010 2.84523
5.0383
2
11.992
3 3.03448 1.8
2011 3.30385 6.6362
8.8578
5 3.27751 3.20
2012 1.76278
5.4019
6
9.3124
5 3.92224 2.45
2013 2.44989 6.2019
10.907
6 1.63162 1.41
2014 2.48792
6.3320
9 6.6495 -0.2173 -.15
2015 1.50837 9.0276
4.9069
7 -2.3987 -.5
2000
2001
2002
2003
2004
2005
2006
2007
2008
2009
2010
2011
2012
2013
2014
2015
-5000
0
5000
10000
15000
20000
25000
30000
Australia
Brazil
India
Zimbabwe
Spain
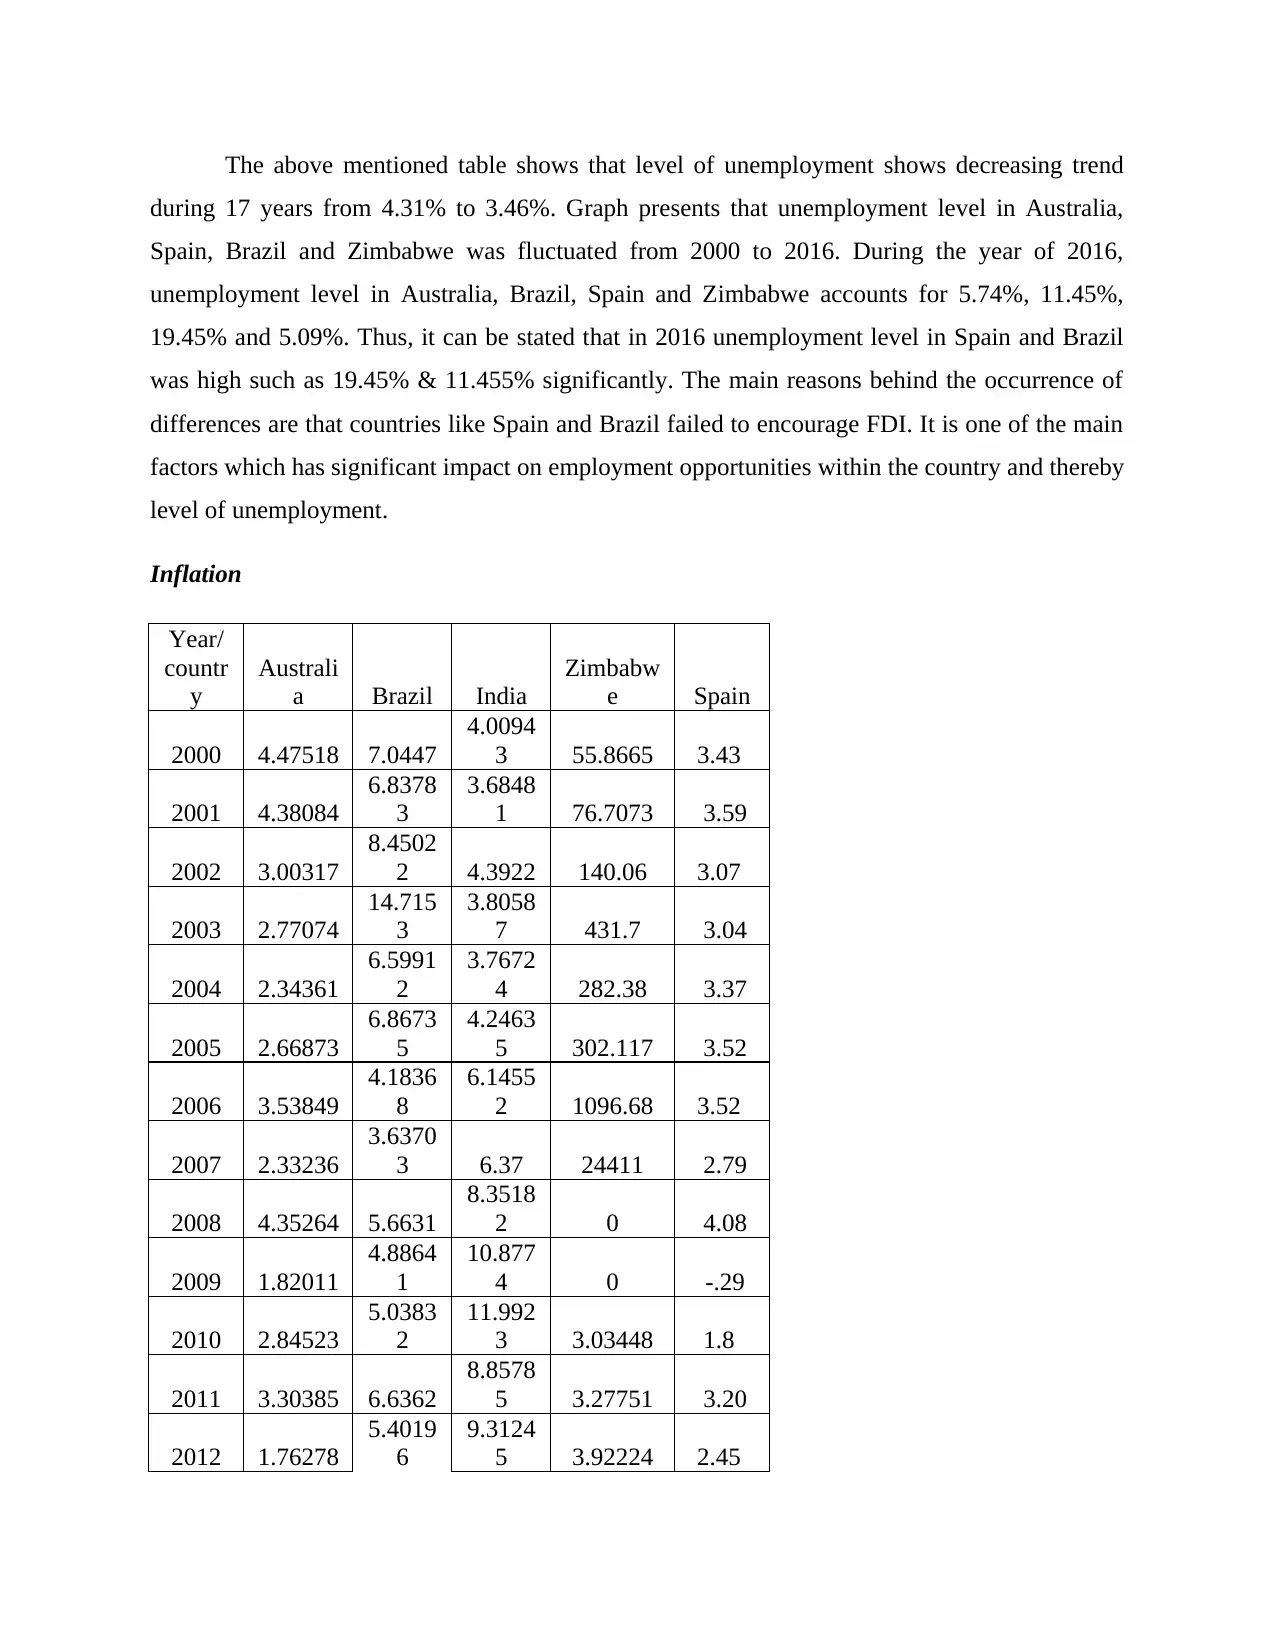
Data gathered through World Bank clearly shows that inflation, consumer price annual %
of Spain and Zimbabwe decreased to a great extent. In the year of 2015, inflation, consumer
price index of Spain and Zimbabwe was -.5% and -2.40%. Further, such measure of Australia,
Brazil and India was 1.51%, 9.03% & 4.91% respectively. Thus, by taking into account such
aspect it can be stated that high level of changes take place in the prices of products or services
offered by Spain and Zimbabwe to customers. There are mainly two indicators which present
economic growth as well as success such as inflation and deflation. During the period of
inflation, purchasing power of customers increases to the significant level and vice versa
(Ghysels, 2016). Thus, it can be said that economic condition of Australia, Brazil and India was
good from the year of 2000 to 2015 as compared to others.
1.3 Stating the graph of government expenses and revenue
Government revenue
Year/
country Australia Brazil India Spain
10.907
6 1.63162 1.41
2014 2.48792
6.3320
9 6.6495 -0.2173 -.15
2015 1.50837 9.0276
4.9069
7 -2.3987 -.5
2000
2001
2002
2003
2004
2005
2006
2007
2008
2009
2010
2011
2012
2013
2014
2015
-5000
0
5000
10000
15000
20000
25000
30000
Australia
Brazil
India
Zimbabwe
Spain
Data gathered through World Bank clearly shows that inflation, consumer price annual %
of Spain and Zimbabwe decreased to a great extent. In the year of 2015, inflation, consumer
price index of Spain and Zimbabwe was -.5% and -2.40%. Further, such measure of Australia,
Brazil and India was 1.51%, 9.03% & 4.91% respectively. Thus, by taking into account such
aspect it can be stated that high level of changes take place in the prices of products or services
offered by Spain and Zimbabwe to customers. There are mainly two indicators which present
economic growth as well as success such as inflation and deflation. During the period of
inflation, purchasing power of customers increases to the significant level and vice versa
(Ghysels, 2016). Thus, it can be said that economic condition of Australia, Brazil and India was
good from the year of 2000 to 2015 as compared to others.
1.3 Stating the graph of government expenses and revenue
Government revenue
Year/
country Australia Brazil India Spain
⊘ This is a preview!⊘
Do you want full access?
Subscribe today to unlock all pages.
Trusted by 1+ million students worldwide
2000 25.9597 19.5546
11.501
7 16.23
2001 27.0589 20.5098
10.849
8 15.86
2002 26.0239 21.4601
11.394
3 15.00
2003 26.6608 20.6974
11.648
8 14.62
2004 26.6016 21.3622
11.874
7 14.96
2005 27.0792 22.4239
12.130
6 15.65
2006 26.9775 25.6878
13.192
5 16.11
2007 26.4311 25.7507
14.627
9 16.70
2008 26.5961 27.0092
12.888
5 13.25
2009 24.5017 23.9756
11.575
5 10.99
2010 23.3806 28.7504
13.335
2 12.98
2011 22.7888 28.8551
11.496
4 12.47
2012 23.6559 29.1027
12.596
6 12.23
2013 24.623 28.1846
12.605
5 14
2014 24.6154 26.8632 0 14.26
2015 24.6903 28.8096 0 14.48
2000
2001
2002
2003
2004
2005
2006
2007
2008
2009
2010
2011
2012
2013
2014
2015
0
5
10
15
20
25
30
35
Australia
Brazil
India
Spain
Paraphrase This Document
Need a fresh take? Get an instant paraphrase of this document with our AI Paraphraser
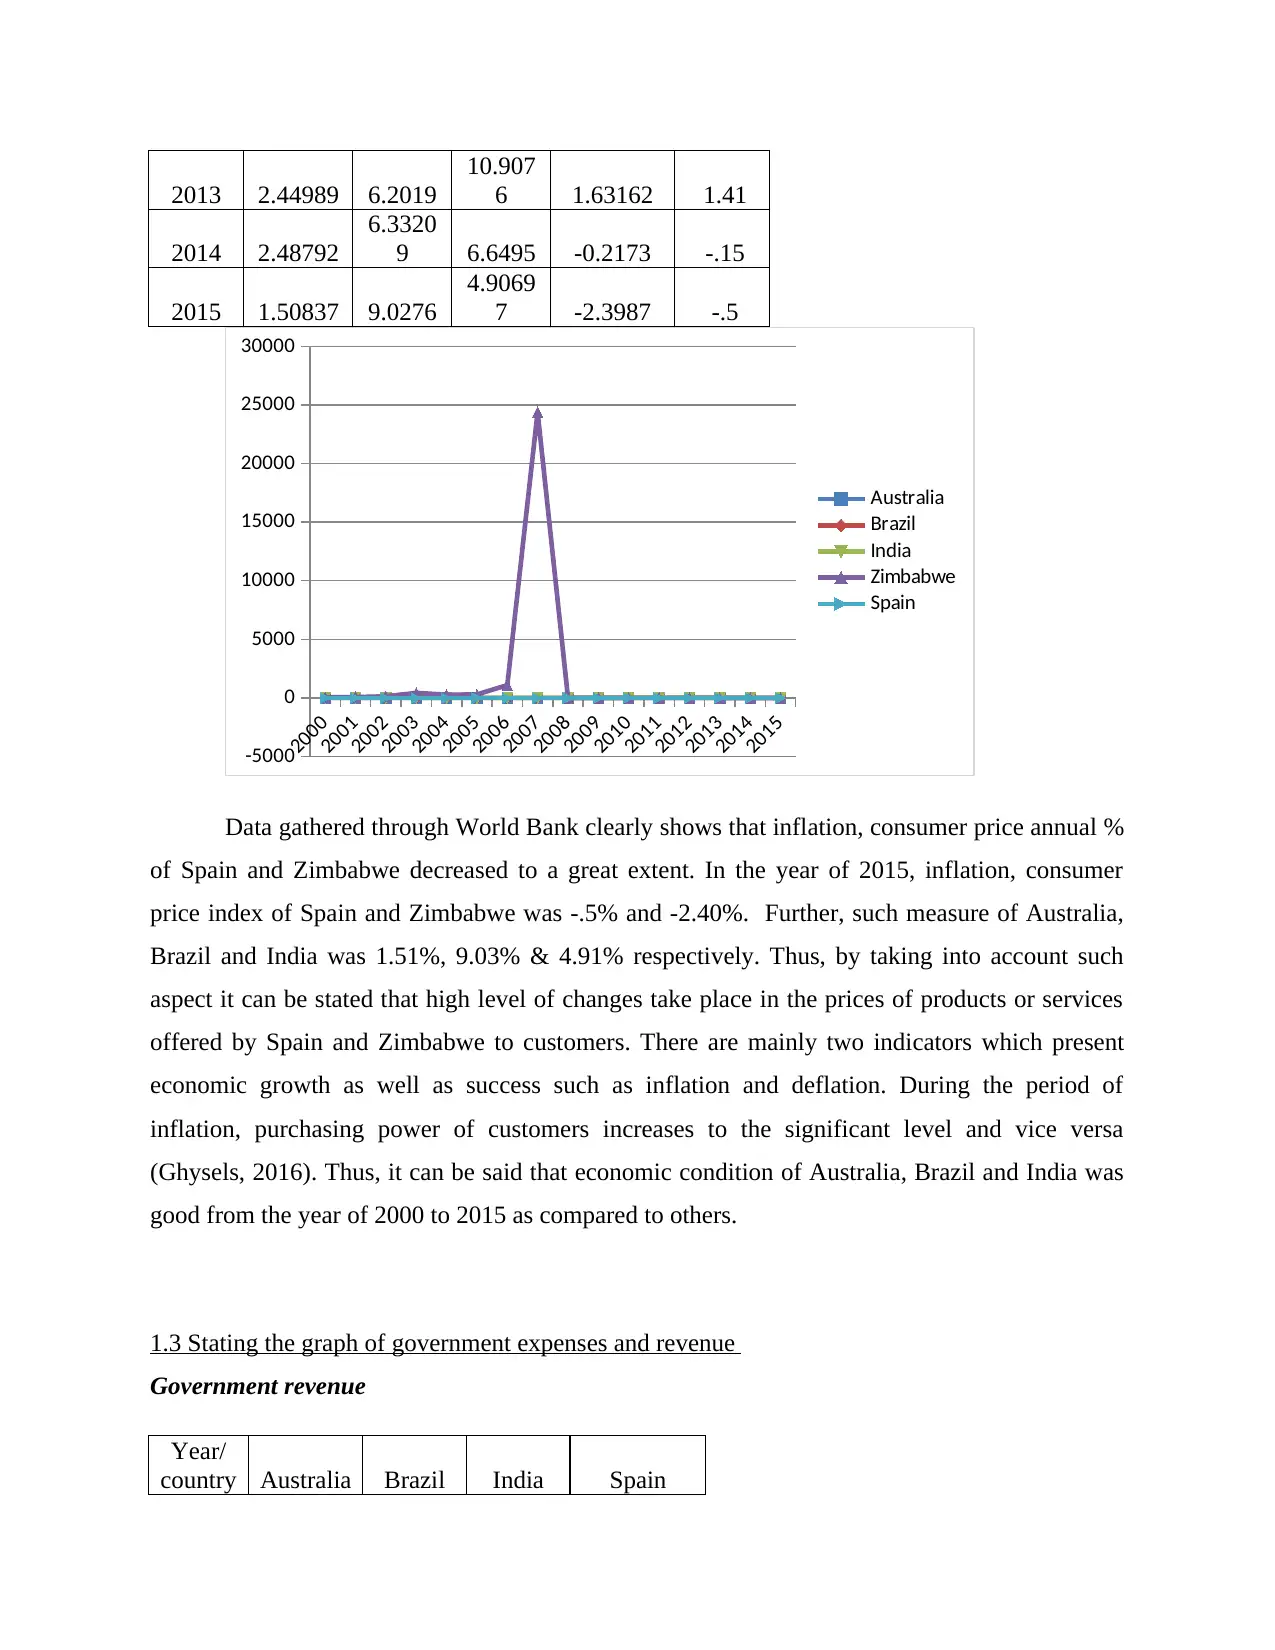
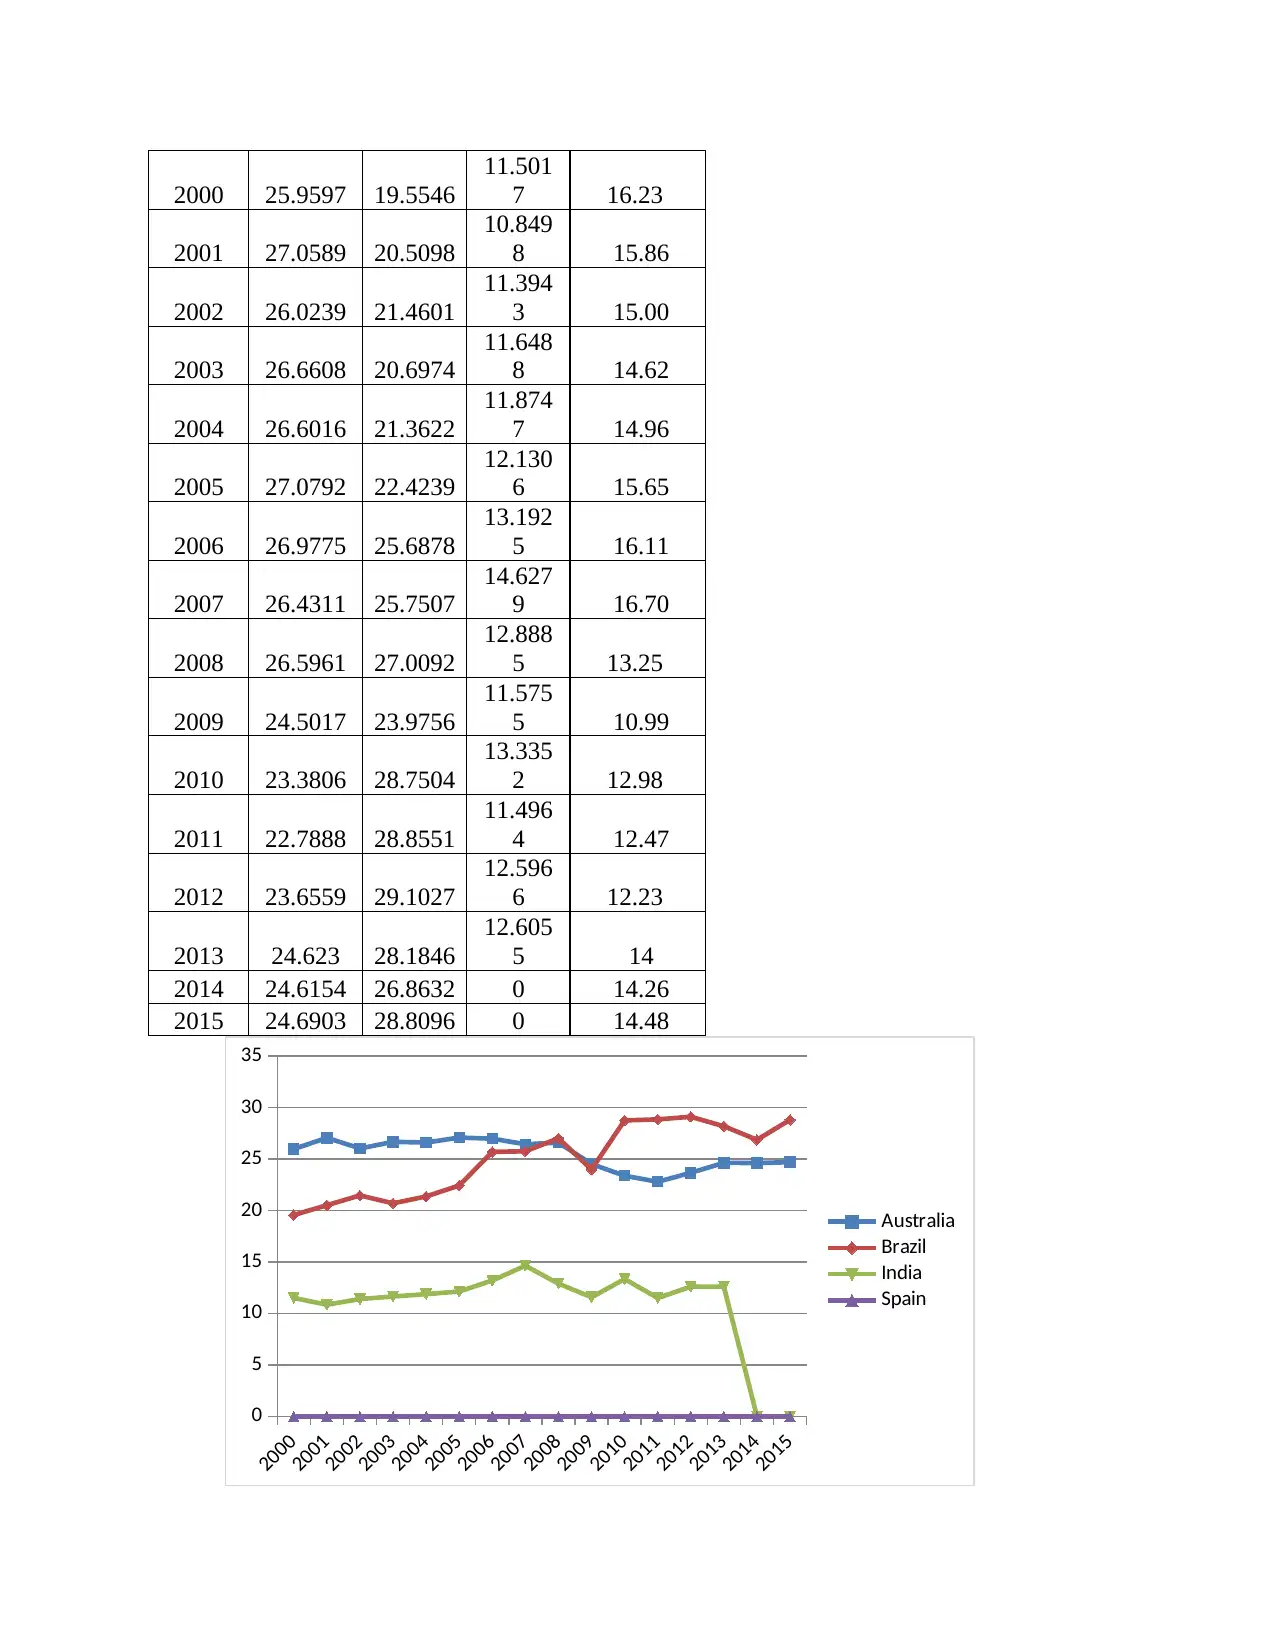
Gathered data set shows that government revenue in relation to % of GDP shows that
both Brazil and Australia has attained leading position. Moreover, above drafted table shows that
contribution which is made by government of Australia and Brazil in GDP was higher. Tax
revenue in terms of % of GDP related to India accounts for 0 in the year of 2014 and 2015.
Along with this, contribution made by Indian government lies within the range of 10% to 12%
which was lower as compared to other countries. Further, Spain’s revenue in GDP level accounts
for 14.48%.
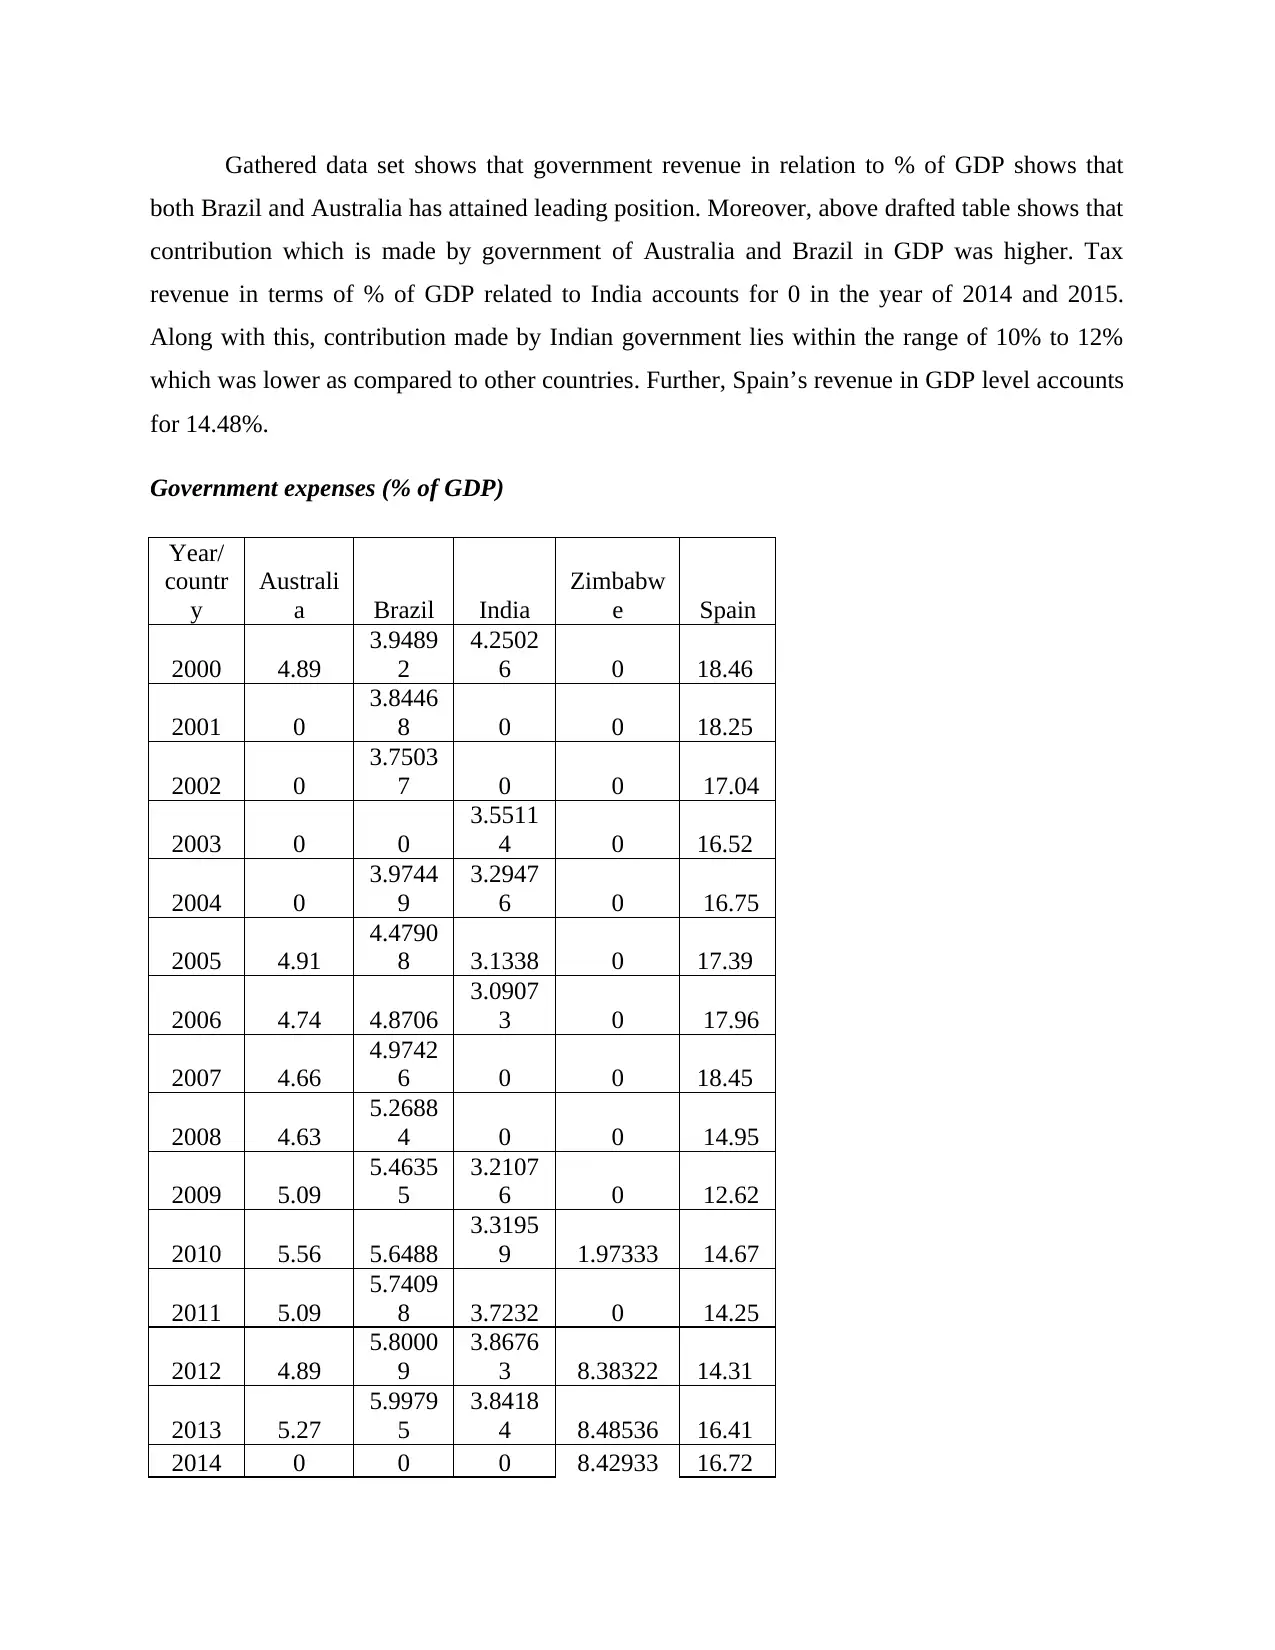
Government expenses (% of GDP)
Year/
countr
y
Australi
a Brazil India
Zimbabw
e Spain
2000 4.89
3.9489
2
4.2502
6 0 18.46
2001 0
3.8446
8 0 0 18.25
2002 0
3.7503
7 0 0 17.04
2003 0 0
3.5511
4 0 16.52
2004 0
3.9744
9
3.2947
6 0 16.75
2005 4.91
4.4790
8 3.1338 0 17.39
2006 4.74 4.8706
3.0907
3 0 17.96
2007 4.66
4.9742
6 0 0 18.45
2008 4.63
5.2688
4 0 0 14.95
2009 5.09
5.4635
5
3.2107
6 0 12.62
2010 5.56 5.6488
3.3195
9 1.97333 14.67
2011 5.09
5.7409
8 3.7232 0 14.25
2012 4.89
5.8000
9
3.8676
3 8.38322 14.31
2013 5.27
5.9979
5
3.8418
4 8.48536 16.41
2014 0 0 0 8.42933 16.72
both Brazil and Australia has attained leading position. Moreover, above drafted table shows that
contribution which is made by government of Australia and Brazil in GDP was higher. Tax
revenue in terms of % of GDP related to India accounts for 0 in the year of 2014 and 2015.
Along with this, contribution made by Indian government lies within the range of 10% to 12%
which was lower as compared to other countries. Further, Spain’s revenue in GDP level accounts
for 14.48%.
Government expenses (% of GDP)
Year/
countr
y
Australi
a Brazil India
Zimbabw
e Spain
2000 4.89
3.9489
2
4.2502
6 0 18.46
2001 0
3.8446
8 0 0 18.25
2002 0
3.7503
7 0 0 17.04
2003 0 0
3.5511
4 0 16.52
2004 0
3.9744
9
3.2947
6 0 16.75
2005 4.91
4.4790
8 3.1338 0 17.39
2006 4.74 4.8706
3.0907
3 0 17.96
2007 4.66
4.9742
6 0 0 18.45
2008 4.63
5.2688
4 0 0 14.95
2009 5.09
5.4635
5
3.2107
6 0 12.62
2010 5.56 5.6488
3.3195
9 1.97333 14.67
2011 5.09
5.7409
8 3.7232 0 14.25
2012 4.89
5.8000
9
3.8676
3 8.38322 14.31
2013 5.27
5.9979
5
3.8418
4 8.48536 16.41
2014 0 0 0 8.42933 16.72
2015 0 0 0 0 16.38
2000
2001
2002
2003
2004
2005
2006
2007
2008
2009
2010
2011
2012
2013
2014
2015
0
1
2
3
4
5
6
7
8
9
Australia
Brazil
India
Zimbabwe
Spain
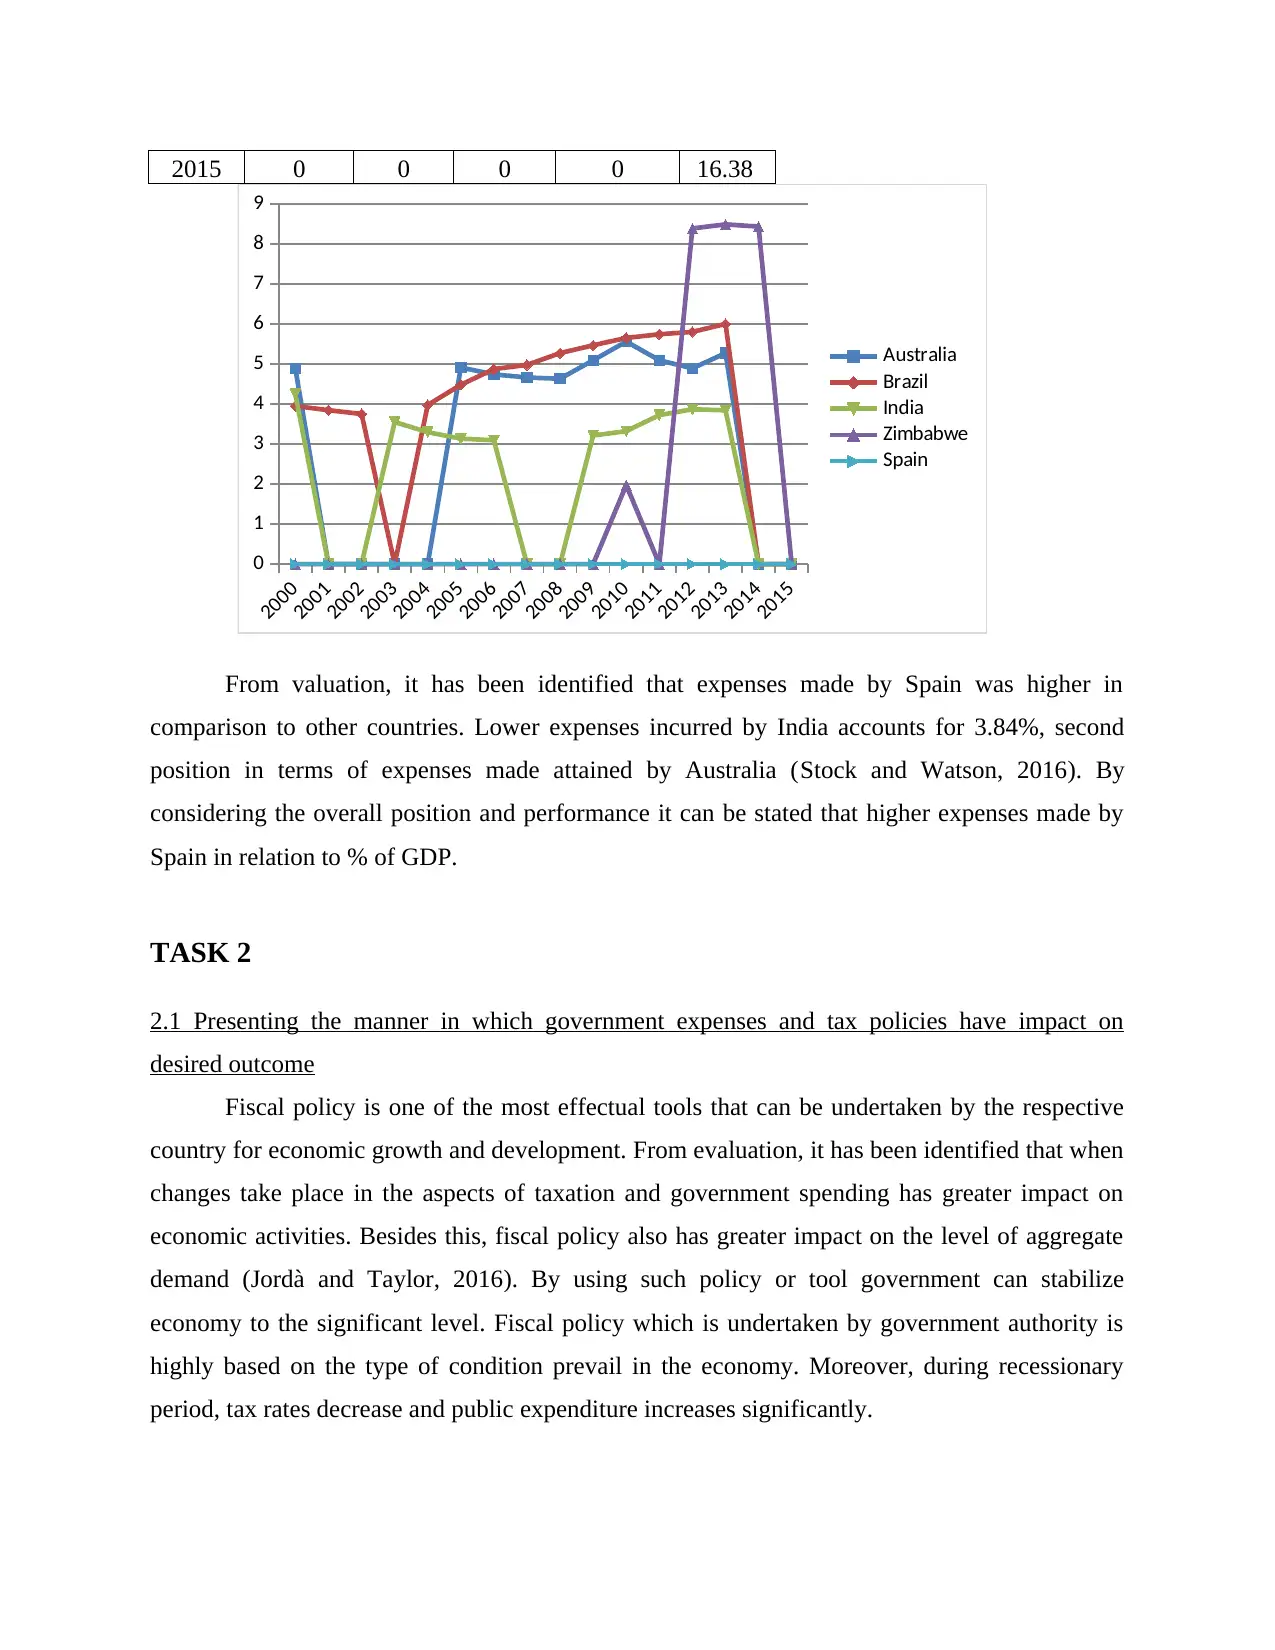
From valuation, it has been identified that expenses made by Spain was higher in
comparison to other countries. Lower expenses incurred by India accounts for 3.84%, second
position in terms of expenses made attained by Australia (Stock and Watson, 2016). By
considering the overall position and performance it can be stated that higher expenses made by
Spain in relation to % of GDP.
TASK 2
2.1 Presenting the manner in which government expenses and tax policies have impact on
desired outcome
Fiscal policy is one of the most effectual tools that can be undertaken by the respective
country for economic growth and development. From evaluation, it has been identified that when
changes take place in the aspects of taxation and government spending has greater impact on
economic activities. Besides this, fiscal policy also has greater impact on the level of aggregate
demand (Jordà and Taylor, 2016). By using such policy or tool government can stabilize
economy to the significant level. Fiscal policy which is undertaken by government authority is
highly based on the type of condition prevail in the economy. Moreover, during recessionary
period, tax rates decrease and public expenditure increases significantly.
2000
2001
2002
2003
2004
2005
2006
2007
2008
2009
2010
2011
2012
2013
2014
2015
0
1
2
3
4
5
6
7
8
9
Australia
Brazil
India
Zimbabwe
Spain
From valuation, it has been identified that expenses made by Spain was higher in
comparison to other countries. Lower expenses incurred by India accounts for 3.84%, second
position in terms of expenses made attained by Australia (Stock and Watson, 2016). By
considering the overall position and performance it can be stated that higher expenses made by
Spain in relation to % of GDP.
TASK 2
2.1 Presenting the manner in which government expenses and tax policies have impact on
desired outcome
Fiscal policy is one of the most effectual tools that can be undertaken by the respective
country for economic growth and development. From evaluation, it has been identified that when
changes take place in the aspects of taxation and government spending has greater impact on
economic activities. Besides this, fiscal policy also has greater impact on the level of aggregate
demand (Jordà and Taylor, 2016). By using such policy or tool government can stabilize
economy to the significant level. Fiscal policy which is undertaken by government authority is
highly based on the type of condition prevail in the economy. Moreover, during recessionary
period, tax rates decrease and public expenditure increases significantly.
⊘ This is a preview!⊘
Do you want full access?
Subscribe today to unlock all pages.
Trusted by 1+ million students worldwide
1 out of 15
Related Documents


Your All-in-One AI-Powered Toolkit for Academic Success.
+13062052269
info@desklib.com
Available 24*7 on WhatsApp / Email
![[object Object]](/_next/static/media/star-bottom.7253800d.svg)
Unlock your academic potential
Copyright © 2020–2026 A2Z Services. All Rights Reserved. Developed and managed by ZUCOL.