Economics Report: Analysis of Indian Economy - GDP, Labour, and Prices
VerifiedAdded on 2020/04/21
|15
|3049
|243
Report
AI Summary
This economics report provides a comprehensive analysis of the Indian economy, focusing on key macroeconomic indicators and trends. It begins with an introduction to the Indian economy, its GDP ranking, and growth prospects, followed by an in-depth examination of GDP growth rates, including real GDP and GDP per capita, with data from 2006 to 2017. The report then delves into labor market analysis, defining unemployment types and exploring the situation in India, followed by a discussion of government measures to achieve full employment. Furthermore, the report investigates price level analysis, examining inflation trends, causes, and government interventions to maintain price stability. The analysis includes figures and data visualizations to support the findings, offering a well-rounded overview of the Indian economic landscape and current challenges.

0Running head: ECONOMICS
Economics
Name of the Student
Name of the University
Authors Note
Course ID
Economics
Name of the Student
Name of the University
Authors Note
Course ID
Paraphrase This Document
Need a fresh take? Get an instant paraphrase of this document with our AI Paraphraser
Running head: ECONOMICS
Table of Contents
Introduction:...............................................................................................................................2
GDP growth rate and Performance Trends of India:.................................................................2
GDP Per capita:..........................................................................................................................4
Real GDP growth rate:...............................................................................................................5
Government measure to achieve production output:.................................................................5
Labour Market Analysis:............................................................................................................6
Definition of Unemployment and types of unemployment:......................................................7
Types of Unemployment in India:.............................................................................................7
Measures to achieve full employment in India are as follows:..................................................8
Price level Analysis:...................................................................................................................9
Inflation trend based on inflation rate:.......................................................................................9
Inflation and causes of inflation:................................................................................................9
Demand pull inflation causes:..................................................................................................10
Cost push Inflation:..................................................................................................................10
Causes of inflation in India:.....................................................................................................10
Government measures to achieve price stability:.....................................................................11
Conclusion:..............................................................................................................................11
Reference List:.........................................................................................................................12
Running head: ECONOMICS
Introduction:
Indian economy is considered as the developing mixed economy and the economy of
India is ranked sixth largest in the world in terms of the nominal GDP and third largest in
terms of the purchasing power parity. India is ranked at 141st place in respect of the per capita
GDP with $1723 and ranked 123rd in terms of the PPP with $6,646 by the year 2016
(Malhotra, 2014). The long term perspective of growth in India is positive because of the
rising population in correspondence to the low dependence ratio with healthy rate of savings
and rate of investment with rising integration in the international economy.
Production output performance analysis:
Real GDP: The real GDP is defined as the macroeconomic measurement of the value of
economic output adjusted with the price changes such as inflation or deflation (Sriram &
Venkatraja, 2014). The adjustment translates the value of money measurement, nominal GDP
into the index for quantity of total output.
Real GDP Growth Rate: The real GDP growth rate can be defined as the rate on which the
GDP of the country changes or grows from one year to another year (Aggarwal, 2015). GDP
represents the value of market of all the goods and services produced in the country during
the specific time period.
Real GDP Per Capita: Real GDP per capita represents the measurement of a nation’s
economic output which accounts for the population (Coale & Hoover, 2015). It divides the
nation’s gross domestic product by the total population. This makes the best measurement of
the nation’s standard of living.
⊘ This is a preview!⊘
Do you want full access?
Subscribe today to unlock all pages.
Trusted by 1+ million students worldwide
Running head: ECONOMICS
GDP growth rate and Performance Trends of India:
The GDP of India increased by 1.40 per cent in the second quarter of 2017. The GDP
growth rate of India averaged approximately 1.67 percent from the year 2006 to 2017 and the
GDP of India reached a highest of 6.20 percent in the second quarter of 2009 and also
recorded a relatively lower GDP of (2.30) percent during the first quarter of 2009
(Tradingeconomics.com, 2017). For India, the growth rate in GDP takes into the account the
change in the seasonally adjusted value of the goods and service produced by the economy of
India throughout the quarter. India is considered as the world’s tenth largest economy and the
most popular.
The economy of India has expanded by 7.2 per cent during the year 204-15 and by 7.6
per cent in the year 2015-16 which appears significant. Considering the performance trend of
India the country has emerged as the fastest rising major economy and provides a safe haven
for long term growth because of the improved macroeconomic situation. The GDP
performance in respect of the 2015-16 from the demand side comprised of the consumption,
investment and net exports. The private consumption experienced a rise of 7.6 per cent in
2015-16 in comparison to the 6.2 per cent attained in the year 2014-15 reflecting a rising
trend of increasing demand.
The fixed capital formation of India increased by 5.3 per cent in 2015-16 in
comparison to the 4.9 percent attained in 2014-15. However, the Indian economy GDP
growth unexpectedly slowed down to 6.1 percent in first quarter of 2017 slowing down
suddenly from the 7% rise in the earlier period below the market anticipation of 7.1%
(Tradingeconomics.com, 2017). The slowing growth is due to slower consumer spending
with a drop in investment because of the demonetization in November 2016 that removed
86% of the Indian currency in movement.
Paraphrase This Document
Need a fresh take? Get an instant paraphrase of this document with our AI Paraphraser
Running head: ECONOMICS
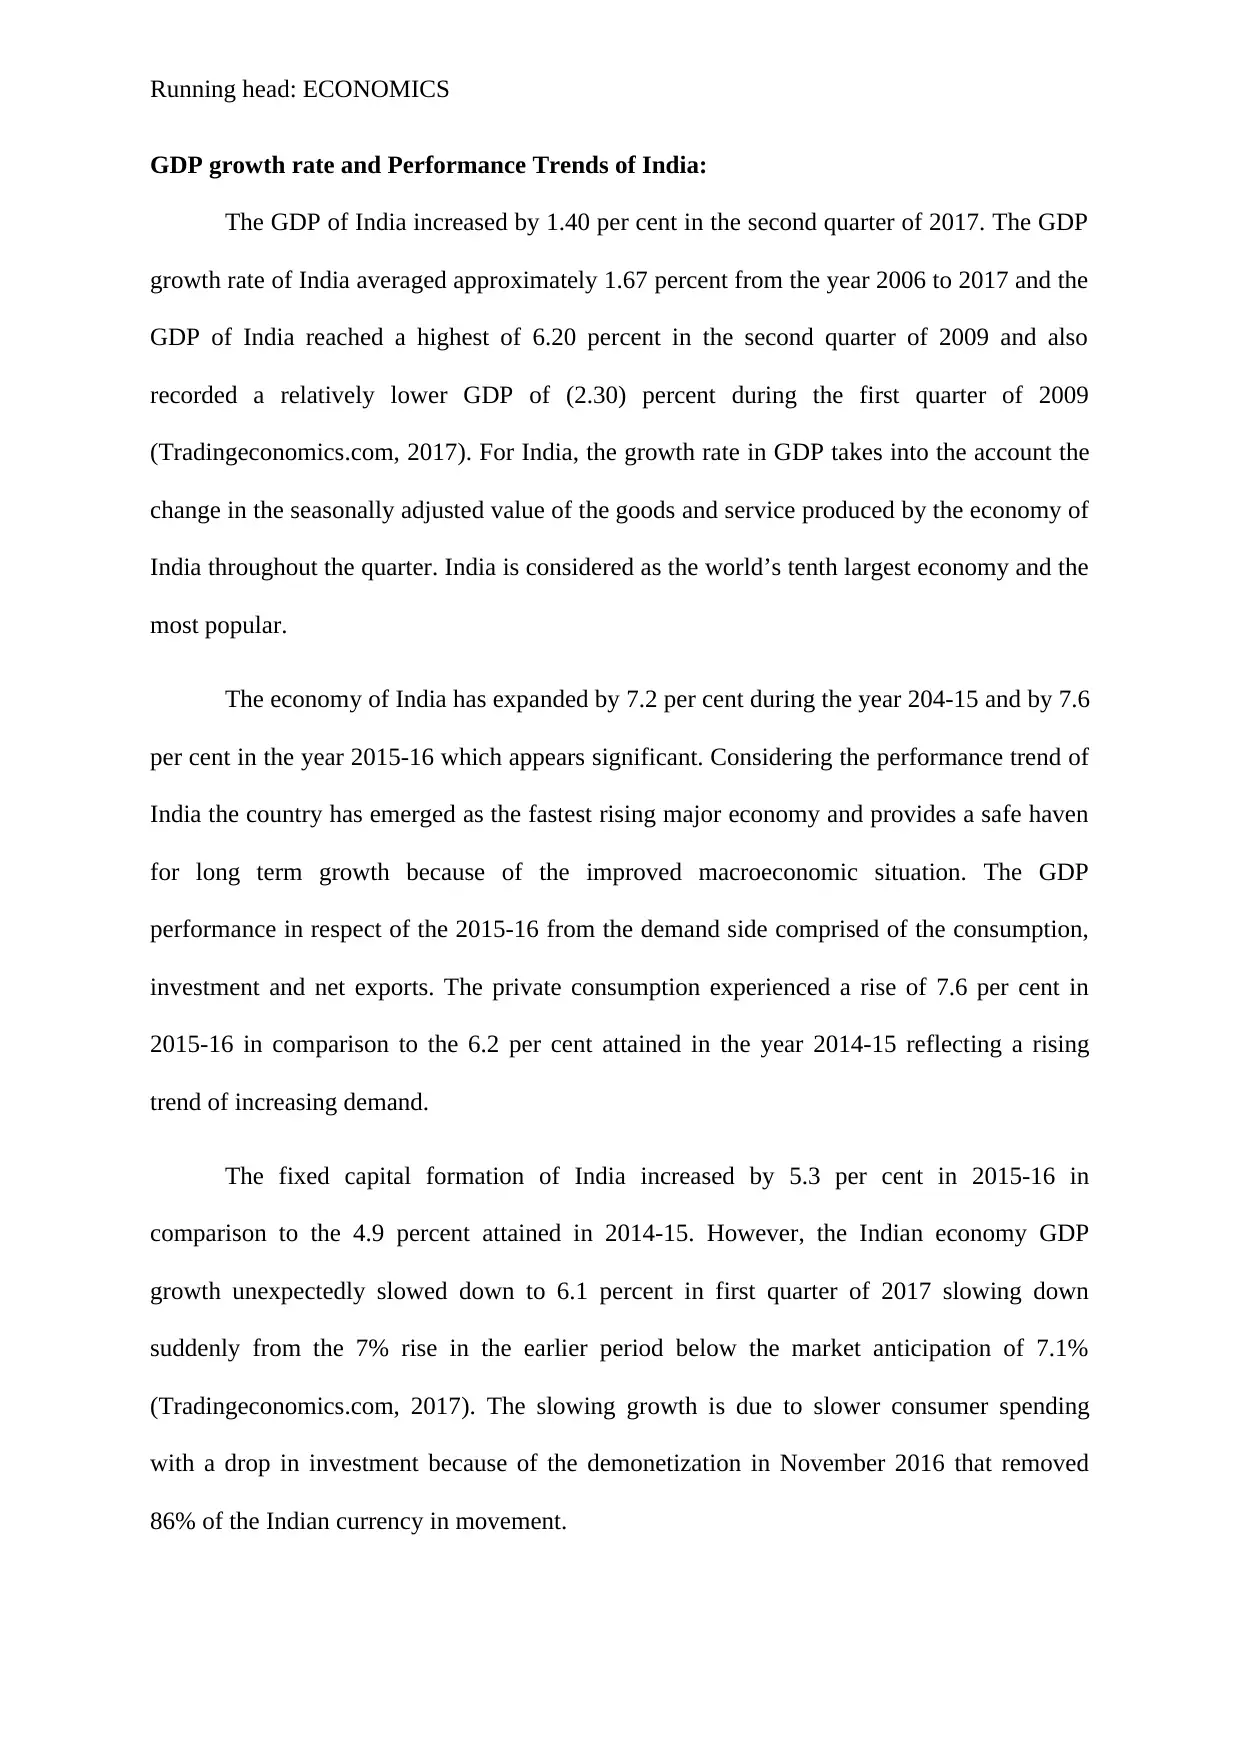
Figure 1: Figure illustrating GDP growth rate of India
Source: (Tradingeconomics.com, 2017)
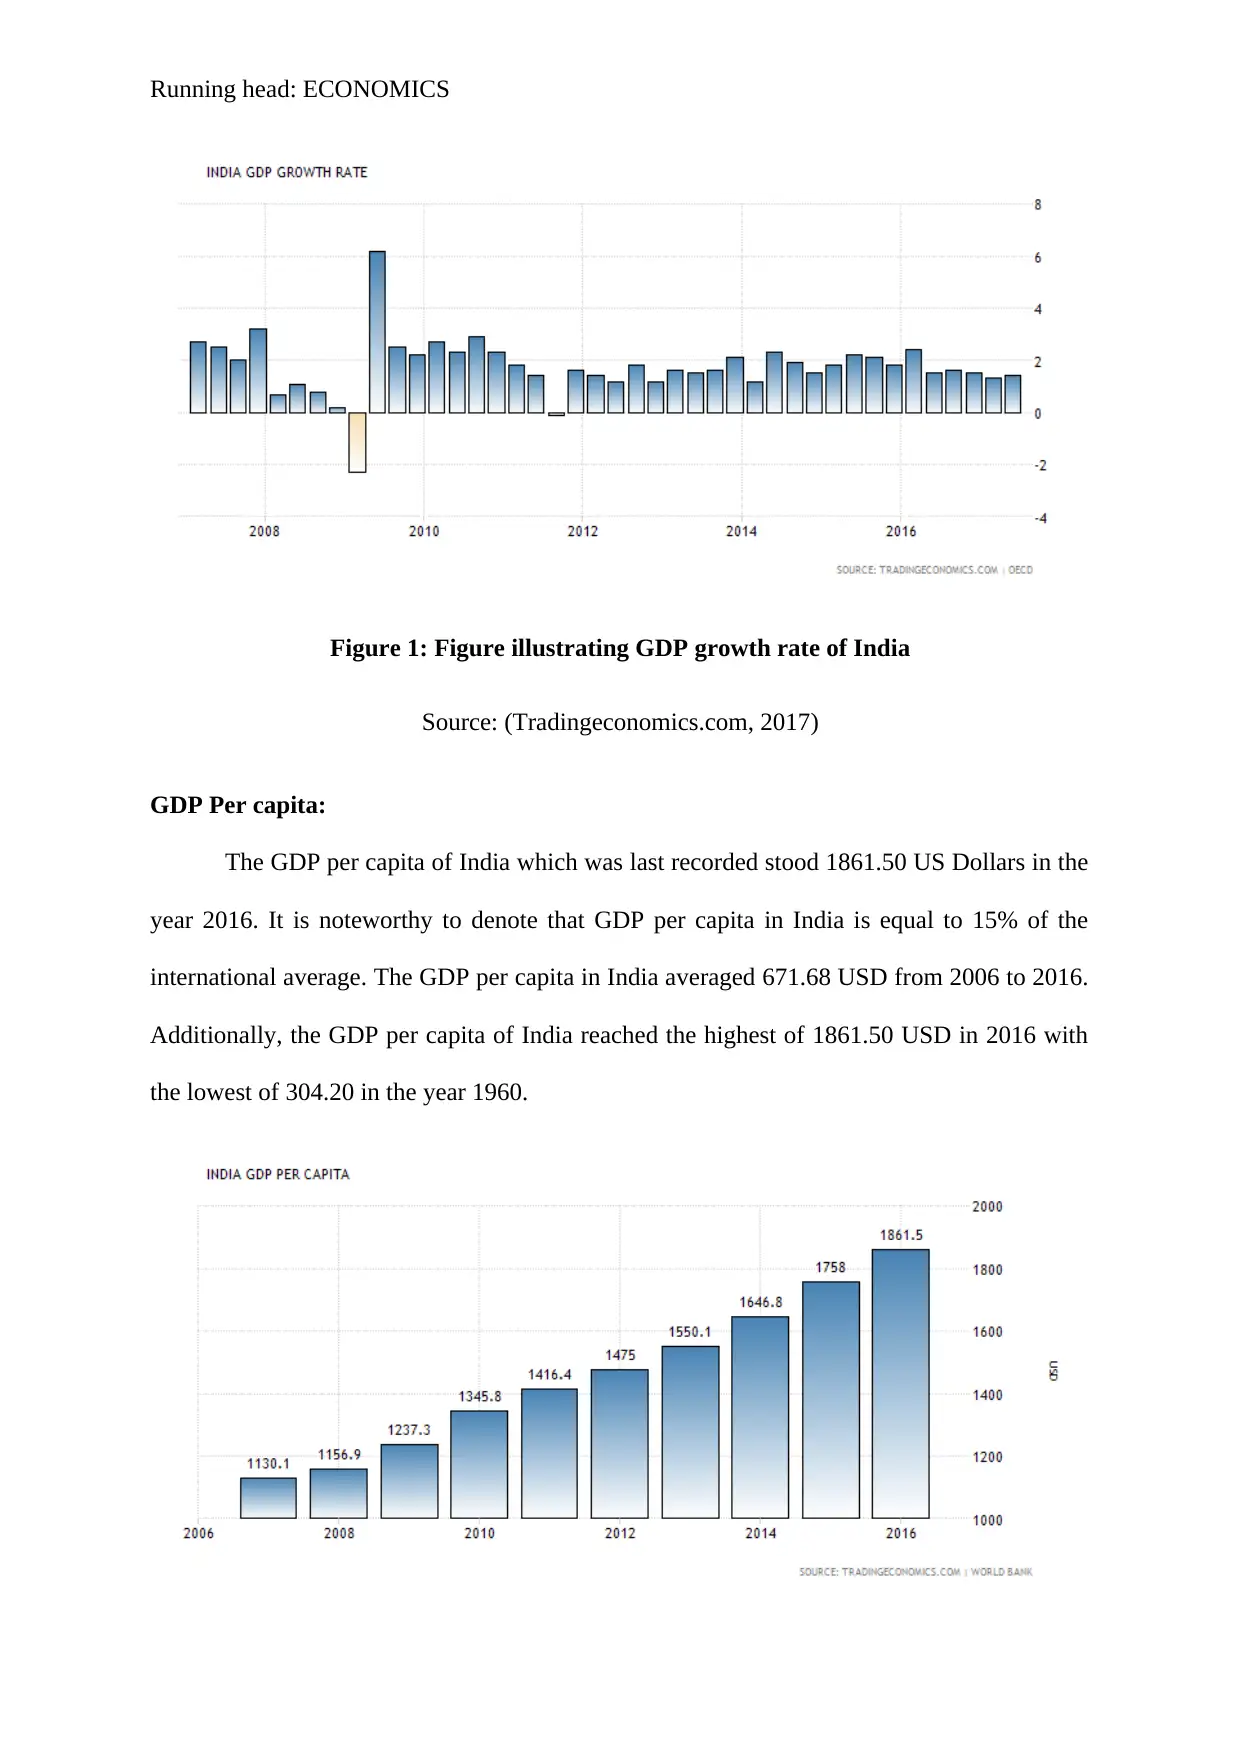
GDP Per capita:
The GDP per capita of India which was last recorded stood 1861.50 US Dollars in the
year 2016. It is noteworthy to denote that GDP per capita in India is equal to 15% of the
international average. The GDP per capita in India averaged 671.68 USD from 2006 to 2016.
Additionally, the GDP per capita of India reached the highest of 1861.50 USD in 2016 with
the lowest of 304.20 in the year 1960.
Figure 1: Figure illustrating GDP growth rate of India
Source: (Tradingeconomics.com, 2017)
GDP Per capita:
The GDP per capita of India which was last recorded stood 1861.50 US Dollars in the
year 2016. It is noteworthy to denote that GDP per capita in India is equal to 15% of the
international average. The GDP per capita in India averaged 671.68 USD from 2006 to 2016.
Additionally, the GDP per capita of India reached the highest of 1861.50 USD in 2016 with
the lowest of 304.20 in the year 1960.
Running head: ECONOMICS
Figure 2: GDP Per Capita of India
Source: (Tradingeconomics.com, 2017)
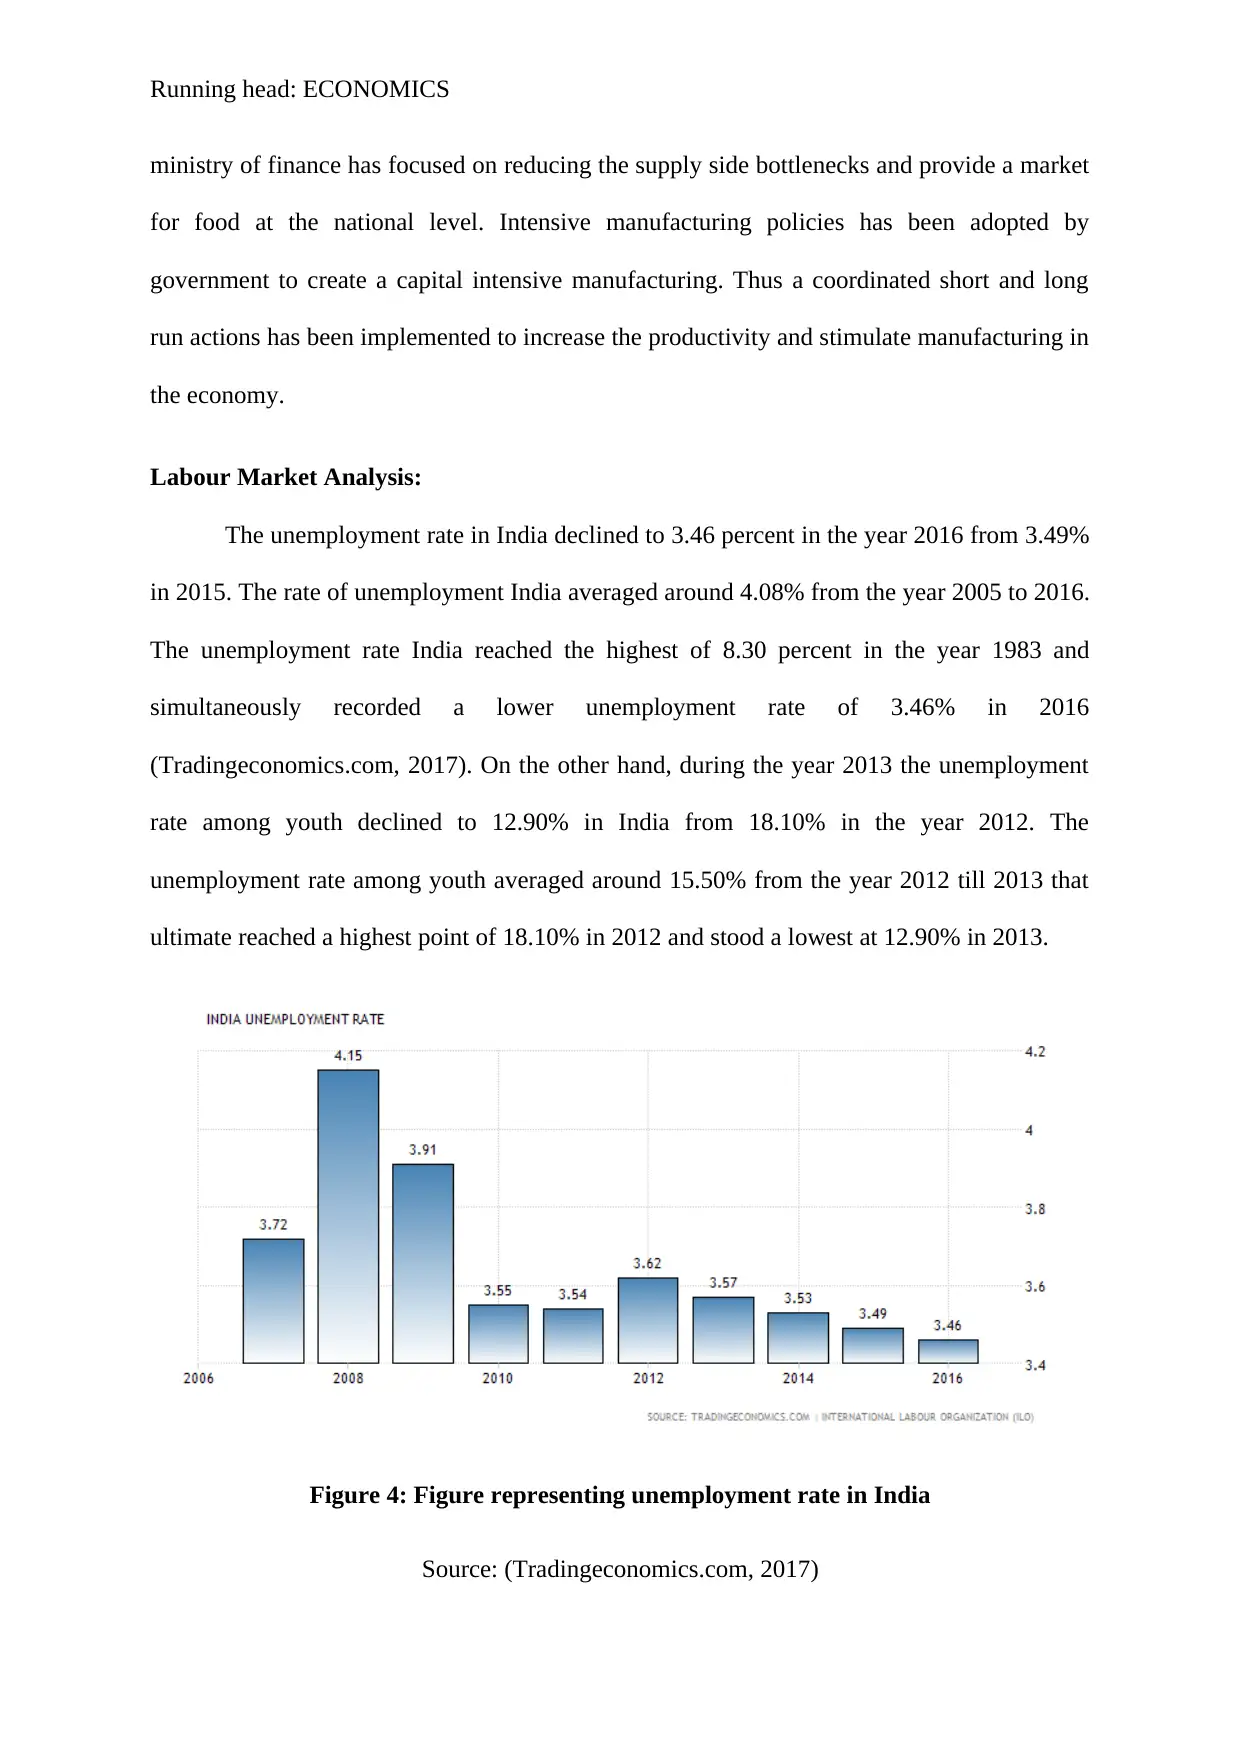
Real GDP growth rate:
The Indian economy grew by 5.7% yearly in the second quarter of 2017 which is
lower than the market expectations of 6.6% and previous year growth of 6.1%. The slowing
GDP growth rate is due to the weakest consumer expenditure and export
(Tradingeconomics.com, 2017). Figures in the second quarter of 2017 represented a third
consecutive slowing economic expansion.
Figure 3: Figure representing Real GDP growth rate of India
Source: (Tradingeconomics.com, 2017)
Government measure to achieve production output:
Agricultural sector becomes the backbone of the Indian Economy with the initiative
of propelling the marked budget of the sector. The government introduced policies such as
“Make in India” and Stabilization Fund” in order to establish a market for farm produce,
irrigation scheme and new universities for agriculture to increase the productivity. The
Figure 2: GDP Per Capita of India
Source: (Tradingeconomics.com, 2017)
Real GDP growth rate:
The Indian economy grew by 5.7% yearly in the second quarter of 2017 which is
lower than the market expectations of 6.6% and previous year growth of 6.1%. The slowing
GDP growth rate is due to the weakest consumer expenditure and export
(Tradingeconomics.com, 2017). Figures in the second quarter of 2017 represented a third
consecutive slowing economic expansion.
Figure 3: Figure representing Real GDP growth rate of India
Source: (Tradingeconomics.com, 2017)
Government measure to achieve production output:
Agricultural sector becomes the backbone of the Indian Economy with the initiative
of propelling the marked budget of the sector. The government introduced policies such as
“Make in India” and Stabilization Fund” in order to establish a market for farm produce,
irrigation scheme and new universities for agriculture to increase the productivity. The
⊘ This is a preview!⊘
Do you want full access?
Subscribe today to unlock all pages.
Trusted by 1+ million students worldwide
Running head: ECONOMICS
ministry of finance has focused on reducing the supply side bottlenecks and provide a market
for food at the national level. Intensive manufacturing policies has been adopted by
government to create a capital intensive manufacturing. Thus a coordinated short and long
run actions has been implemented to increase the productivity and stimulate manufacturing in
the economy.
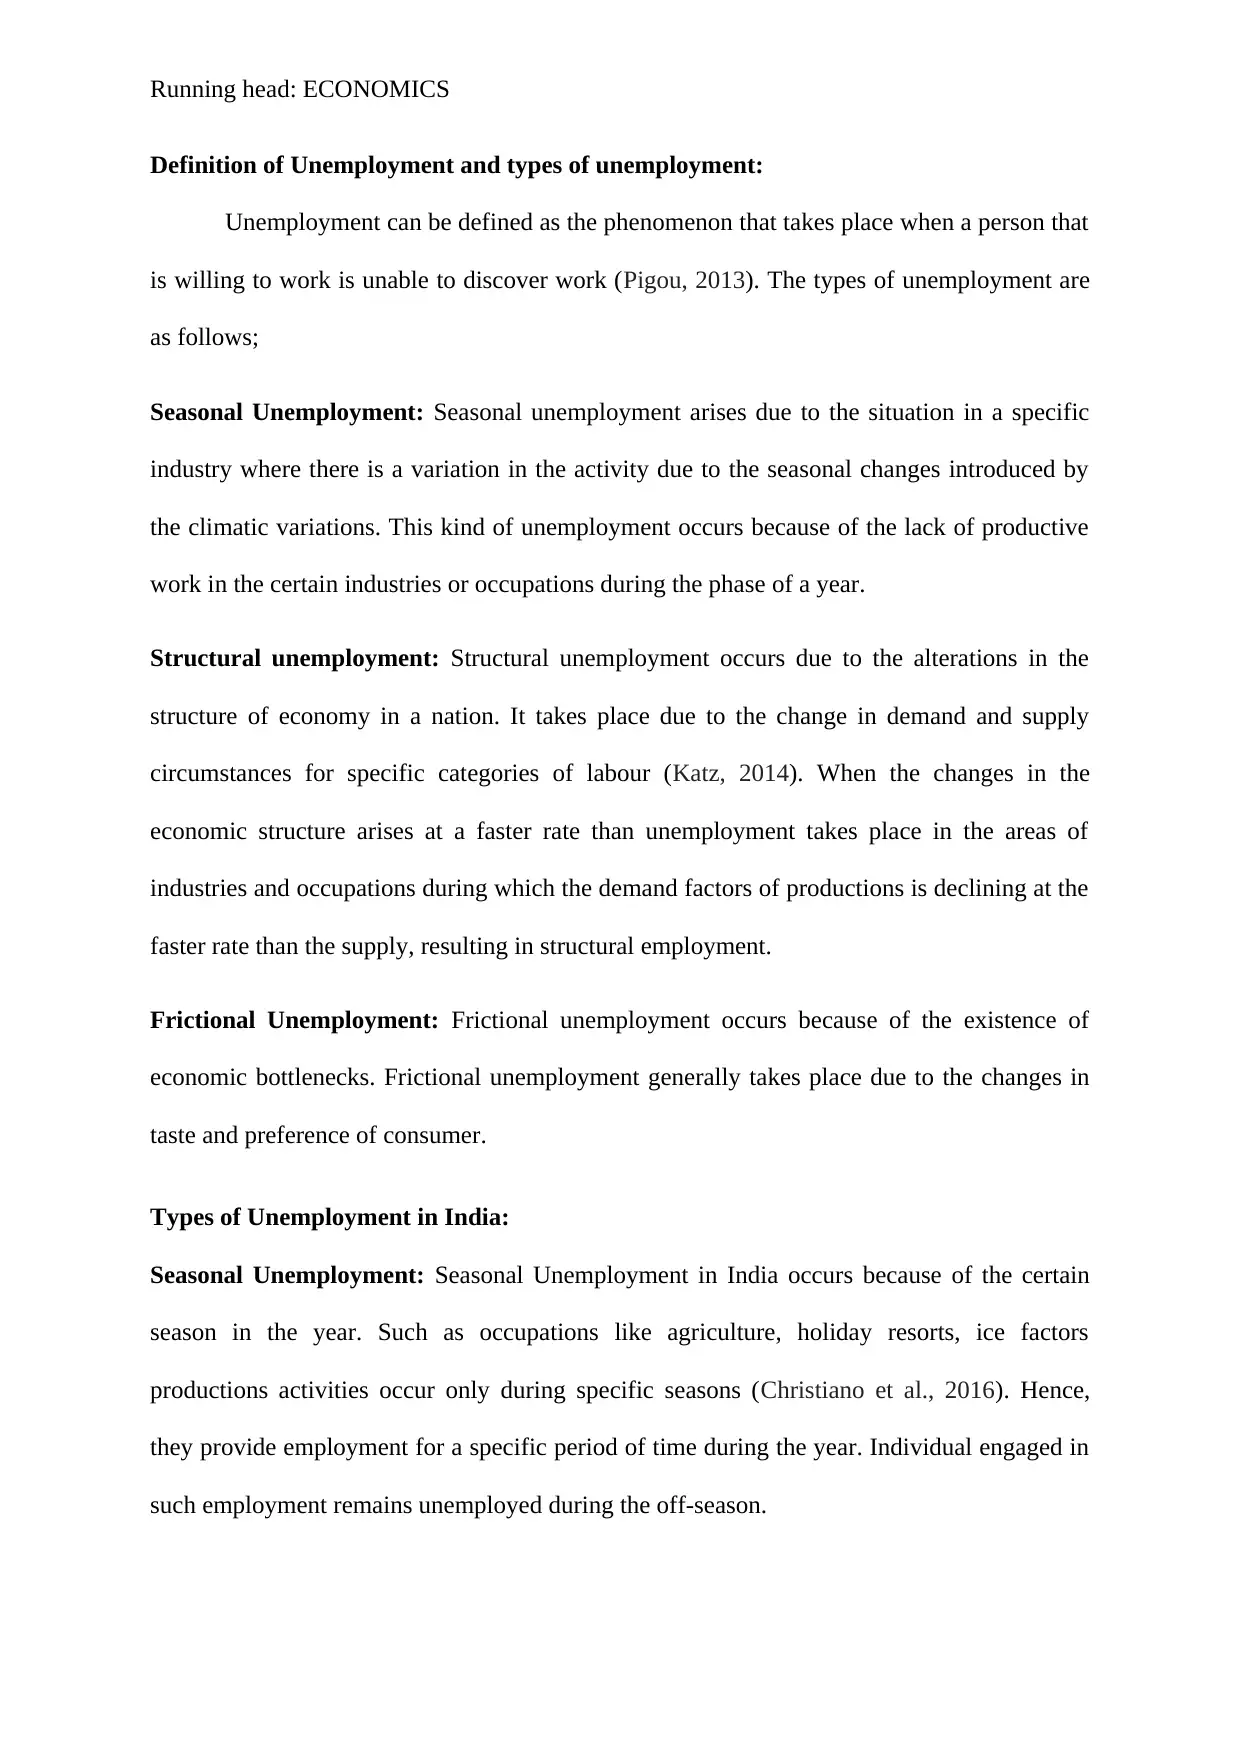
Labour Market Analysis:
The unemployment rate in India declined to 3.46 percent in the year 2016 from 3.49%
in 2015. The rate of unemployment India averaged around 4.08% from the year 2005 to 2016.
The unemployment rate India reached the highest of 8.30 percent in the year 1983 and
simultaneously recorded a lower unemployment rate of 3.46% in 2016
(Tradingeconomics.com, 2017). On the other hand, during the year 2013 the unemployment
rate among youth declined to 12.90% in India from 18.10% in the year 2012. The
unemployment rate among youth averaged around 15.50% from the year 2012 till 2013 that
ultimate reached a highest point of 18.10% in 2012 and stood a lowest at 12.90% in 2013.
Figure 4: Figure representing unemployment rate in India
Source: (Tradingeconomics.com, 2017)
ministry of finance has focused on reducing the supply side bottlenecks and provide a market
for food at the national level. Intensive manufacturing policies has been adopted by
government to create a capital intensive manufacturing. Thus a coordinated short and long
run actions has been implemented to increase the productivity and stimulate manufacturing in
the economy.
Labour Market Analysis:
The unemployment rate in India declined to 3.46 percent in the year 2016 from 3.49%
in 2015. The rate of unemployment India averaged around 4.08% from the year 2005 to 2016.
The unemployment rate India reached the highest of 8.30 percent in the year 1983 and
simultaneously recorded a lower unemployment rate of 3.46% in 2016
(Tradingeconomics.com, 2017). On the other hand, during the year 2013 the unemployment
rate among youth declined to 12.90% in India from 18.10% in the year 2012. The
unemployment rate among youth averaged around 15.50% from the year 2012 till 2013 that
ultimate reached a highest point of 18.10% in 2012 and stood a lowest at 12.90% in 2013.
Figure 4: Figure representing unemployment rate in India
Source: (Tradingeconomics.com, 2017)
Paraphrase This Document
Need a fresh take? Get an instant paraphrase of this document with our AI Paraphraser
Running head: ECONOMICS
Definition of Unemployment and types of unemployment:
Unemployment can be defined as the phenomenon that takes place when a person that
is willing to work is unable to discover work (Pigou, 2013). The types of unemployment are
as follows;
Seasonal Unemployment: Seasonal unemployment arises due to the situation in a specific
industry where there is a variation in the activity due to the seasonal changes introduced by
the climatic variations. This kind of unemployment occurs because of the lack of productive
work in the certain industries or occupations during the phase of a year.
Structural unemployment: Structural unemployment occurs due to the alterations in the
structure of economy in a nation. It takes place due to the change in demand and supply
circumstances for specific categories of labour (Katz, 2014). When the changes in the
economic structure arises at a faster rate than unemployment takes place in the areas of
industries and occupations during which the demand factors of productions is declining at the
faster rate than the supply, resulting in structural employment.
Frictional Unemployment: Frictional unemployment occurs because of the existence of
economic bottlenecks. Frictional unemployment generally takes place due to the changes in
taste and preference of consumer.
Types of Unemployment in India:
Seasonal Unemployment: Seasonal Unemployment in India occurs because of the certain
season in the year. Such as occupations like agriculture, holiday resorts, ice factors
productions activities occur only during specific seasons (Christiano et al., 2016). Hence,
they provide employment for a specific period of time during the year. Individual engaged in
such employment remains unemployed during the off-season.
Running head: ECONOMICS
Structural Unemployment: Structural changes India is because of the change in technology
from labour intensive to capital intensive technology that ultimately resulted in change in
demand pattern. India is a developing country and structural unemployment prevails both in
the rural and urban areas.
Disguised Unemployment: Disguised unemployment in India is largely found in the rural
areas especially in the farming sector (Singh & Pandey, 2017). In rural areas of India more
people are working on the agricultural land than they are actually required. In spite of
withdrawing some people the production of the agricultural field does not falls. This refers to
the situation of employment with surplus manpower with zero marginal productivity.
Measures to achieve full employment in India are as follows:
The measures to attain full employment are as follows;
Integrated rural development programme (IRDP): The Indian government has introduced
IRDP programme as the measure with the objective of creating a full employment
opportunity in the rural areas (Christiano et al., 2016). Areas that are targeted for
development under this programme are agriculture, animal husbandry, forestry, small cottage
industries and constructions of roads and canal falls under this measurement.
Jawahar Rozgar Yojana: The purpose of this programme is to offer employment to a
minimum of one member of each poor family for a period of 100 days at work in their place
near his residence. A special feature of this program is for women with 30% of the
employment will be reserved for women.
⊘ This is a preview!⊘
Do you want full access?
Subscribe today to unlock all pages.
Trusted by 1+ million students worldwide
Running head: ECONOMICS
Price level Analysis:
Inflation trend based on inflation rate:
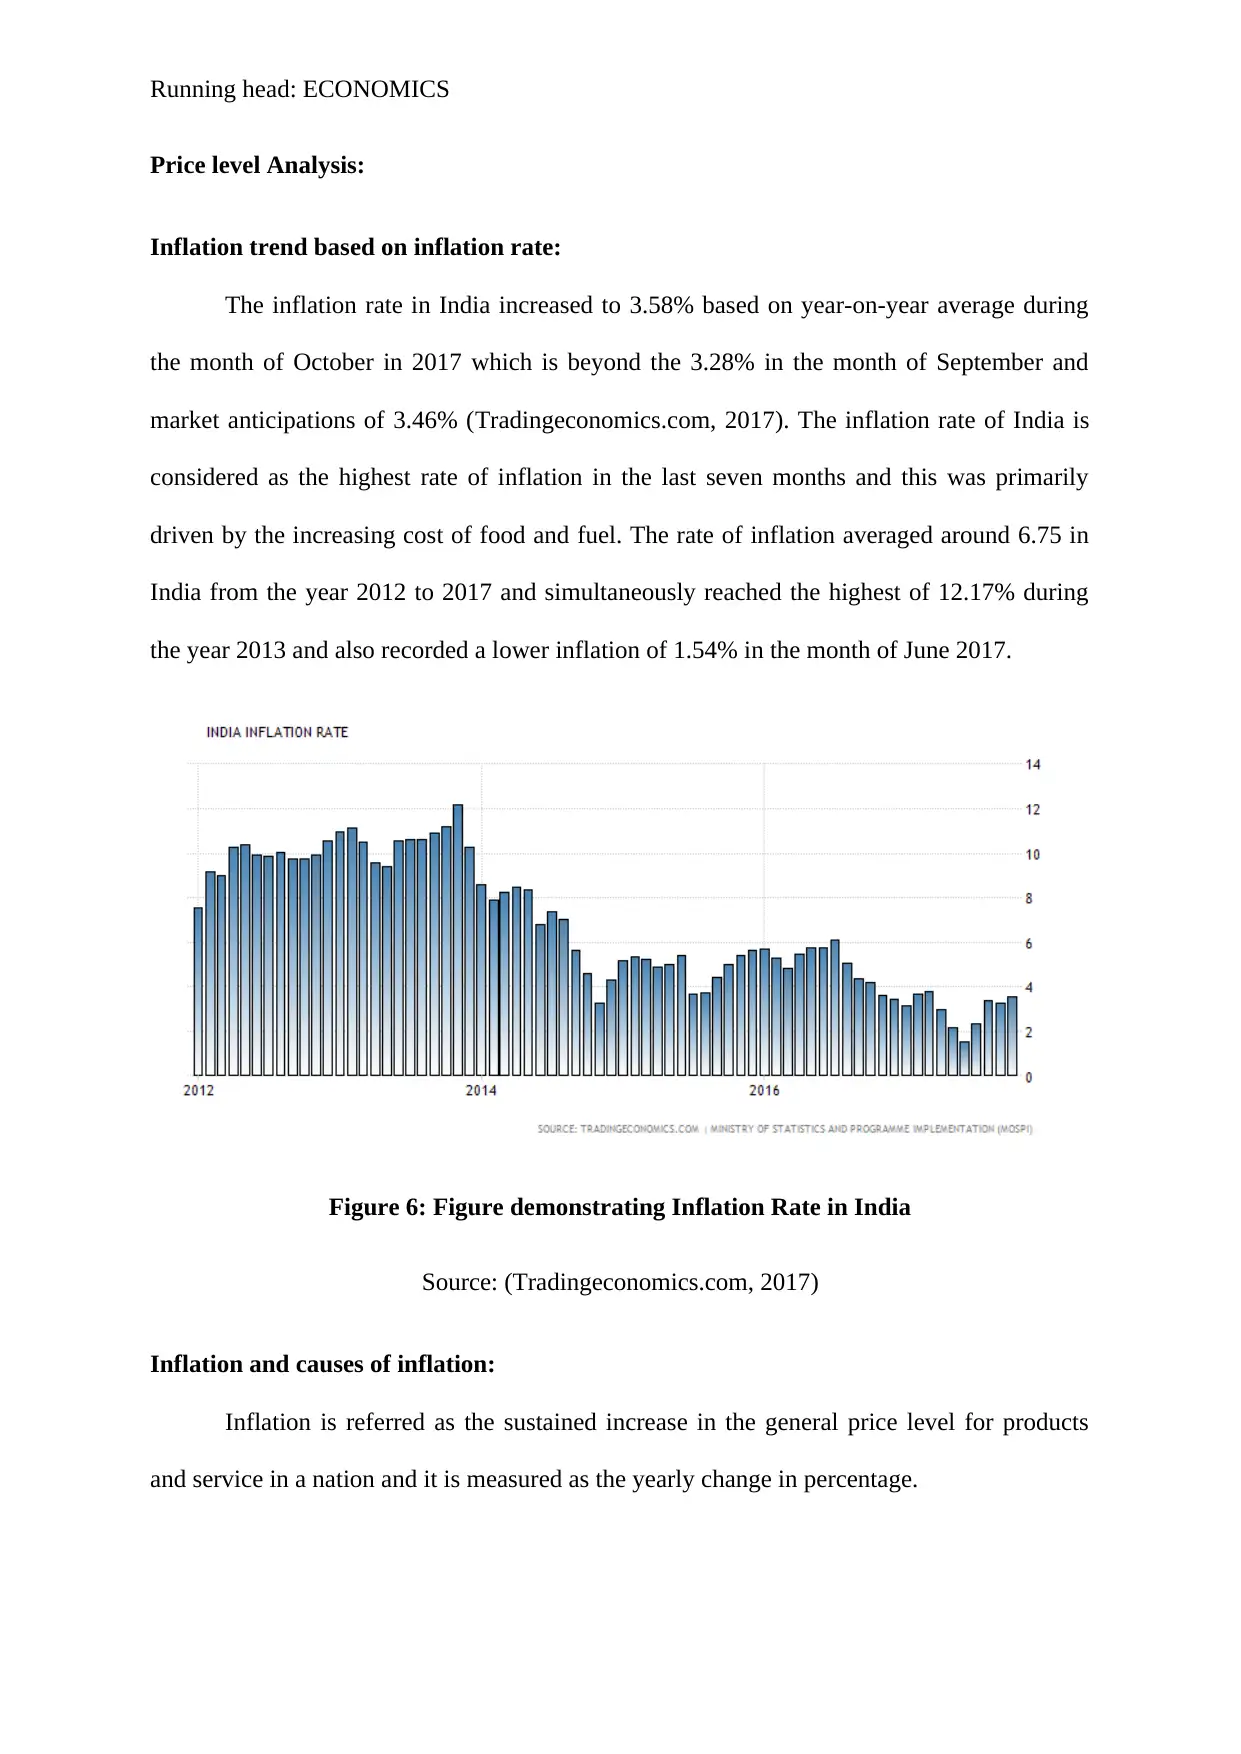
The inflation rate in India increased to 3.58% based on year-on-year average during
the month of October in 2017 which is beyond the 3.28% in the month of September and
market anticipations of 3.46% (Tradingeconomics.com, 2017). The inflation rate of India is
considered as the highest rate of inflation in the last seven months and this was primarily
driven by the increasing cost of food and fuel. The rate of inflation averaged around 6.75 in
India from the year 2012 to 2017 and simultaneously reached the highest of 12.17% during
the year 2013 and also recorded a lower inflation of 1.54% in the month of June 2017.
Figure 6: Figure demonstrating Inflation Rate in India
Source: (Tradingeconomics.com, 2017)
Inflation and causes of inflation:
Inflation is referred as the sustained increase in the general price level for products
and service in a nation and it is measured as the yearly change in percentage.
Price level Analysis:
Inflation trend based on inflation rate:
The inflation rate in India increased to 3.58% based on year-on-year average during
the month of October in 2017 which is beyond the 3.28% in the month of September and
market anticipations of 3.46% (Tradingeconomics.com, 2017). The inflation rate of India is
considered as the highest rate of inflation in the last seven months and this was primarily
driven by the increasing cost of food and fuel. The rate of inflation averaged around 6.75 in
India from the year 2012 to 2017 and simultaneously reached the highest of 12.17% during
the year 2013 and also recorded a lower inflation of 1.54% in the month of June 2017.
Figure 6: Figure demonstrating Inflation Rate in India
Source: (Tradingeconomics.com, 2017)
Inflation and causes of inflation:
Inflation is referred as the sustained increase in the general price level for products
and service in a nation and it is measured as the yearly change in percentage.
Paraphrase This Document
Need a fresh take? Get an instant paraphrase of this document with our AI Paraphraser
Running head: ECONOMICS
Causes of inflation are as follows:
Inflation is caused due to two main factors namely demand pull factors and cost pull
factors. The causes are explained below
Demand pull inflation causes:
Depreciation in the rate of exchange: Depreciating value of the exchange rate results in rise
in the value of the imports and lowers the foreign price of the nation’s export.
Increased demand from the fiscal stimulus: Increased demand from the fiscal stimulus
results in inflation namely from the lower direct or indirect taxes or increase in the
government spending (Brunnermeier & Sannikov, 2016). Higher government spending
increases the circular flow of demand while reduction in direct tax results in more disposable
income leading to increased demand.
Cost push Inflation:
Components Cost: An increase in the price of the raw materials and other components
results to inflation. This is generally due to the increase in the commodity prices namely oil
and agricultural products.
Increasing labour cost: Rising cost of labour is caused by the increase in the wages that are
higher than the enhancements in productivity. Wages often increases when the
unemployment is lower since skilled worker becomes less and results in higher pay.
Causes of inflation in India:
Increase in public expenditure: Public expenditure has increased from 18.6% in the year
2000 to 28% in the year 2013. Approximately around 40% of the government expenditure in
India the areas of non-developmental activities have increased significantly that resulted in
inflation.
Running head: ECONOMICS
Deficit Financing: When the government is unable to raise adequate amount of revenue for
its expenditure, it recourses to deficit financing (Wolman, 2015). In the sixth and seventh
plans massive amount of deficit financing was resorted that ultimately resulted in deficit
financing.
Insufficient agricultural and industrial growth: Agricultural and industrial growth in the
country has been at the lowest level that was targeted by the government (Chowdhury, 2014).
There has been a failure in the crops due to drought that resulted in inflation in India.
Government measures to achieve price stability:
The government has undertaken steps in containing inflation are as follows;
a. Recommending the delisting of the fruits and vegetables in respect of the Agricultural
Committee Acts of the states.
b. The government has undertaken steps in fixing revising minimum export price on the
export of onion and potatoes to $450 per MT.
c. The government as the measure to reduce inflation distributes rice to the BPL families
as the implementation of National Food Security Act (Rani et al., 2017).
Conclusion:
The analysis can be concluded by stating that in spite of being a developing country
has illustrated development at a rapid pace by transforming from an agricultural oriented
economy to capital intensive economy. Though the GDP in the recent quarters have declined
but the economist has predicted an improved GDP in the upcoming quarter. India being an
open economy has successfully attracted foreign direct investment with successful policies of
government in reducing inflation and encouraging price stability.
⊘ This is a preview!⊘
Do you want full access?
Subscribe today to unlock all pages.
Trusted by 1+ million students worldwide
1 out of 15
Related Documents


Your All-in-One AI-Powered Toolkit for Academic Success.
+13062052269
info@desklib.com
Available 24*7 on WhatsApp / Email
![[object Object]](/_next/static/media/star-bottom.7253800d.svg)
Unlock your academic potential
Copyright © 2020–2026 A2Z Services. All Rights Reserved. Developed and managed by ZUCOL.