Auditing Assignment: Financial Statement Analysis and Ratios

Verified

Added on  2019/11/08

|7
|1601
|165
Homework Assignment
AI Summary
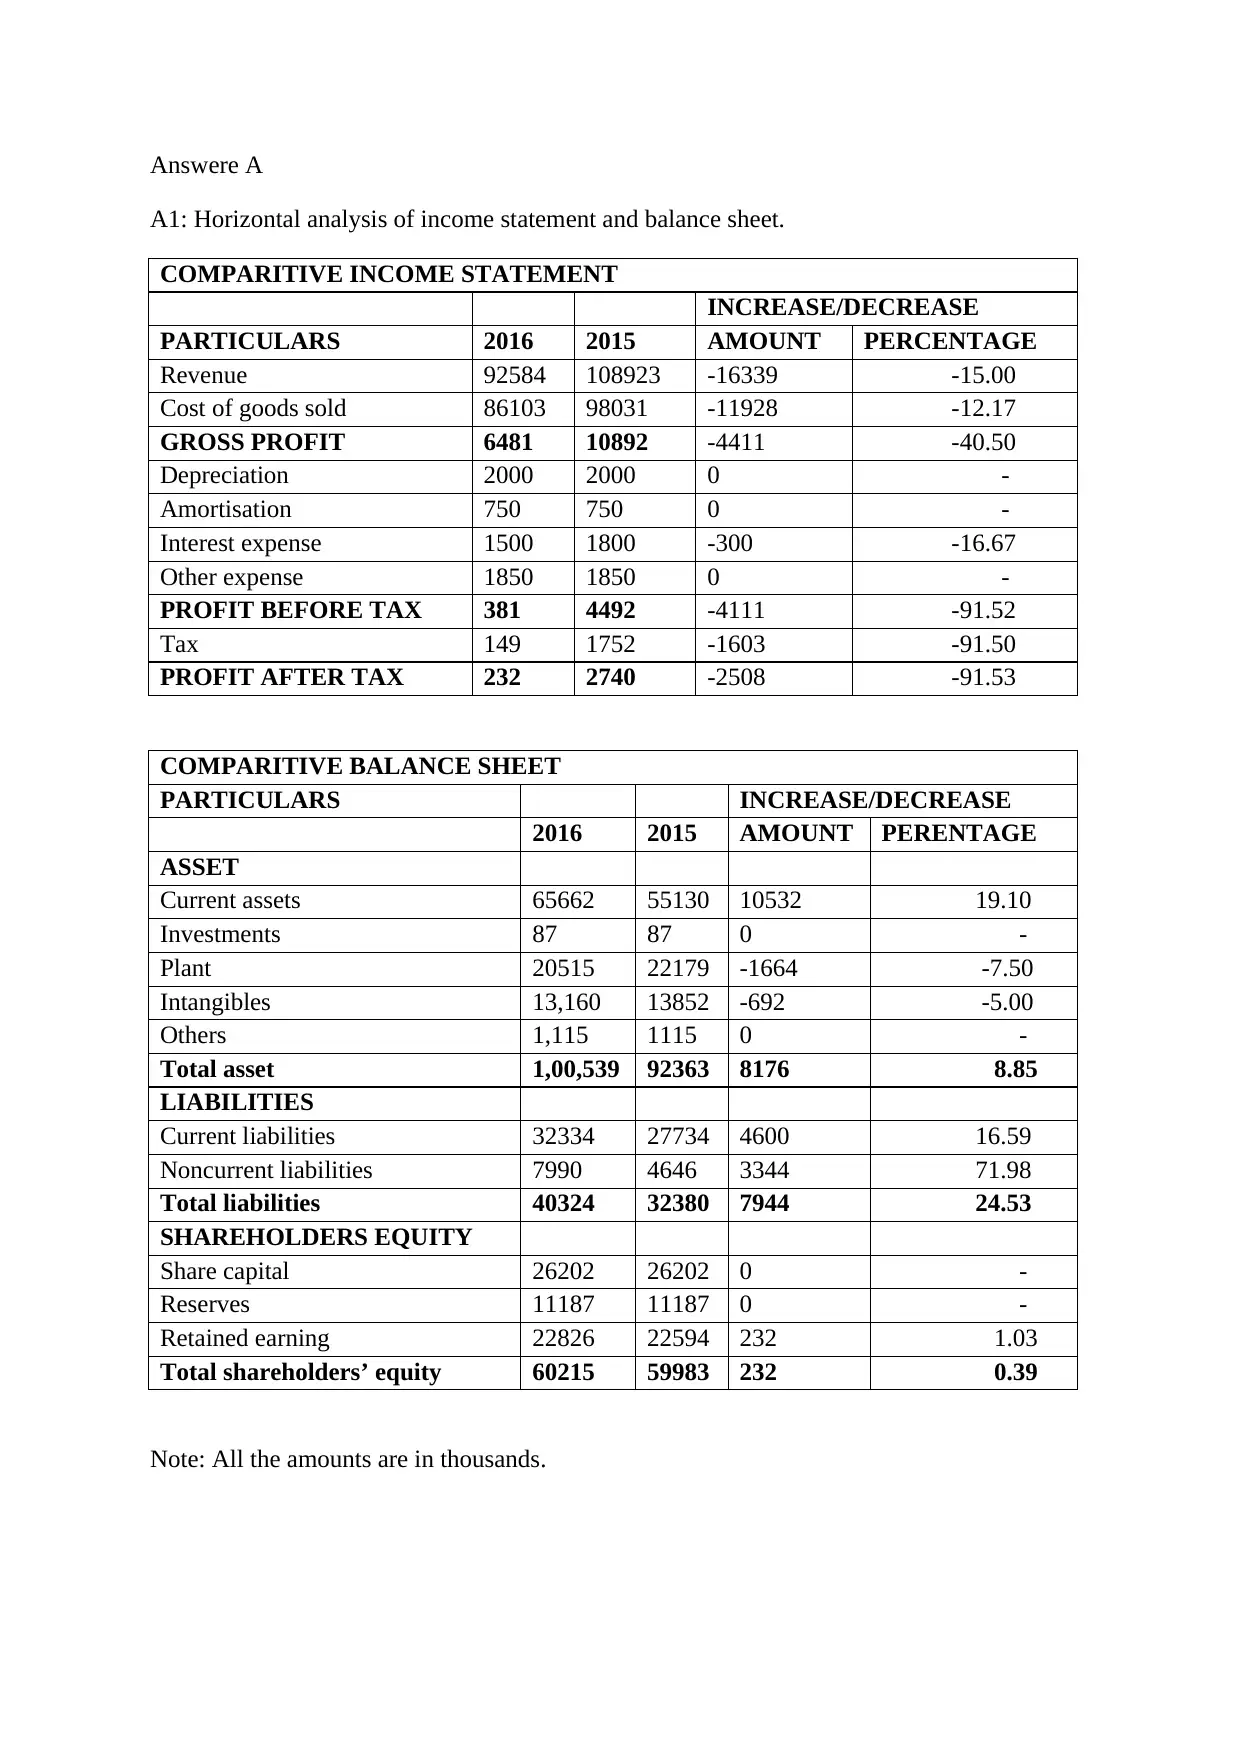
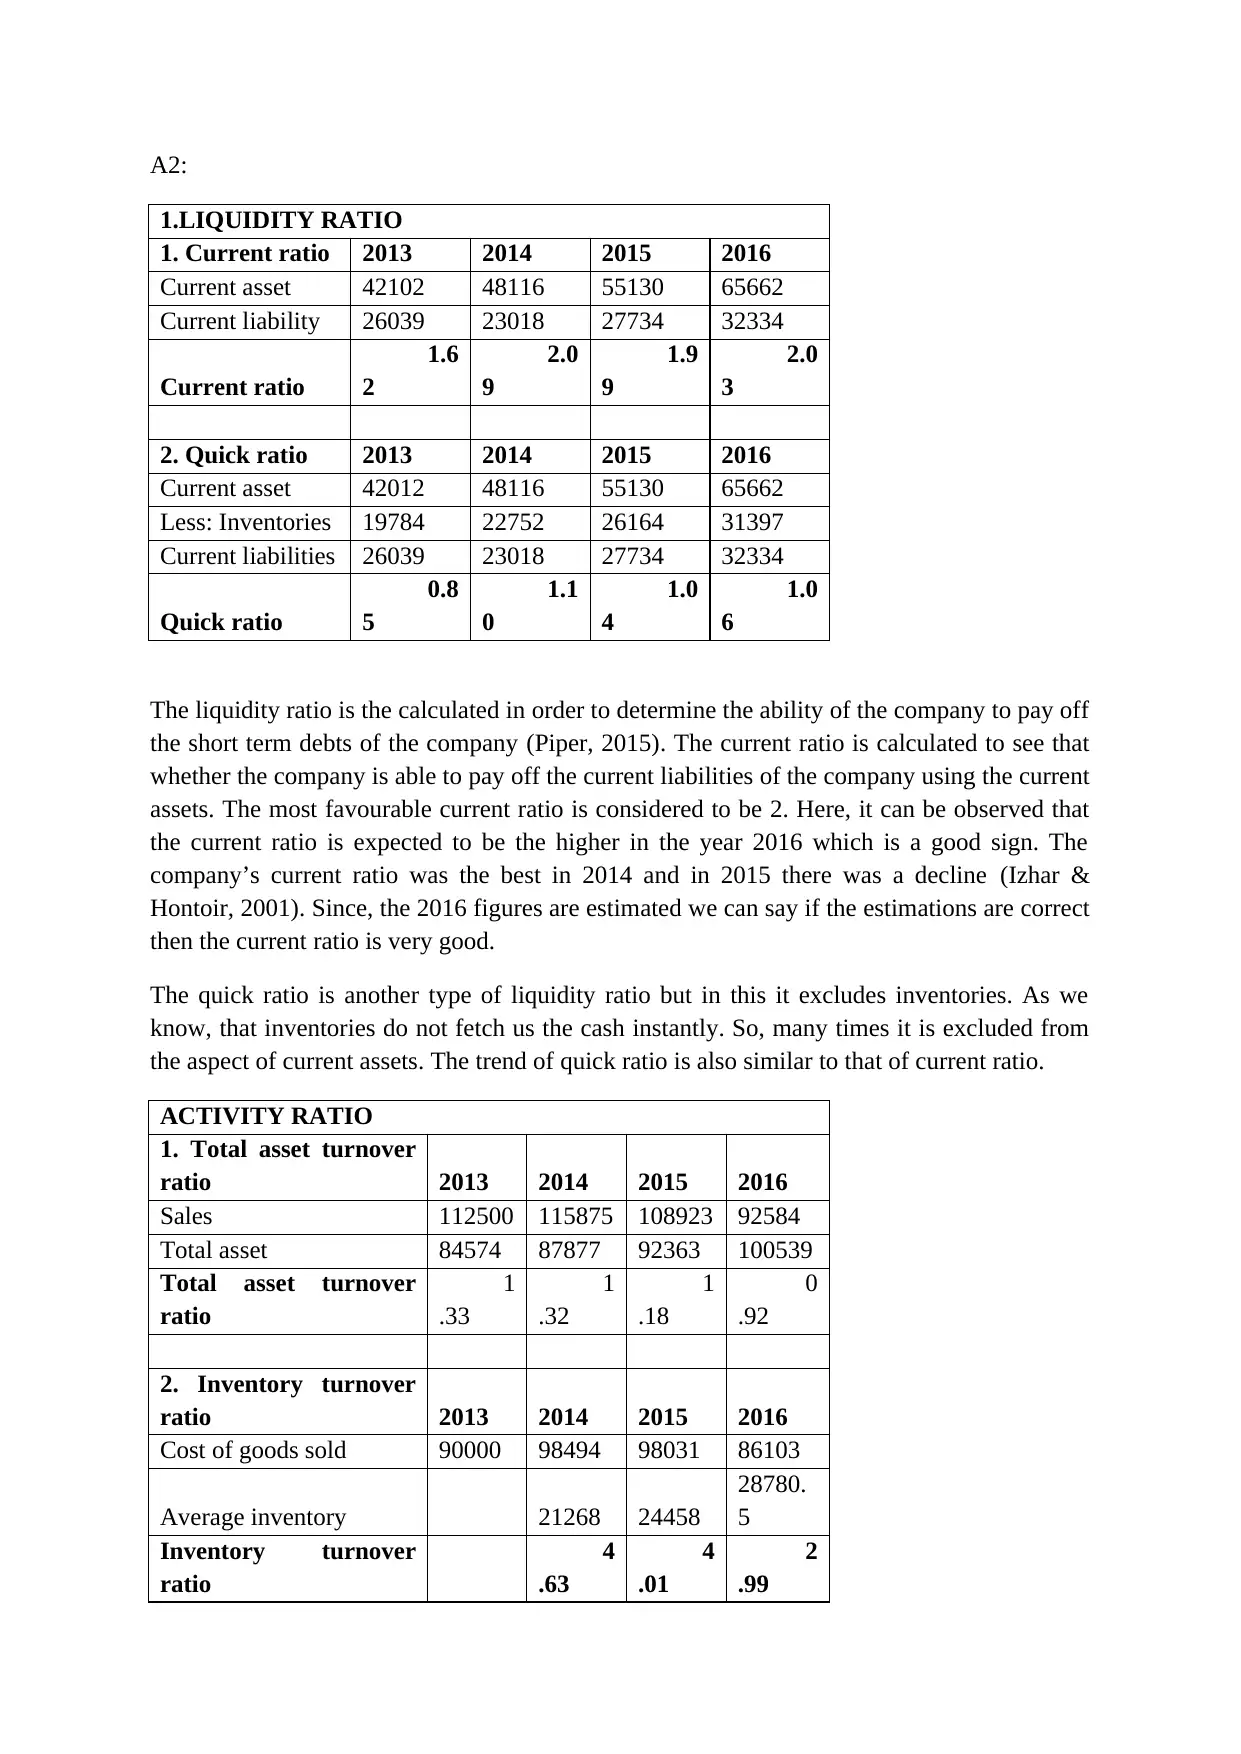
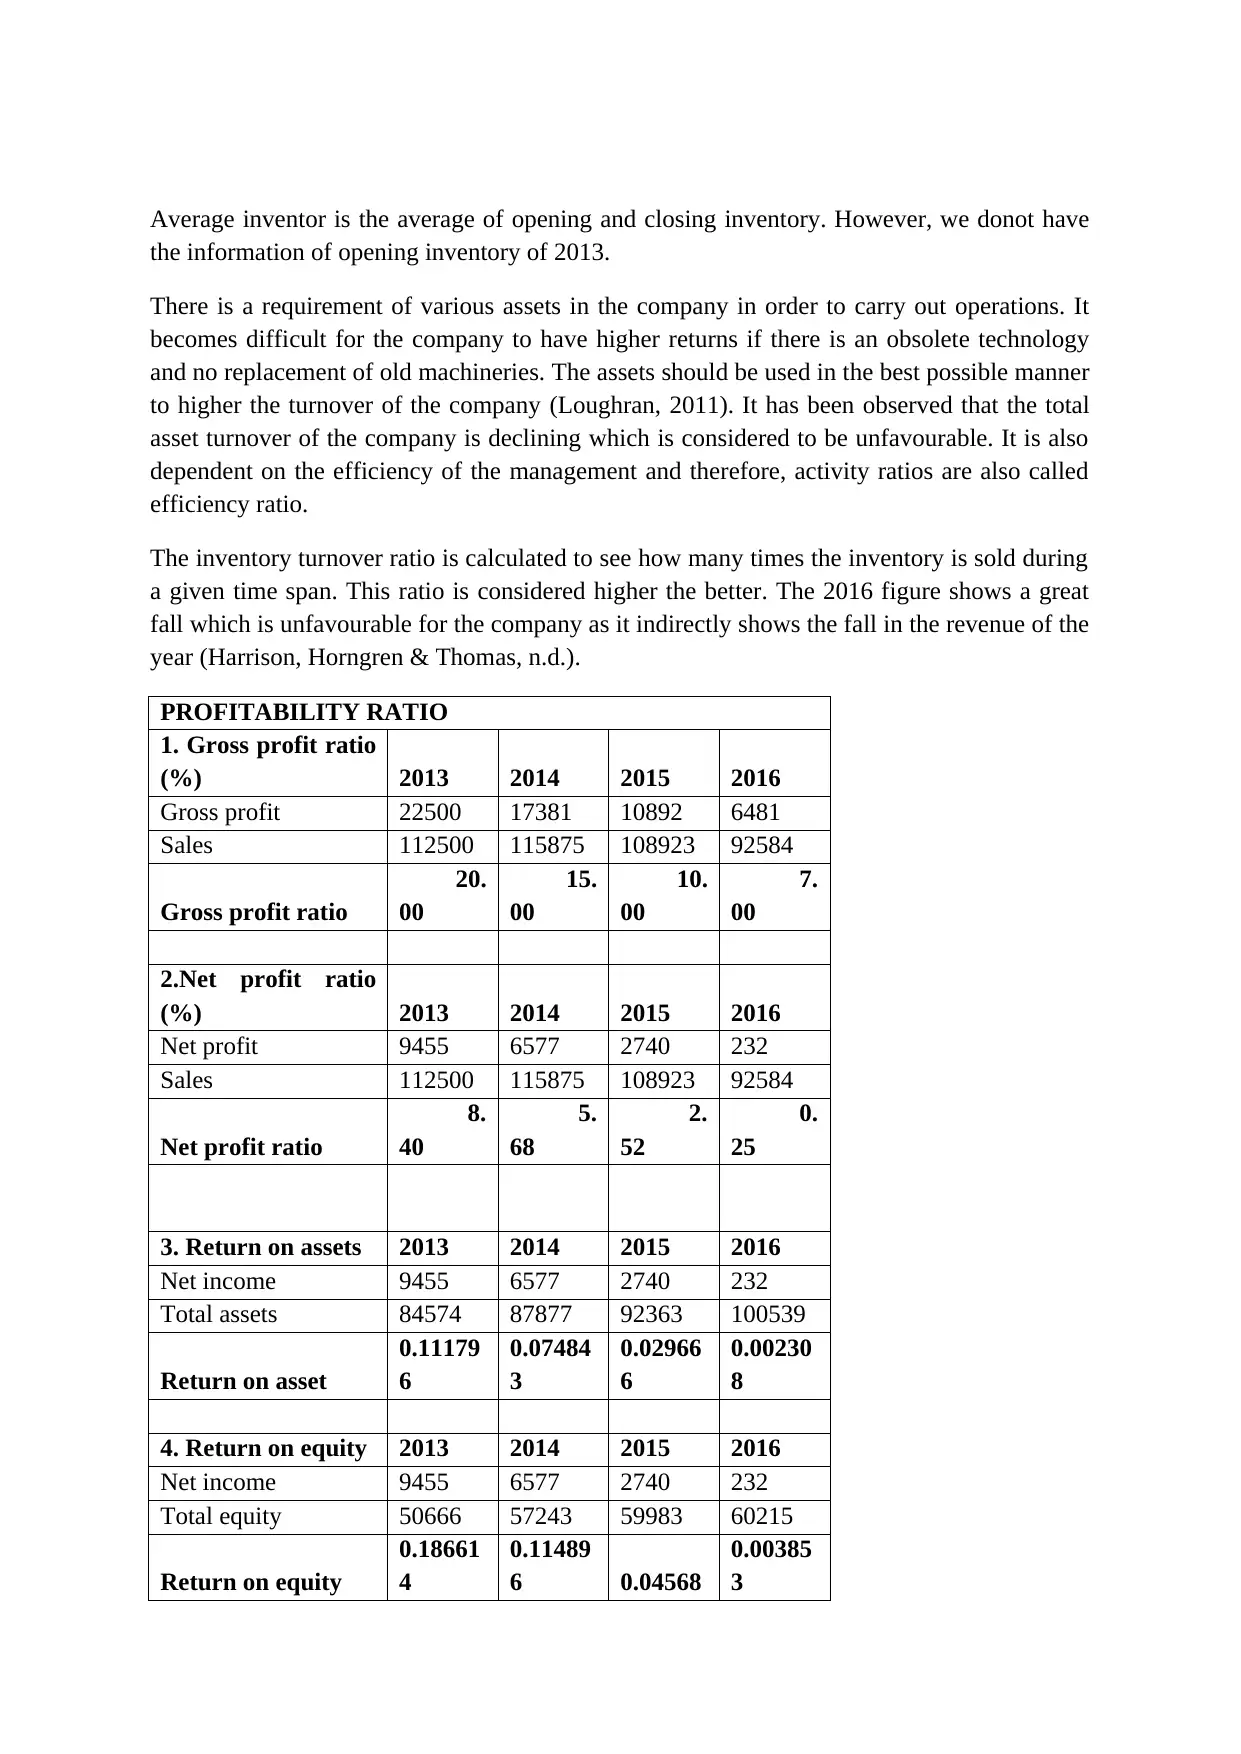
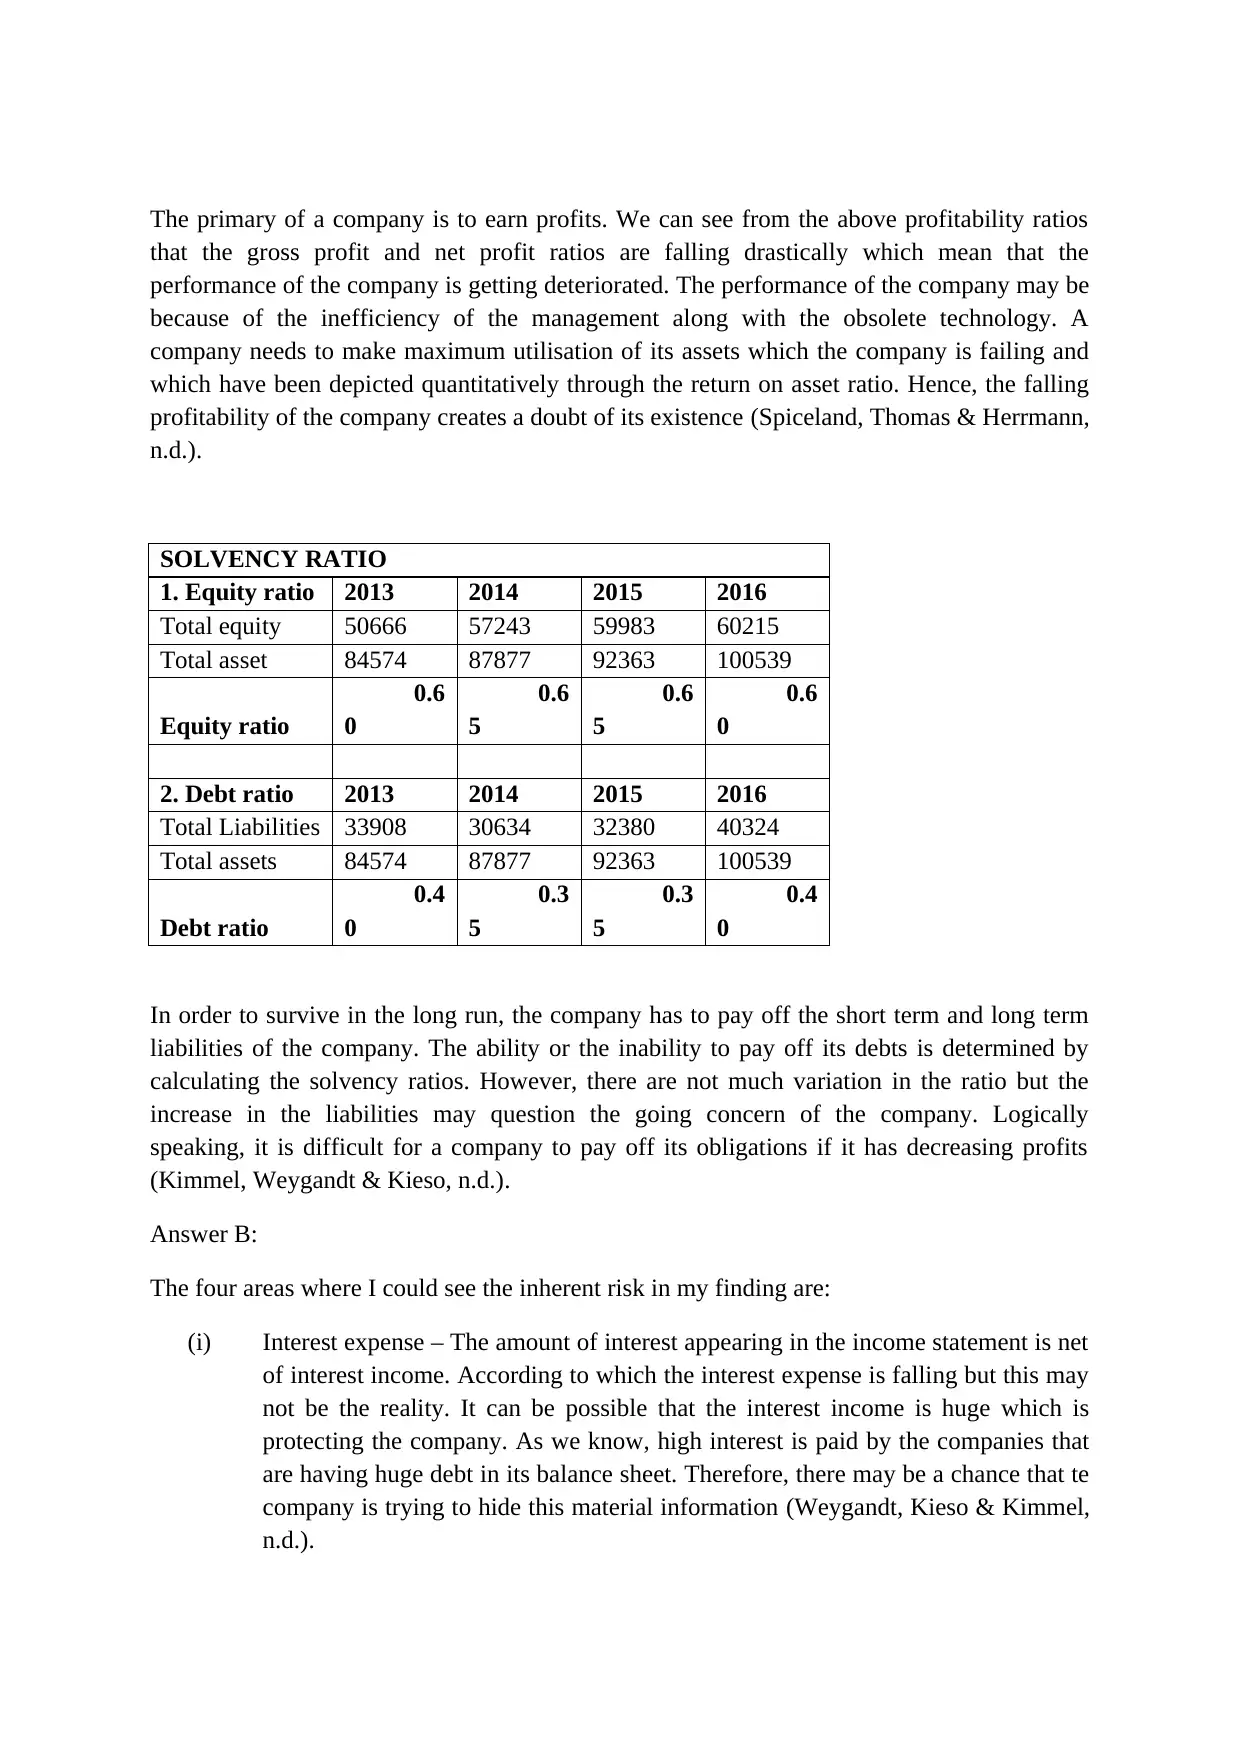
This auditing assignment provides a comparative financial analysis of income statements and balance sheets, including horizontal analysis to identify trends. It calculates and interprets various financial ratios, such as current, quick, total asset turnover, inventory turnover, gross profit, net profit, return on assets, return on equity, equity, and debt ratios over a period of time. The assignment assesses liquidity, activity, profitability, and solvency. The analysis identifies potential risks within the financial data, focusing on interest expense, intangibles, revenue and gross profit discrepancies, and the reliance on estimated figures. The document references key financial accounting principles and includes a list of cited sources for further study. This assignment is a valuable resource for students on Desklib, offering a comprehensive understanding of financial statement analysis and auditing principles.
tabler-icon-diamond-filled.svg

Contribute Materials

Your contribution can guide someone’s learning journey. Share your documents today.
Document Page
AUDITING
tabler-icon-diamond-filled.svg

Secure Best Marks with AI Grader

Need help grading? Try our AI Grader for instant feedback on your assignments.
Document Page
Answere A
A1: Horizontal analysis of income statement and balance sheet.
COMPARITIVE INCOME STATEMENT
INCREASE/DECREASE
PARTICULARS 2016 2015 AMOUNT PERCENTAGE
Revenue 92584 108923 -16339 -15.00
Cost of goods sold 86103 98031 -11928 -12.17
GROSS PROFIT 6481 10892 -4411 -40.50
Depreciation 2000 2000 0 -
Amortisation 750 750 0 -
Interest expense 1500 1800 -300 -16.67
Other expense 1850 1850 0 -
PROFIT BEFORE TAX 381 4492 -4111 -91.52
Tax 149 1752 -1603 -91.50
PROFIT AFTER TAX 232 2740 -2508 -91.53
COMPARITIVE BALANCE SHEET
PARTICULARS INCREASE/DECREASE
2016 2015 AMOUNT PERENTAGE
ASSET
Current assets 65662 55130 10532 19.10
Investments 87 87 0 -
Plant 20515 22179 -1664 -7.50
Intangibles 13,160 13852 -692 -5.00
Others 1,115 1115 0 -
Total asset 1,00,539 92363 8176 8.85
LIABILITIES
Current liabilities 32334 27734 4600 16.59
Noncurrent liabilities 7990 4646 3344 71.98
Total liabilities 40324 32380 7944 24.53
SHAREHOLDERS EQUITY
Share capital 26202 26202 0 -
Reserves 11187 11187 0 -
Retained earning 22826 22594 232 1.03
Total shareholders’ equity 60215 59983 232 0.39
Note: All the amounts are in thousands.
Document Page
A2:
1.LIQUIDITY RATIO
1. Current ratio 2013 2014 2015 2016
Current asset 42102 48116 55130 65662
Current liability 26039 23018 27734 32334
Current ratio
1.6
2
2.0
9
1.9
9
2.0
3
2. Quick ratio 2013 2014 2015 2016
Current asset 42012 48116 55130 65662
Less: Inventories 19784 22752 26164 31397
Current liabilities 26039 23018 27734 32334
Quick ratio
0.8
5
1.1
0
1.0
4
1.0
6
The liquidity ratio is the calculated in order to determine the ability of the company to pay off
the short term debts of the company (Piper, 2015). The current ratio is calculated to see that
whether the company is able to pay off the current liabilities of the company using the current
assets. The most favourable current ratio is considered to be 2. Here, it can be observed that
the current ratio is expected to be the higher in the year 2016 which is a good sign. The
company’s current ratio was the best in 2014 and in 2015 there was a decline (Izhar &
Hontoir, 2001). Since, the 2016 figures are estimated we can say if the estimations are correct
then the current ratio is very good.
The quick ratio is another type of liquidity ratio but in this it excludes inventories. As we
know, that inventories do not fetch us the cash instantly. So, many times it is excluded from
the aspect of current assets. The trend of quick ratio is also similar to that of current ratio.
ACTIVITY RATIO
1. Total asset turnover
ratio 2013 2014 2015 2016
Sales 112500 115875 108923 92584
Total asset 84574 87877 92363 100539
Total asset turnover
ratio
1
.33
1
.32
1
.18
0
.92
2. Inventory turnover
ratio 2013 2014 2015 2016
Cost of goods sold 90000 98494 98031 86103
Average inventory 21268 24458
28780.
5
Inventory turnover
ratio
4
.63
4
.01
2
.99
Document Page
Average inventor is the average of opening and closing inventory. However, we donot have
the information of opening inventory of 2013.
There is a requirement of various assets in the company in order to carry out operations. It
becomes difficult for the company to have higher returns if there is an obsolete technology
and no replacement of old machineries. The assets should be used in the best possible manner
to higher the turnover of the company (Loughran, 2011). It has been observed that the total
asset turnover of the company is declining which is considered to be unfavourable. It is also
dependent on the efficiency of the management and therefore, activity ratios are also called
efficiency ratio.
The inventory turnover ratio is calculated to see how many times the inventory is sold during
a given time span. This ratio is considered higher the better. The 2016 figure shows a great
fall which is unfavourable for the company as it indirectly shows the fall in the revenue of the
year (Harrison, Horngren & Thomas, n.d.).
PROFITABILITY RATIO
1. Gross profit ratio
(%) 2013 2014 2015 2016
Gross profit 22500 17381 10892 6481
Sales 112500 115875 108923 92584
Gross profit ratio
20.
00
15.
00
10.
00
7.
00
2.Net profit ratio
(%) 2013 2014 2015 2016
Net profit 9455 6577 2740 232
Sales 112500 115875 108923 92584
Net profit ratio
8.
40
5.
68
2.
52
0.
25
3. Return on assets 2013 2014 2015 2016
Net income 9455 6577 2740 232
Total assets 84574 87877 92363 100539
Return on asset
0.11179
6
0.07484
3
0.02966
6
0.00230
8
4. Return on equity 2013 2014 2015 2016
Net income 9455 6577 2740 232
Total equity 50666 57243 59983 60215
Return on equity
0.18661
4
0.11489
6 0.04568
0.00385
3
tabler-icon-diamond-filled.svg

Secure Best Marks with AI Grader

Need help grading? Try our AI Grader for instant feedback on your assignments.
Document Page
The primary of a company is to earn profits. We can see from the above profitability ratios
that the gross profit and net profit ratios are falling drastically which mean that the
performance of the company is getting deteriorated. The performance of the company may be
because of the inefficiency of the management along with the obsolete technology. A
company needs to make maximum utilisation of its assets which the company is failing and
which have been depicted quantitatively through the return on asset ratio. Hence, the falling
profitability of the company creates a doubt of its existence (Spiceland, Thomas & Herrmann,
n.d.).
SOLVENCY RATIO
1. Equity ratio 2013 2014 2015 2016
Total equity 50666 57243 59983 60215
Total asset 84574 87877 92363 100539
Equity ratio
0.6
0
0.6
5
0.6
5
0.6
0
2. Debt ratio 2013 2014 2015 2016
Total Liabilities 33908 30634 32380 40324
Total assets 84574 87877 92363 100539
Debt ratio
0.4
0
0.3
5
0.3
5
0.4
0
In order to survive in the long run, the company has to pay off the short term and long term
liabilities of the company. The ability or the inability to pay off its debts is determined by
calculating the solvency ratios. However, there are not much variation in the ratio but the
increase in the liabilities may question the going concern of the company. Logically
speaking, it is difficult for a company to pay off its obligations if it has decreasing profits
(Kimmel, Weygandt & Kieso, n.d.).
Answer B:
The four areas where I could see the inherent risk in my finding are:
(i) Interest expense – The amount of interest appearing in the income statement is net
of interest income. According to which the interest expense is falling but this may
not be the reality. It can be possible that the interest income is huge which is
protecting the company. As we know, high interest is paid by the companies that
are having huge debt in its balance sheet. Therefore, there may be a chance that te
company is trying to hide this material information (Weygandt, Kieso & Kimmel,
n.d.).
Document Page
(ii) In the balance sheet of the company we can observe that the amount of intangibles
is falling. Intangibles may include patents to produce the gadgets or the goodwill
of the company (Libby, Libby & Short, 2014). However, if the patent is expiring
then the company may be overpowered by the competitors who may lead to
closure also. However, loss of reputation is a great risk as there are many
companies in the industry that are ready to take advantage of such situations.
(iii) It has been observed that there is 15% fall in the revenues. However, the fall in the
gross profit is 40%. It is a matter of concern that how is it possible that a slight fall
in revenues is affecting the gross profit at such a higher rate (Ittelson, 2009). It is
suspected that the company may have made any adjustments in order to avoid tax.
(iv) The values taken for the year 2016 are all estimated figures. Therefore, there lies a
lack of clarity about the estimates. It is easier to evaluate the performance and
analyse it with the actual data than the estimated data as there will always lie an
ambiguity (Warren., 2015).
REFERENCES:
Harrison, W., Horngren, C., & Thomas, C. Financial accounting.
Ittelson, T. (2009). Financial statements. Franklin Lakes, NJ: Career Press.
Izhar, R., & Hontoir, J. (2001). Accounting, costing, and management. Oxford: Oxford
University Press.
Kimmel, P., Weygandt, J., & Kieso, D. Financial Accounting.
Libby, R., Libby, P., & Short, D. (2014). Financial accounting. New York, NY: McGraw-
Hill/Irwin.
Loughran, M. (2011). Financial accounting for dummies. Hoboken (NJ): Wiley.
Piper, M. (2015). Accounting made simple. [United States]: [CreateSpace Pub.].
Spiceland, J., Thomas, W., & Herrmann, D. Financial accounting.
Warren. (2015). Financial Accounting. Cengage Learning.
Weygandt, J., Kieso, D., & Kimmel, P. Financial accounting.
Document Page
chevron_up_icon
1 out of 7
circle_padding
hide_on_mobile
zoom_out_icon
logo.png

Your All-in-One AI-Powered Toolkit for Academic Success.

Available 24*7 on WhatsApp / Email

[object Object]