Financial Analysis of Harvey Norman: Corporate Finance Report
VerifiedAdded on 2021/06/16
|12
|2939
|43
Report
AI Summary
This report provides a comprehensive analysis of Harvey Norman's corporate finance structure. It begins with an introduction to the company and its business operations, followed by an examination of the cost of equity using the Capital Asset Pricing Model (CAPM) and dividend growth model, and the cost of debt. The report then calculates the Weighted Average Cost of Capital (WACC) and analyzes gearing ratios, including debt-to-equity, debt, equity, and times interest earned. A detailed assessment of Harvey Norman's capital structure is presented, highlighting the high equity component and associated risks. The report concludes with recommendations to improve the company's capital structure, advocating for a reduction in equity and an increase in debt to stabilize the financial position, and suggesting the adoption of a net income approach. Appendices include detailed calculations for cost of equity, cost of debt, and WACC, providing a complete financial overview of the company's performance.

CORPORATE FINANCE
TABLE OF CONTENT
TABLE OF CONTENT
Paraphrase This Document
Need a fresh take? Get an instant paraphrase of this document with our AI Paraphraser
S
1. INTRODUCTION..................................................................................................................3
2. Company’s Introduction.........................................................................................................3
3. Findings..................................................................................................................................3
3.1 Cost of Equity...................................................................................................................3
3.1.1 Capital Asset Pricing Model......................................................................................3
3.1.2 Dividend Growth Model............................................................................................4
3.2 Cost of Debt......................................................................................................................4
4. Weighted Average Cost of Capital........................................................................................4
5. GEARING RATIOS..............................................................................................................5
5.1 Debt to equity ratio.......................................................................................................5
5.2 Debt Ratio.....................................................................................................................5
5.3 Equity Ratio..................................................................................................................5
5.4 Times Interest Earned...................................................................................................5
6. Capital structure.....................................................................................................................6
7. recommendation.....................................................................................................................6
8. CONCLUSION......................................................................................................................7
APPENDICES............................................................................................................................8
REFERENCES.........................................................................................................................11
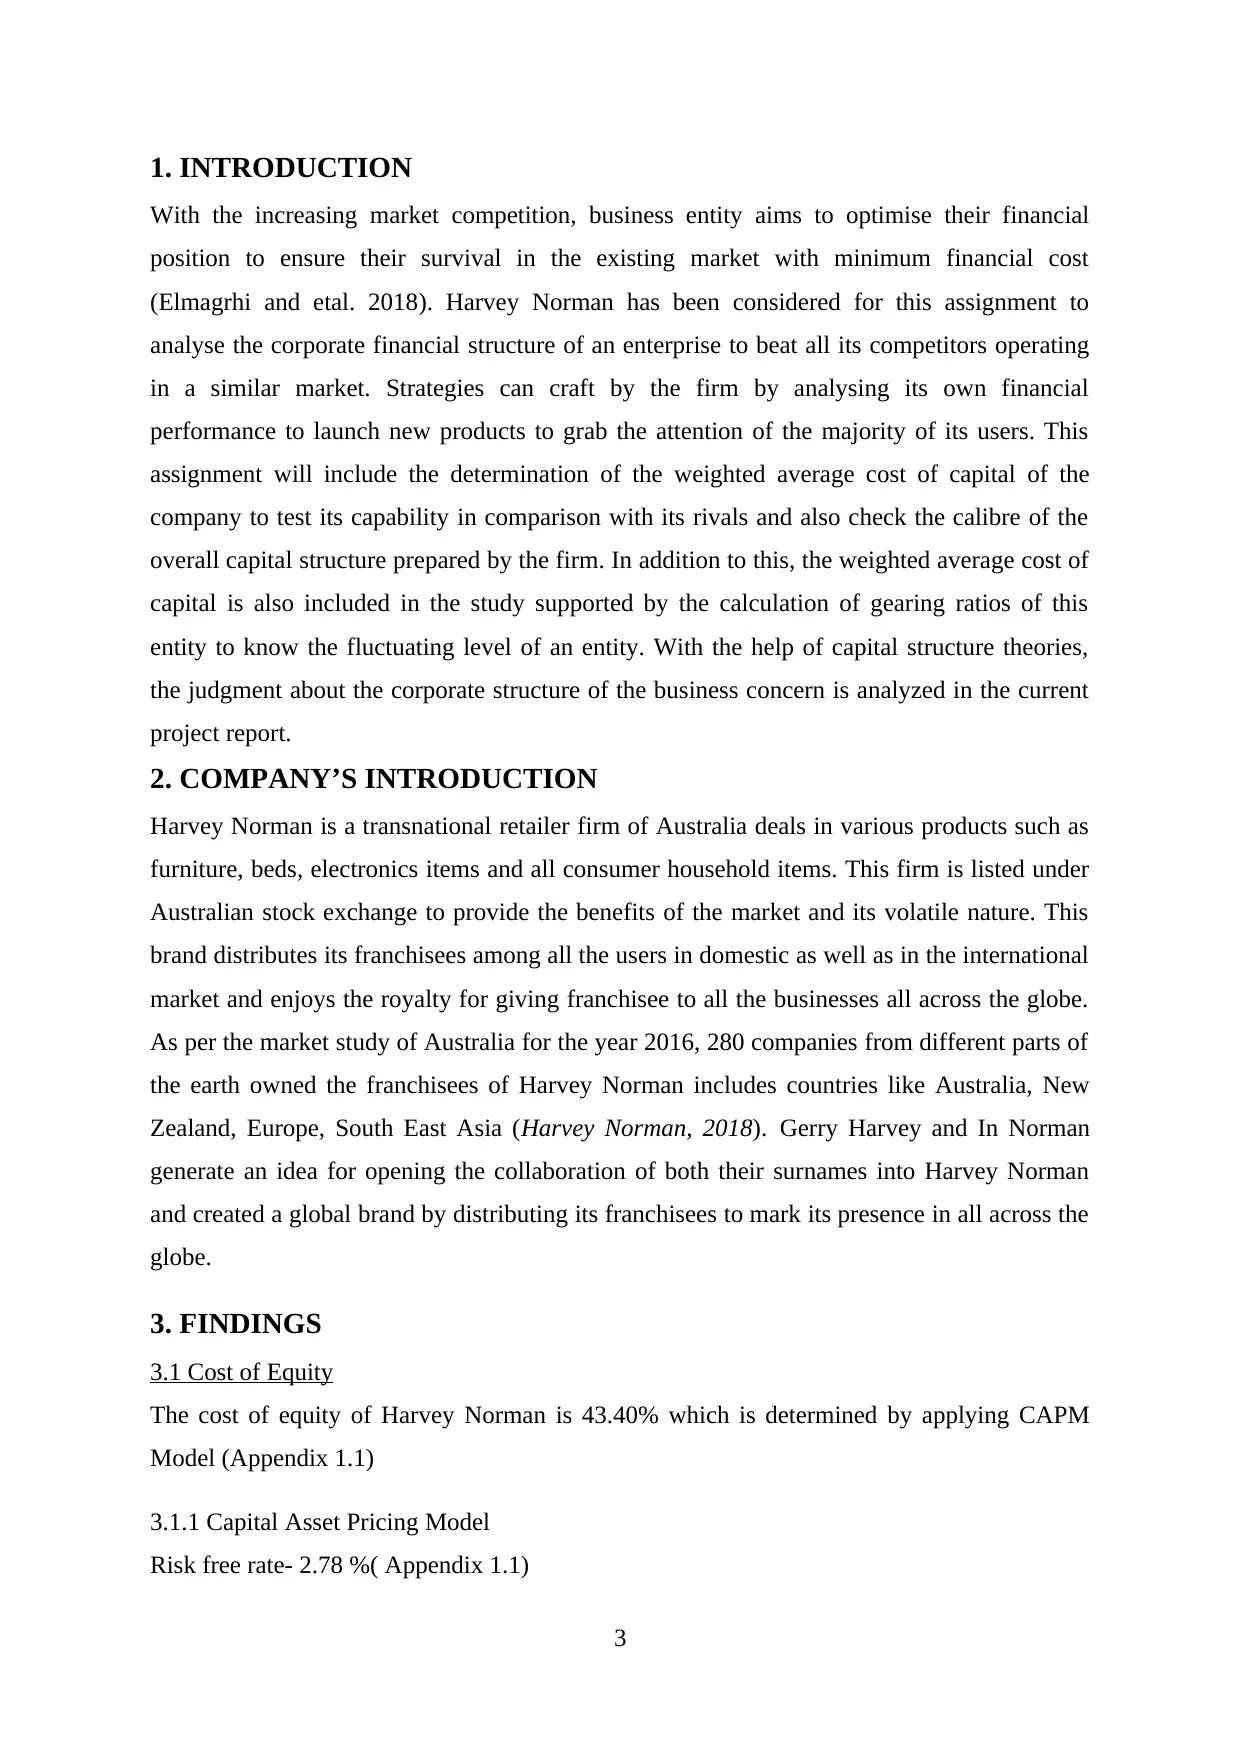
1. INTRODUCTION
With the increasing market competition, business entity aims to optimise their financial
position to ensure their survival in the existing market with minimum financial cost
(Elmagrhi and etal. 2018). Harvey Norman has been considered for this assignment to
analyse the corporate financial structure of an enterprise to beat all its competitors operating
in a similar market. Strategies can craft by the firm by analysing its own financial
performance to launch new products to grab the attention of the majority of its users. This
assignment will include the determination of the weighted average cost of capital of the
company to test its capability in comparison with its rivals and also check the calibre of the
overall capital structure prepared by the firm. In addition to this, the weighted average cost of
capital is also included in the study supported by the calculation of gearing ratios of this
entity to know the fluctuating level of an entity. With the help of capital structure theories,
the judgment about the corporate structure of the business concern is analyzed in the current
project report.
2. COMPANY’S INTRODUCTION
Harvey Norman is a transnational retailer firm of Australia deals in various products such as
furniture, beds, electronics items and all consumer household items. This firm is listed under
Australian stock exchange to provide the benefits of the market and its volatile nature. This
brand distributes its franchisees among all the users in domestic as well as in the international
market and enjoys the royalty for giving franchisee to all the businesses all across the globe.
As per the market study of Australia for the year 2016, 280 companies from different parts of
the earth owned the franchisees of Harvey Norman includes countries like Australia, New
Zealand, Europe, South East Asia (Harvey Norman, 2018). Gerry Harvey and In Norman
generate an idea for opening the collaboration of both their surnames into Harvey Norman
and created a global brand by distributing its franchisees to mark its presence in all across the
globe.
3. FINDINGS
3.1 Cost of Equity
The cost of equity of Harvey Norman is 43.40% which is determined by applying CAPM
Model (Appendix 1.1)
3.1.1 Capital Asset Pricing Model
Risk free rate- 2.78 %( Appendix 1.1)
3
⊘ This is a preview!⊘
Do you want full access?
Subscribe today to unlock all pages.
Trusted by 1+ million students worldwide
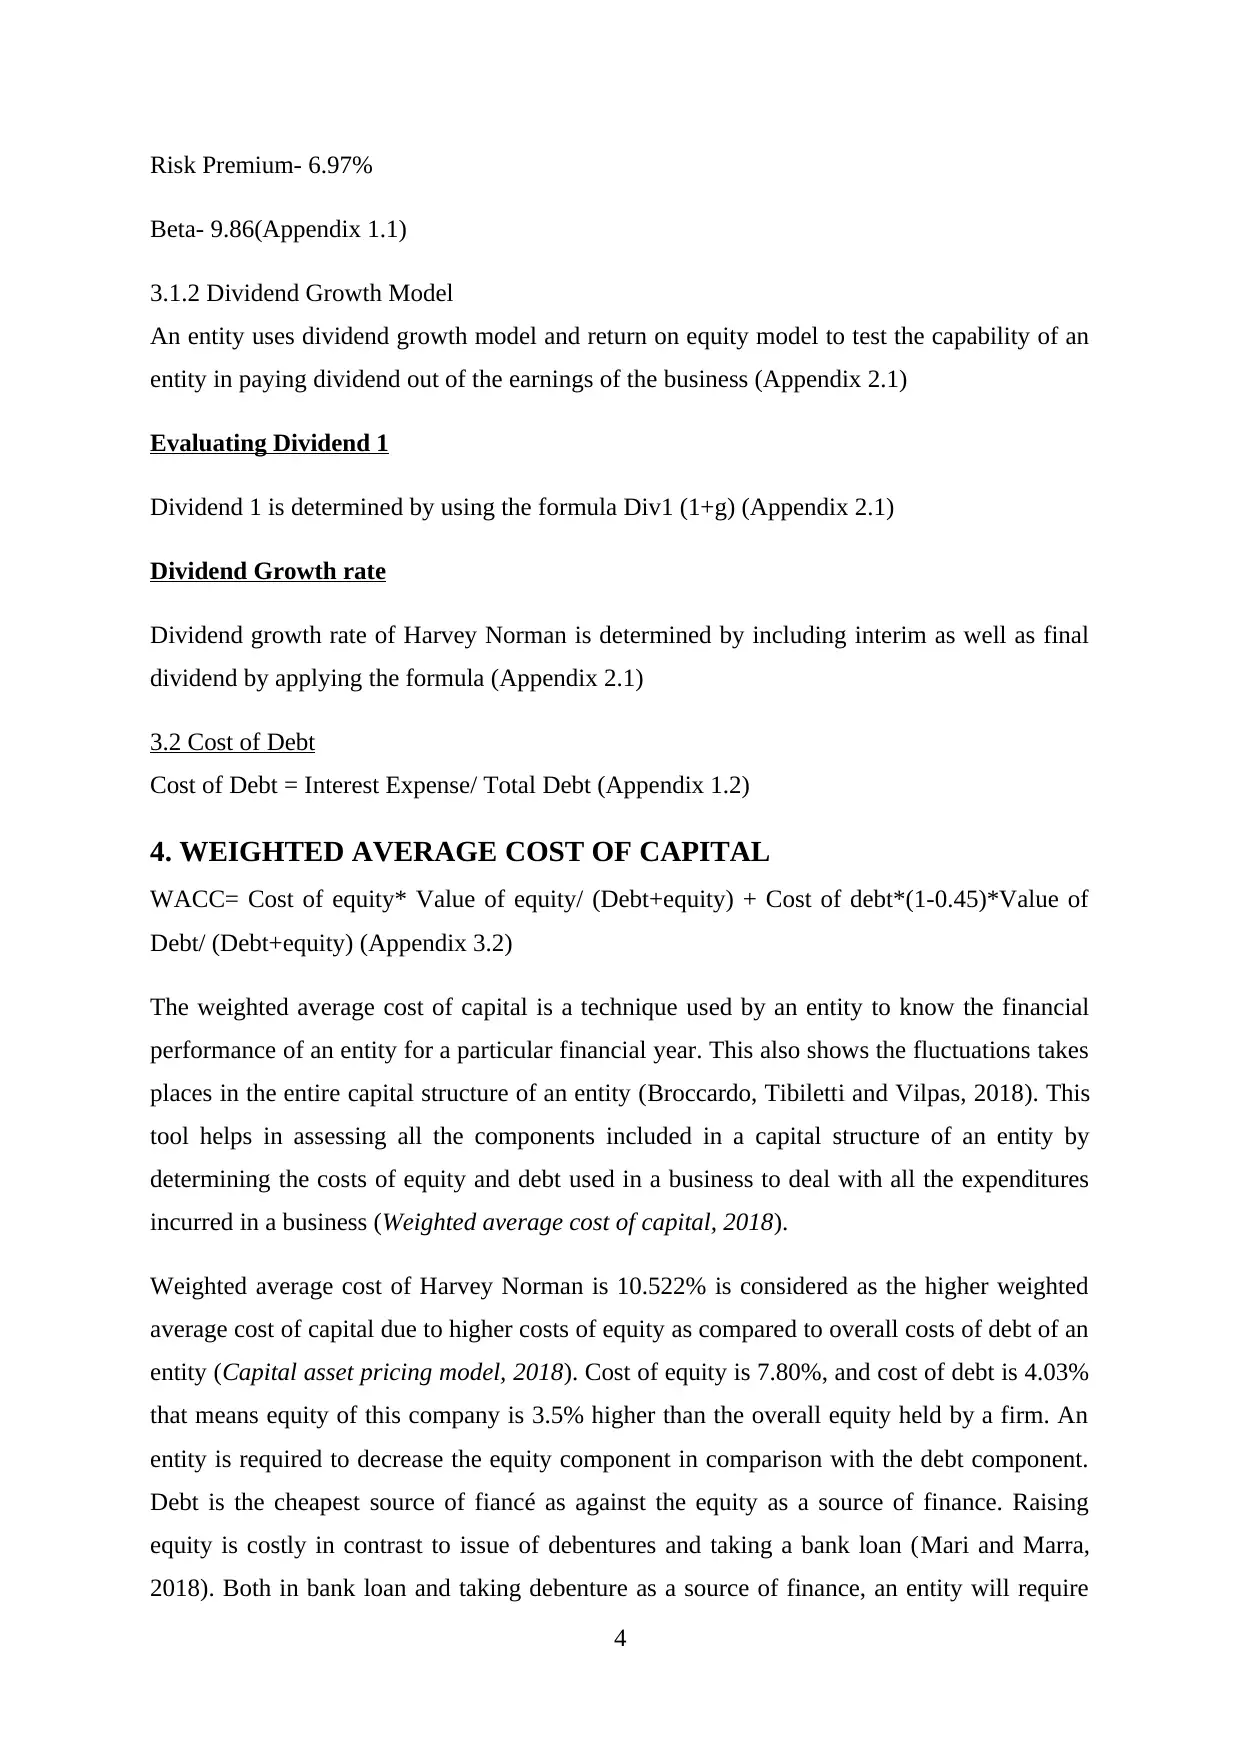
Risk Premium- 6.97%
Beta- 9.86(Appendix 1.1)
3.1.2 Dividend Growth Model
An entity uses dividend growth model and return on equity model to test the capability of an
entity in paying dividend out of the earnings of the business (Appendix 2.1)
Evaluating Dividend 1
Dividend 1 is determined by using the formula Div1 (1+g) (Appendix 2.1)
Dividend Growth rate
Dividend growth rate of Harvey Norman is determined by including interim as well as final
dividend by applying the formula (Appendix 2.1)
3.2 Cost of Debt
Cost of Debt = Interest Expense/ Total Debt (Appendix 1.2)
4. WEIGHTED AVERAGE COST OF CAPITAL
WACC= Cost of equity* Value of equity/ (Debt+equity) + Cost of debt*(1-0.45)*Value of
Debt/ (Debt+equity) (Appendix 3.2)
The weighted average cost of capital is a technique used by an entity to know the financial
performance of an entity for a particular financial year. This also shows the fluctuations takes
places in the entire capital structure of an entity (Broccardo, Tibiletti and Vilpas, 2018). This
tool helps in assessing all the components included in a capital structure of an entity by
determining the costs of equity and debt used in a business to deal with all the expenditures
incurred in a business (Weighted average cost of capital, 2018).
Weighted average cost of Harvey Norman is 10.522% is considered as the higher weighted
average cost of capital due to higher costs of equity as compared to overall costs of debt of an
entity (Capital asset pricing model, 2018). Cost of equity is 7.80%, and cost of debt is 4.03%
that means equity of this company is 3.5% higher than the overall equity held by a firm. An
entity is required to decrease the equity component in comparison with the debt component.
Debt is the cheapest source of fiancé as against the equity as a source of finance. Raising
equity is costly in contrast to issue of debentures and taking a bank loan (Mari and Marra,
2018). Both in bank loan and taking debenture as a source of finance, an entity will require
4
Paraphrase This Document
Need a fresh take? Get an instant paraphrase of this document with our AI Paraphraser
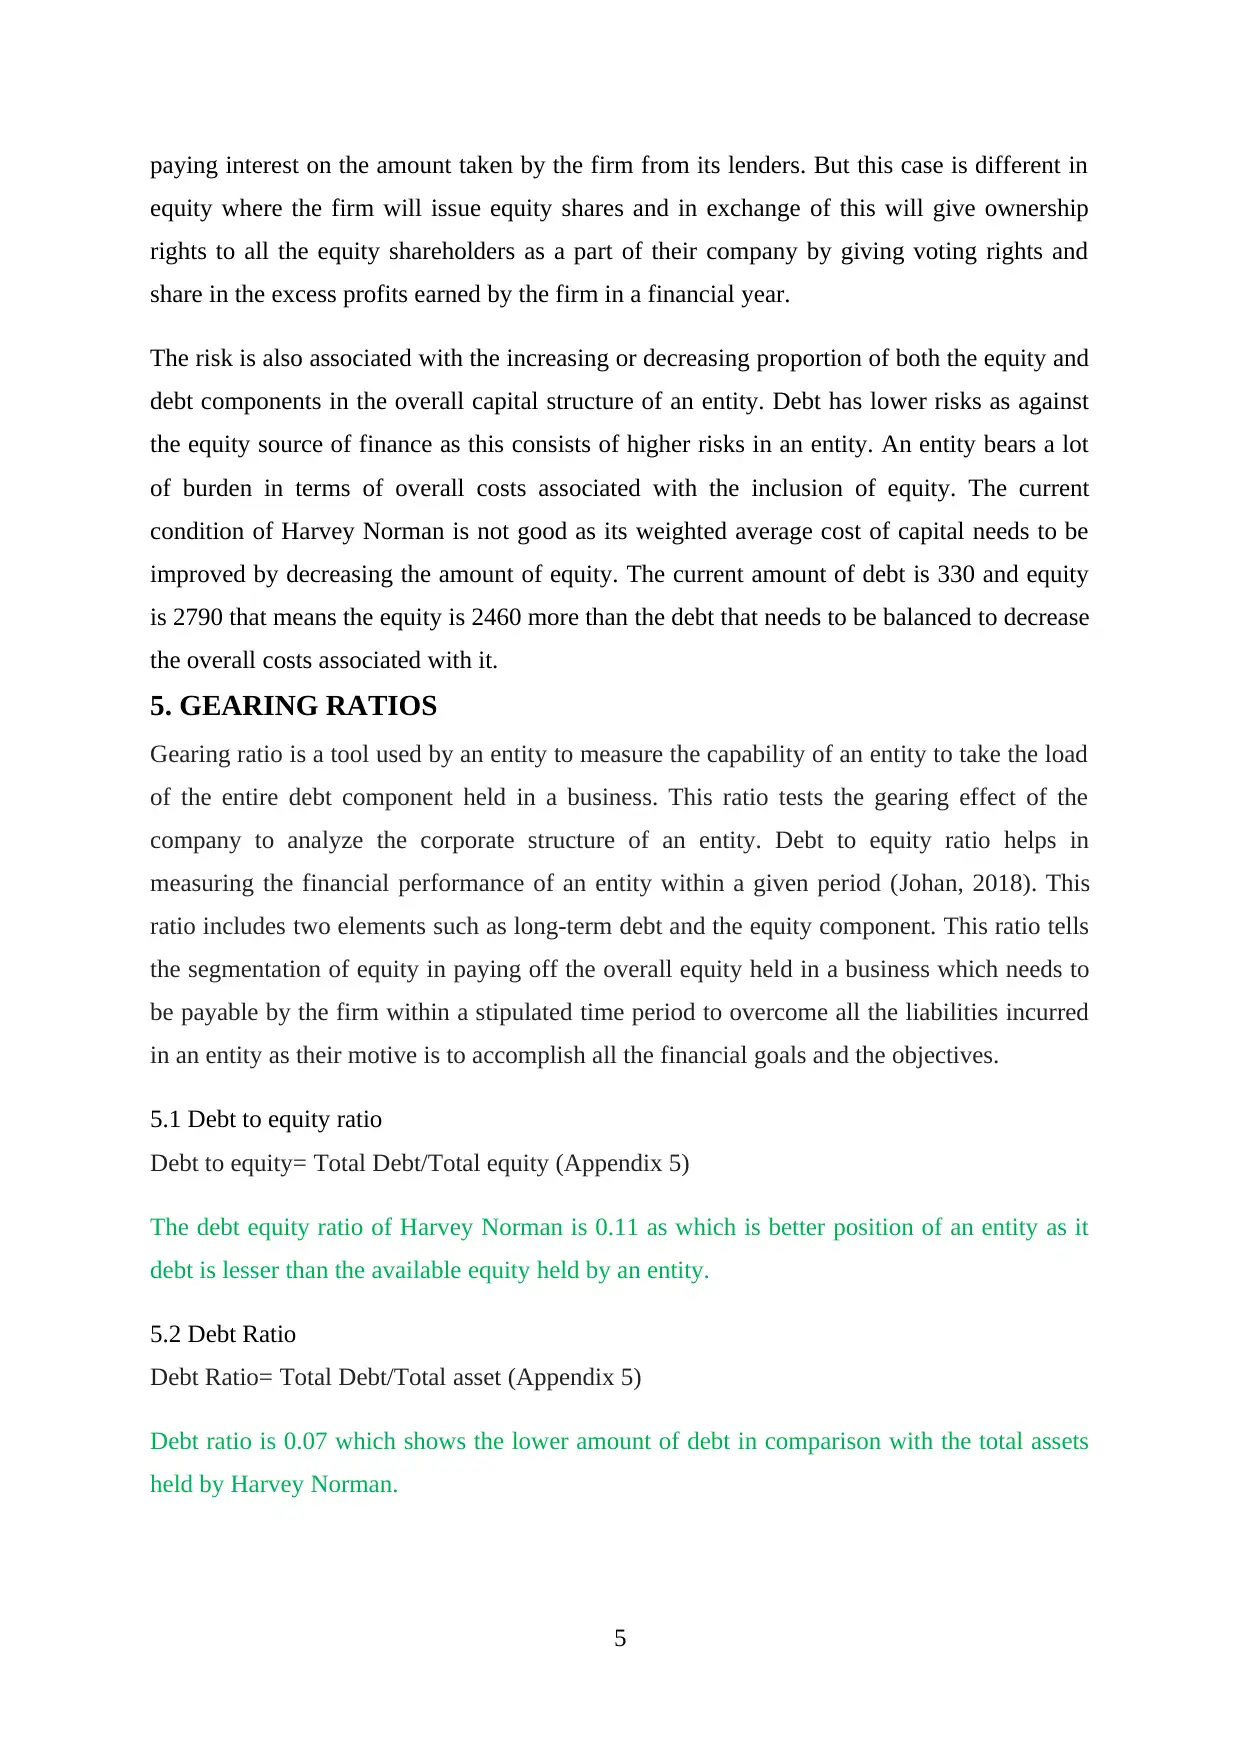
paying interest on the amount taken by the firm from its lenders. But this case is different in
equity where the firm will issue equity shares and in exchange of this will give ownership
rights to all the equity shareholders as a part of their company by giving voting rights and
share in the excess profits earned by the firm in a financial year.
The risk is also associated with the increasing or decreasing proportion of both the equity and
debt components in the overall capital structure of an entity. Debt has lower risks as against
the equity source of finance as this consists of higher risks in an entity. An entity bears a lot
of burden in terms of overall costs associated with the inclusion of equity. The current
condition of Harvey Norman is not good as its weighted average cost of capital needs to be
improved by decreasing the amount of equity. The current amount of debt is 330 and equity
is 2790 that means the equity is 2460 more than the debt that needs to be balanced to decrease
the overall costs associated with it.
5. GEARING RATIOS
Gearing ratio is a tool used by an entity to measure the capability of an entity to take the load
of the entire debt component held in a business. This ratio tests the gearing effect of the
company to analyze the corporate structure of an entity. Debt to equity ratio helps in
measuring the financial performance of an entity within a given period (Johan, 2018). This
ratio includes two elements such as long-term debt and the equity component. This ratio tells
the segmentation of equity in paying off the overall equity held in a business which needs to
be payable by the firm within a stipulated time period to overcome all the liabilities incurred
in an entity as their motive is to accomplish all the financial goals and the objectives.
5.1 Debt to equity ratio
Debt to equity= Total Debt/Total equity (Appendix 5)
The debt equity ratio of Harvey Norman is 0.11 as which is better position of an entity as it
debt is lesser than the available equity held by an entity.
5.2 Debt Ratio
Debt Ratio= Total Debt/Total asset (Appendix 5)
Debt ratio is 0.07 which shows the lower amount of debt in comparison with the total assets
held by Harvey Norman.
5
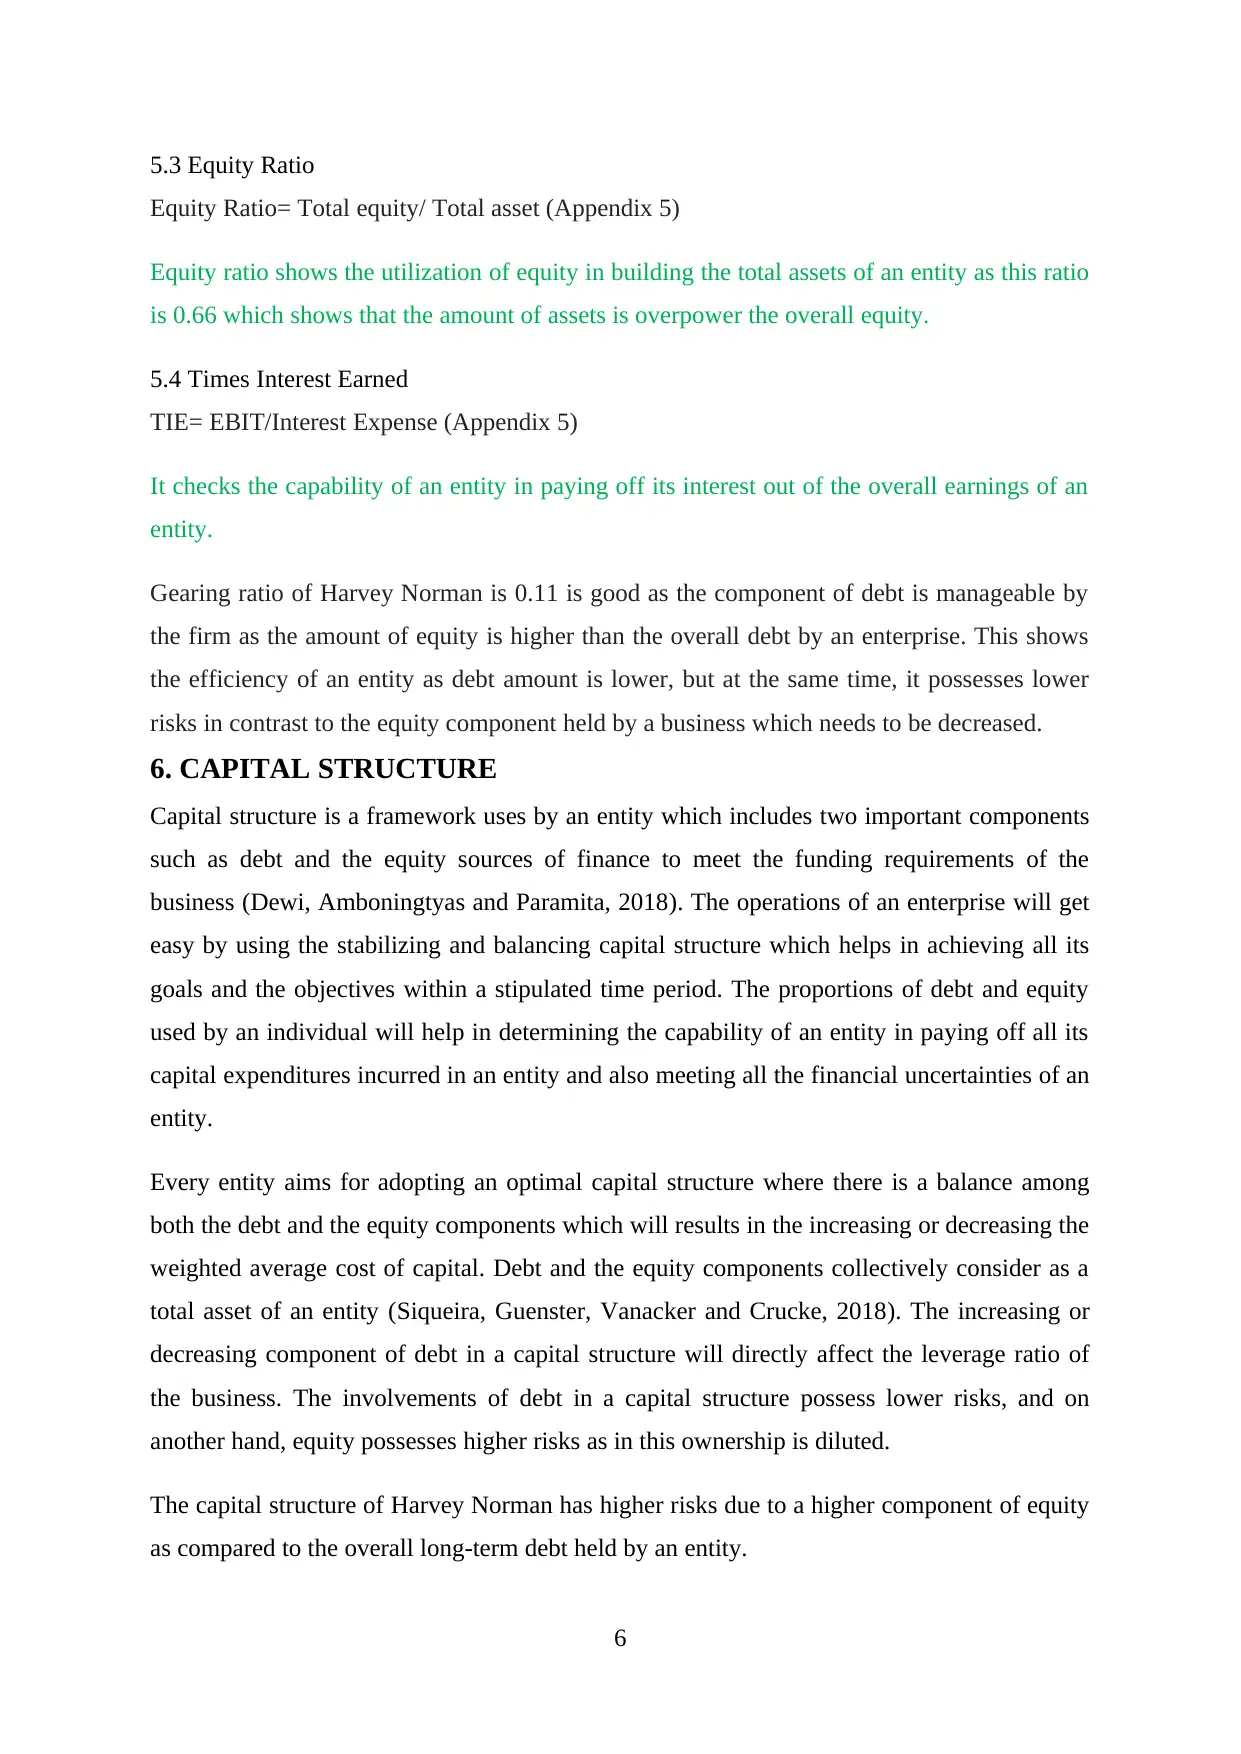
5.3 Equity Ratio
Equity Ratio= Total equity/ Total asset (Appendix 5)
Equity ratio shows the utilization of equity in building the total assets of an entity as this ratio
is 0.66 which shows that the amount of assets is overpower the overall equity.
5.4 Times Interest Earned
TIE= EBIT/Interest Expense (Appendix 5)
It checks the capability of an entity in paying off its interest out of the overall earnings of an
entity.
Gearing ratio of Harvey Norman is 0.11 is good as the component of debt is manageable by
the firm as the amount of equity is higher than the overall debt by an enterprise. This shows
the efficiency of an entity as debt amount is lower, but at the same time, it possesses lower
risks in contrast to the equity component held by a business which needs to be decreased.
6. CAPITAL STRUCTURE
Capital structure is a framework uses by an entity which includes two important components
such as debt and the equity sources of finance to meet the funding requirements of the
business (Dewi, Amboningtyas and Paramita, 2018). The operations of an enterprise will get
easy by using the stabilizing and balancing capital structure which helps in achieving all its
goals and the objectives within a stipulated time period. The proportions of debt and equity
used by an individual will help in determining the capability of an entity in paying off all its
capital expenditures incurred in an entity and also meeting all the financial uncertainties of an
entity.
Every entity aims for adopting an optimal capital structure where there is a balance among
both the debt and the equity components which will results in the increasing or decreasing the
weighted average cost of capital. Debt and the equity components collectively consider as a
total asset of an entity (Siqueira, Guenster, Vanacker and Crucke, 2018). The increasing or
decreasing component of debt in a capital structure will directly affect the leverage ratio of
the business. The involvements of debt in a capital structure possess lower risks, and on
another hand, equity possesses higher risks as in this ownership is diluted.
The capital structure of Harvey Norman has higher risks due to a higher component of equity
as compared to the overall long-term debt held by an entity.
6
⊘ This is a preview!⊘
Do you want full access?
Subscribe today to unlock all pages.
Trusted by 1+ million students worldwide
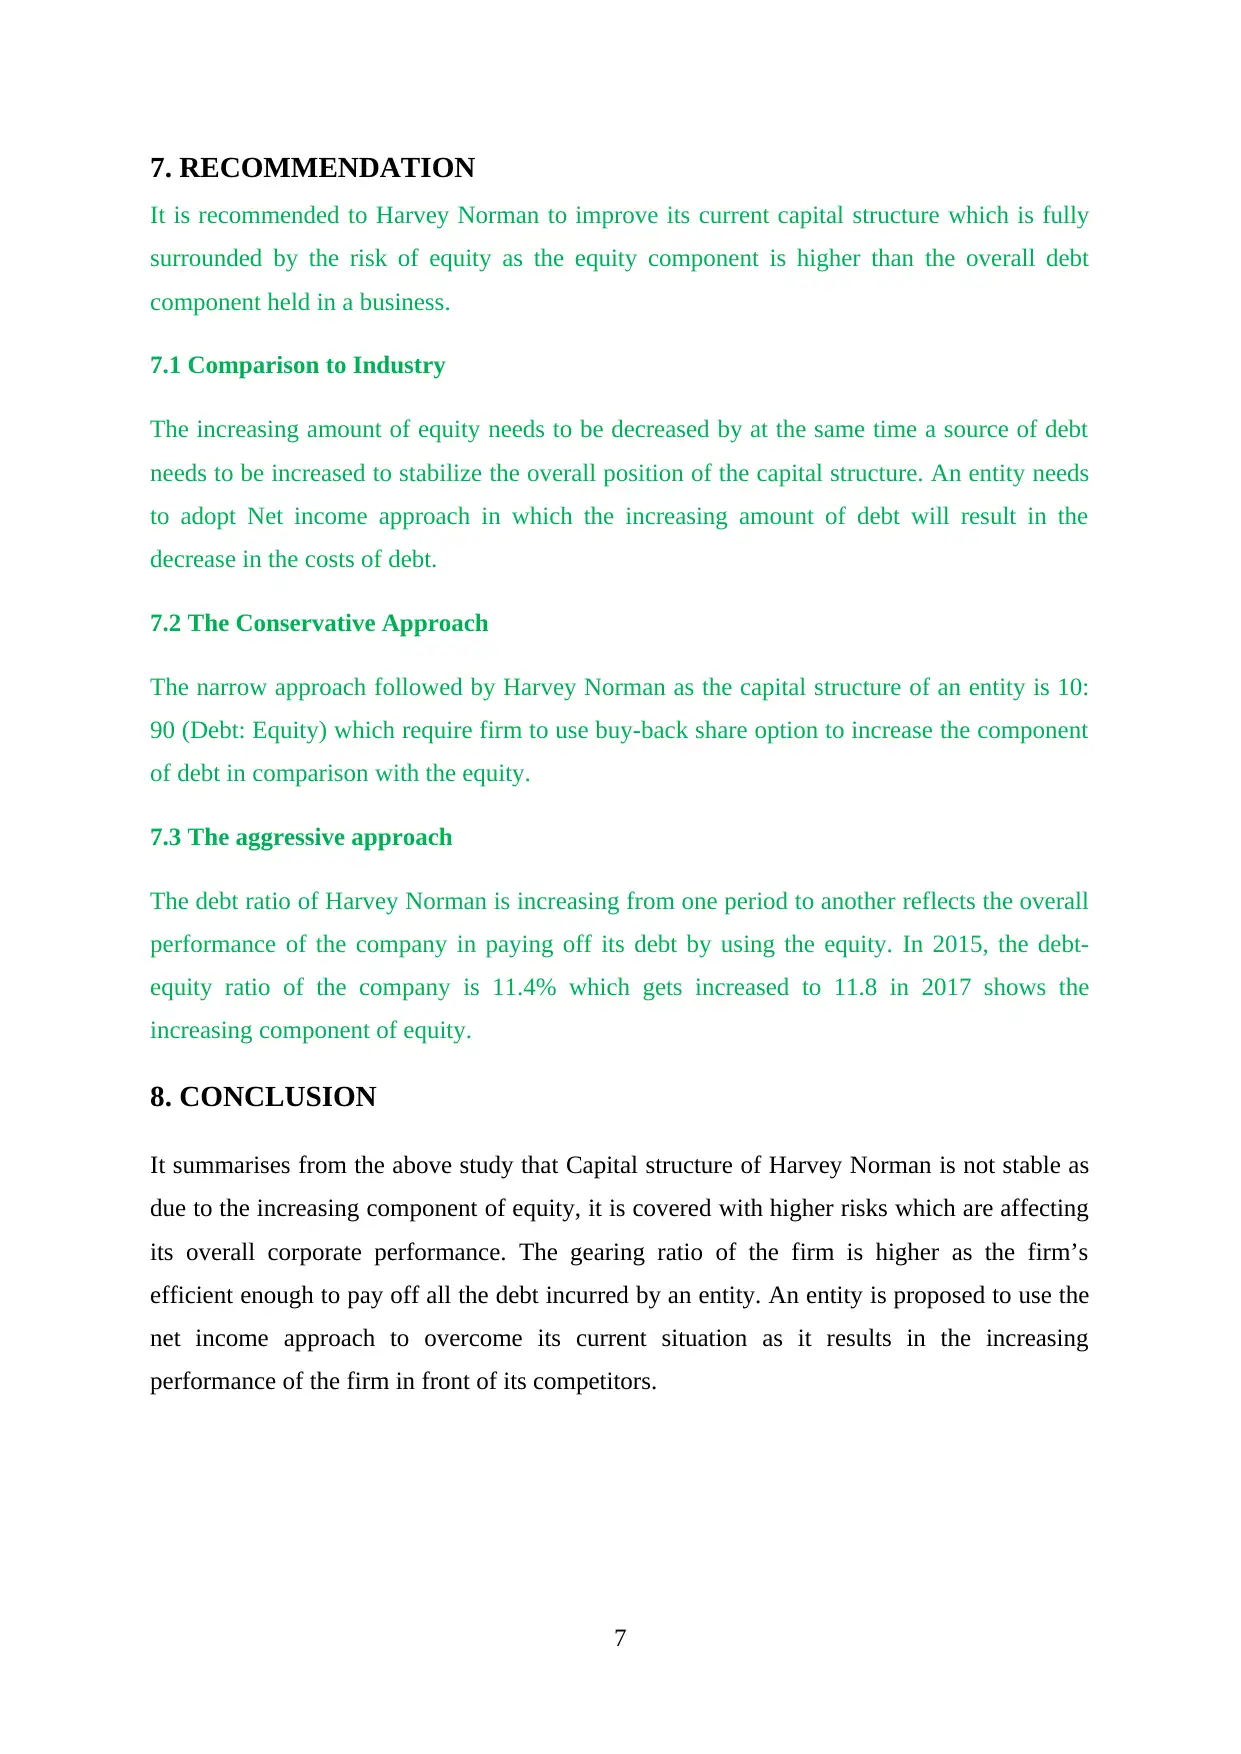
7. RECOMMENDATION
It is recommended to Harvey Norman to improve its current capital structure which is fully
surrounded by the risk of equity as the equity component is higher than the overall debt
component held in a business.
7.1 Comparison to Industry
The increasing amount of equity needs to be decreased by at the same time a source of debt
needs to be increased to stabilize the overall position of the capital structure. An entity needs
to adopt Net income approach in which the increasing amount of debt will result in the
decrease in the costs of debt.
7.2 The Conservative Approach
The narrow approach followed by Harvey Norman as the capital structure of an entity is 10:
90 (Debt: Equity) which require firm to use buy-back share option to increase the component
of debt in comparison with the equity.
7.3 The aggressive approach
The debt ratio of Harvey Norman is increasing from one period to another reflects the overall
performance of the company in paying off its debt by using the equity. In 2015, the debt-
equity ratio of the company is 11.4% which gets increased to 11.8 in 2017 shows the
increasing component of equity.
8. CONCLUSION
It summarises from the above study that Capital structure of Harvey Norman is not stable as
due to the increasing component of equity, it is covered with higher risks which are affecting
its overall corporate performance. The gearing ratio of the firm is higher as the firm’s
efficient enough to pay off all the debt incurred by an entity. An entity is proposed to use the
net income approach to overcome its current situation as it results in the increasing
performance of the firm in front of its competitors.
7
Paraphrase This Document
Need a fresh take? Get an instant paraphrase of this document with our AI Paraphraser
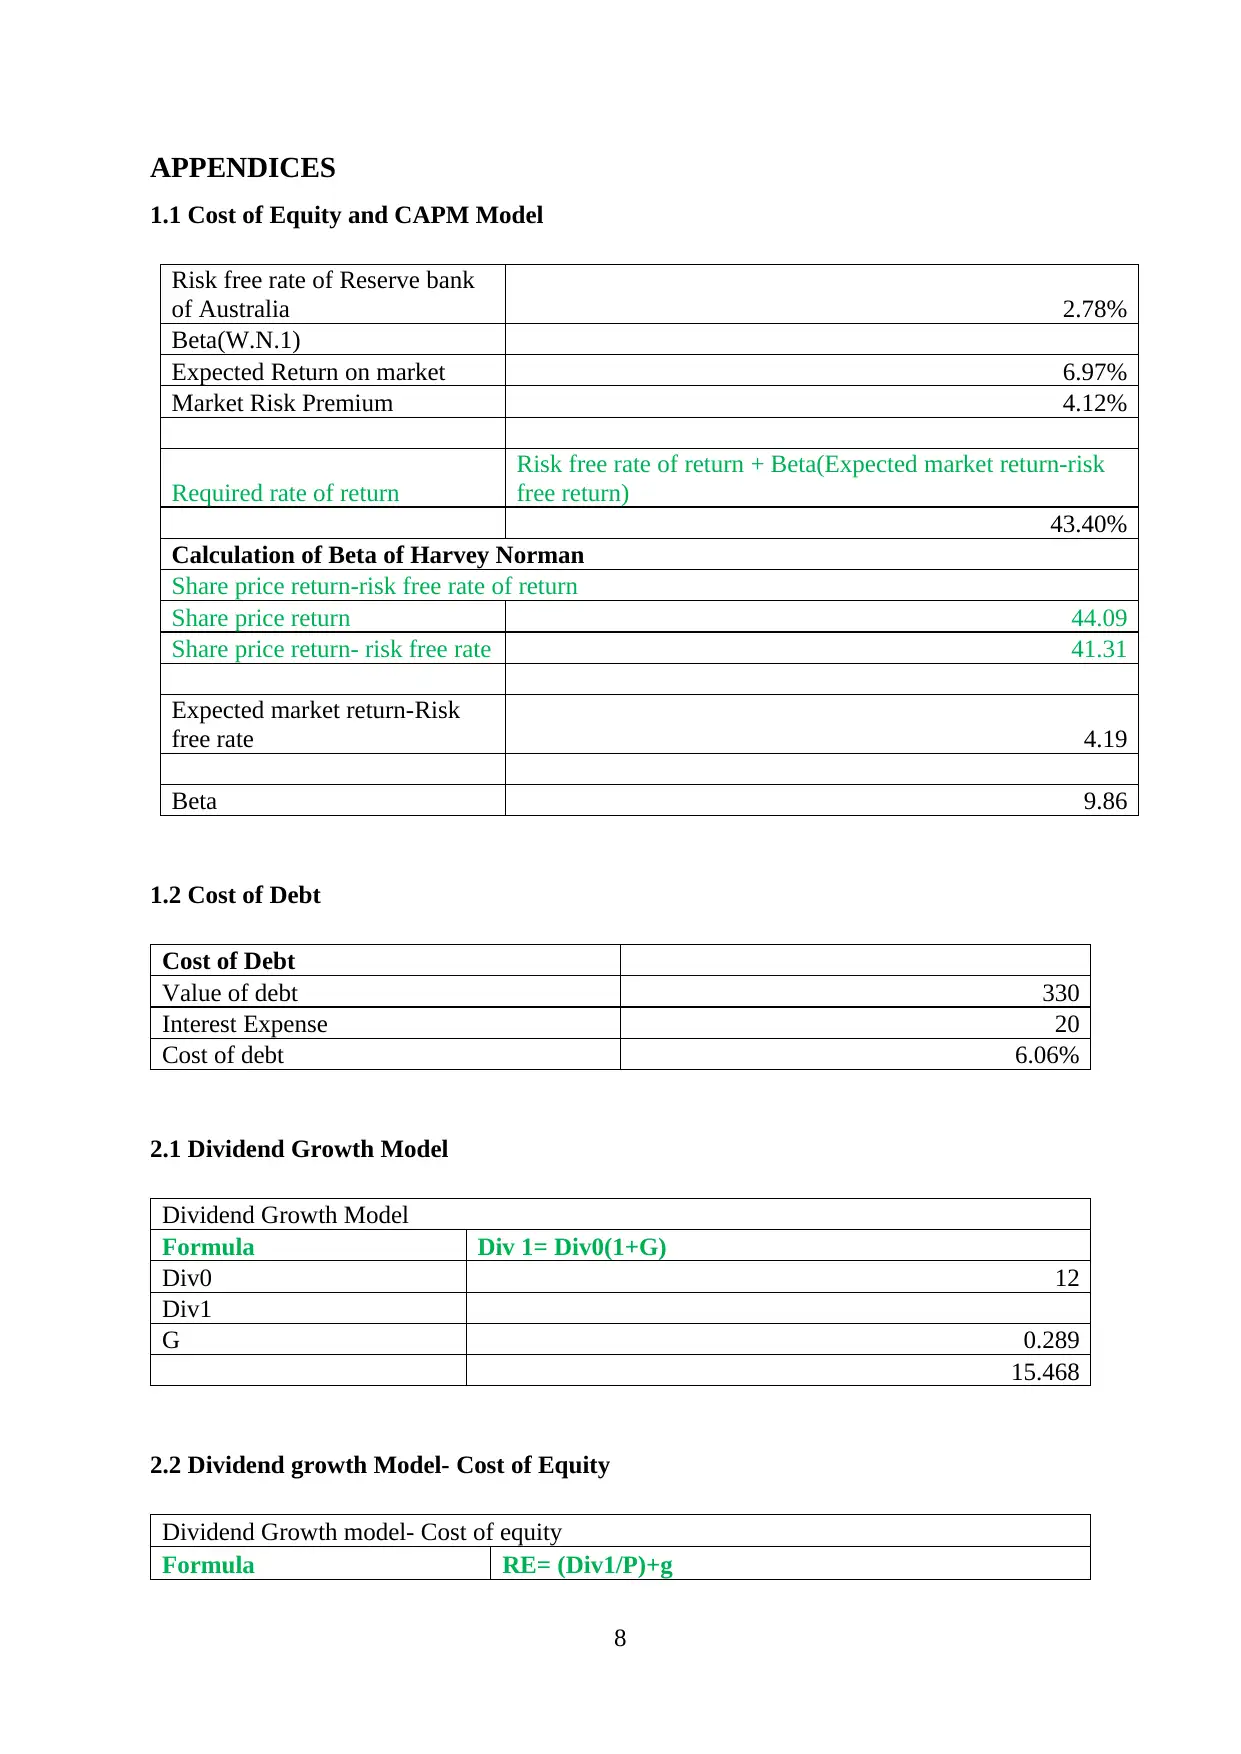
APPENDICES
1.1 Cost of Equity and CAPM Model
Risk free rate of Reserve bank
of Australia 2.78%
Beta(W.N.1)
Expected Return on market 6.97%
Market Risk Premium 4.12%
Required rate of return
Risk free rate of return + Beta(Expected market return-risk
free return)
43.40%
Calculation of Beta of Harvey Norman
Share price return-risk free rate of return
Share price return 44.09
Share price return- risk free rate 41.31
Expected market return-Risk
free rate 4.19
Beta 9.86
1.2 Cost of Debt
Cost of Debt
Value of debt 330
Interest Expense 20
Cost of debt 6.06%
2.1 Dividend Growth Model
Dividend Growth Model
Formula Div 1= Div0(1+G)
Div0 12
Div1
G 0.289
15.468
2.2 Dividend growth Model- Cost of Equity
Dividend Growth model- Cost of equity
Formula RE= (Div1/P)+g
8
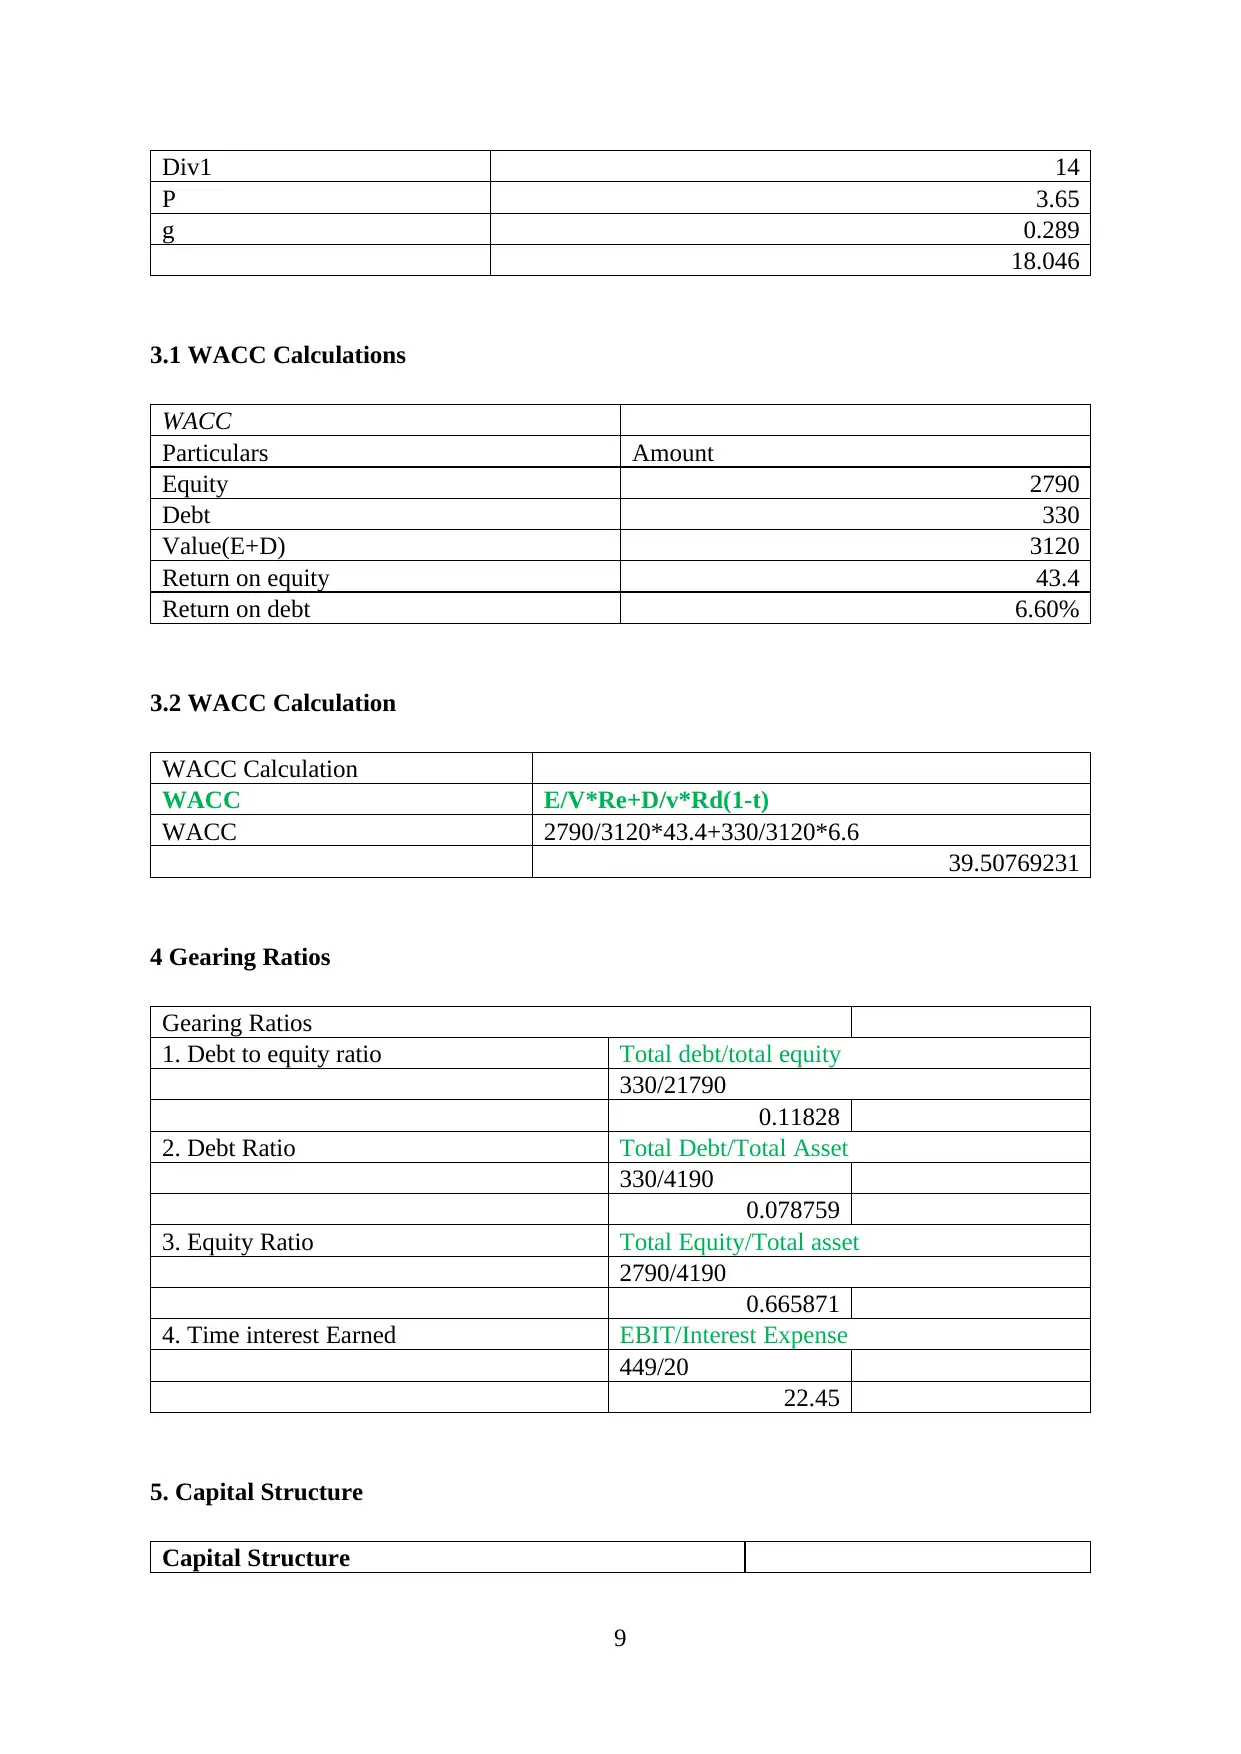
Div1 14
P 3.65
g 0.289
18.046
3.1 WACC Calculations
WACC
Particulars Amount
Equity 2790
Debt 330
Value(E+D) 3120
Return on equity 43.4
Return on debt 6.60%
3.2 WACC Calculation
WACC Calculation
WACC E/V*Re+D/v*Rd(1-t)
WACC 2790/3120*43.4+330/3120*6.6
39.50769231
4 Gearing Ratios
Gearing Ratios
1. Debt to equity ratio Total debt/total equity
330/21790
0.11828
2. Debt Ratio Total Debt/Total Asset
330/4190
0.078759
3. Equity Ratio Total Equity/Total asset
2790/4190
0.665871
4. Time interest Earned EBIT/Interest Expense
449/20
22.45
5. Capital Structure
Capital Structure
9
⊘ This is a preview!⊘
Do you want full access?
Subscribe today to unlock all pages.
Trusted by 1+ million students worldwide
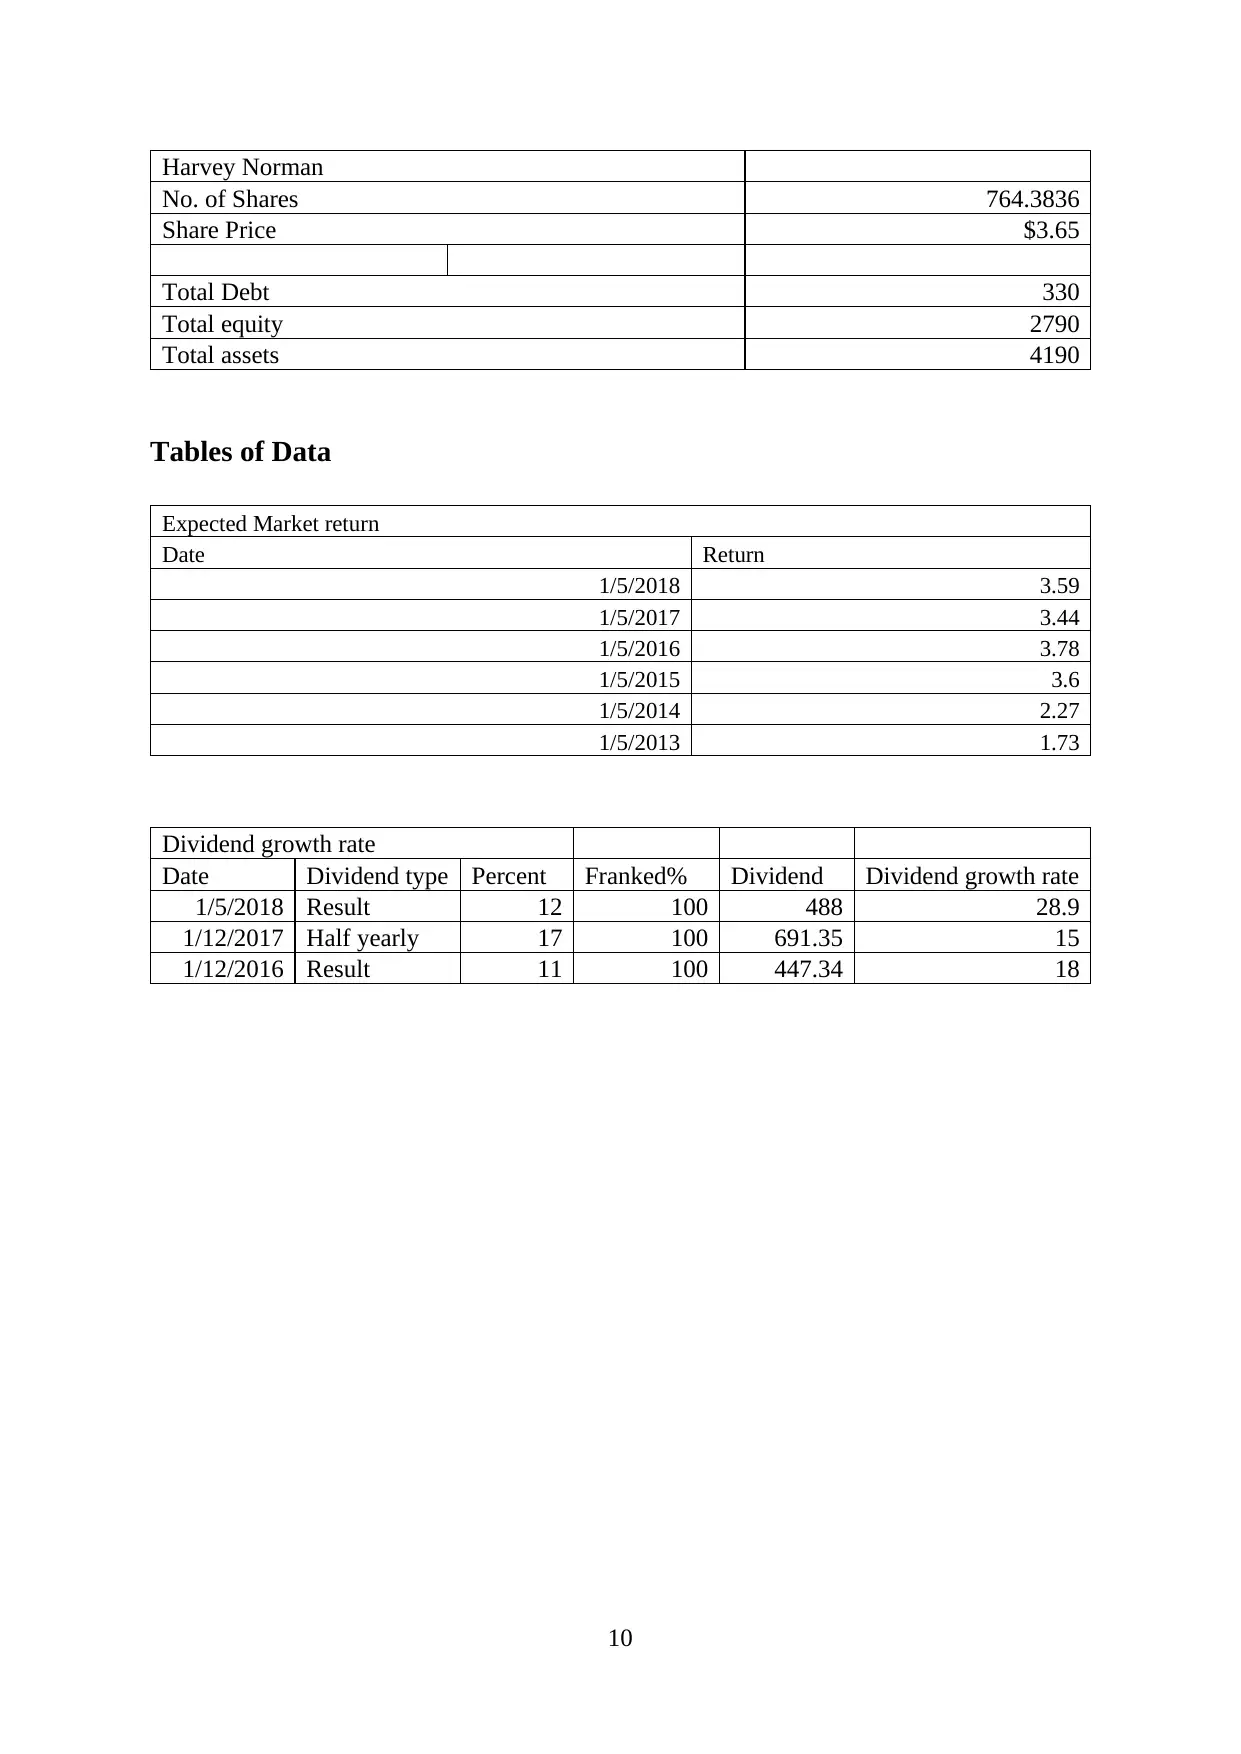
Harvey Norman
No. of Shares 764.3836
Share Price $3.65
Total Debt 330
Total equity 2790
Total assets 4190
Tables of Data
Expected Market return
Date Return
1/5/2018 3.59
1/5/2017 3.44
1/5/2016 3.78
1/5/2015 3.6
1/5/2014 2.27
1/5/2013 1.73
Dividend growth rate
Date Dividend type Percent Franked% Dividend Dividend growth rate
1/5/2018 Result 12 100 488 28.9
1/12/2017 Half yearly 17 100 691.35 15
1/12/2016 Result 11 100 447.34 18
10
Paraphrase This Document
Need a fresh take? Get an instant paraphrase of this document with our AI Paraphraser
REFERENCES
Books and journals
Bao, M.X., Billett, M.T., Smith, D.B. & Unlu, E., (2018). Does Incremental Other
Comprehensive Income (OCI) Volatility Affect the Cost of Debt, Capital Structure
and Credit Ratings?.
Bhardwaj, A., (2018). Financial Leverage and Firm's Value: A study of capital Structure of
Selected Manufacturing Sector Firms.
Broccardo, L., Tibiletti, L. & Vilpas, P., (2018). A Scorecard to Detect Financial Leverage
Profitability. International Journal of Business and Management. 13(3). p.244.
Dewi, D. K., Amboningtyas, D. & Paramita, P. D., (2018). THE OPTIMIZE INFLUENCE
OF FIRM SIZE, CAPITAL STRUCTURE, AND FINANCIAL RATIO TO
COMPANY VALUE IS MODERATED BY DIVIDEND POLICIES ON SECTOR A
VARETY OF INDUSTRY COMPANIES LISTED IN INDONESIA STOCK
EXCHANGE PERIOD OF 2012-2016. Journal of Management. 4(4).
Elmagrhi, M., & et.al., (2018). Trustee Board Diversity, Governance Mechanisms, Capital
Structure and Performance in UK Charities.
Johan, S., (2018). The Relationship Between Economic Value Added, Market Value Added
And Return On Cost Of Capital In Measuring Corporate Performance. Jurnal
Manajemen Bisnis dan Kewirausahaan. 3(1).
Mari, C. & Marra, M., (2018). Valuing Firms Under Default Risk and Bankruptcy Costs: A
WACC-Based Approach. International Journal of Business. 23(2).
Siqueira, A. C. O., Guenster, N., Vanacker, T. & Crucke, S., (2018). A longitudinal
comparison of capital structure between young for-profit social and commercial
enterprises. Journal of Business Venturing.
Tanha, H., Dempsey, M. & Labeb, M., (2018). Derivatives Usage by Australian Industrial
Firms: Pre-, during and post-GFC. Review of Economics & Finance. 11. pp.31-39.
Online
11
Beta of Harvey Norman, (2018). Available through: < https://www.infrontanalytics.com/fe-
en/30032AA/Harvey-Norman-Holdings-Ltd/Beta > [Accessed on 11th May 2018].
Capital asset pricing model, (2018). Available through: <
https://www.wallstreetmojo.com/cost-of-equity-capm/> [Accessed on 11th May 2018].
Capital structure theories, (2018). Available through: <
http://www.yourarticlelibrary.com/financial-management/capital-structure/top-4-
theories-of-capital-structure-with-calculations/65449> [Accessed on 11th May 2018].
Capital structure, (2018). Available through: <
https://corporatefinanceinstitute.com/resources/knowledge/finance/capital-structure-
overview/> [Accessed on 11th May 2018].
Government bond yields, (2018). Available through: <
https://www.bloomberg.com/markets/rates-bonds/government-bonds/australia>
[Accessed on 11th May 2018].
Harvey Norman Holdings Ltd, (2018). Available through: <
http://financials.morningstar.com/balance-sheet/bs.html?
t=HVN®ion=aus&culture=en-US> [Accessed on 11th May 2018].
Harvey Norman, (2018). Available through: < https://www.harveynorman.com.au/ >
[Accessed on 11th May 2018].
Market rate of Harvey Norman, (2018). Available through: <
https://www.marketwatch.com/investing/stock/hnory> [Accessed on 11th May 2018].
Weighted average cost of capital, (2018). Available through: <
https://www.educba.com/wacc/> [Accessed on 11th May 2018].
Harvey Norman stock price, 2018. Available through: <
https://www.bloomberg.com/quote/HVN:AU> [Accessed on 14th May 2018].
12
⊘ This is a preview!⊘
Do you want full access?
Subscribe today to unlock all pages.
Trusted by 1+ million students worldwide
1 out of 12
Related Documents


Your All-in-One AI-Powered Toolkit for Academic Success.
+13062052269
info@desklib.com
Available 24*7 on WhatsApp / Email
![[object Object]](/_next/static/media/star-bottom.7253800d.svg)
Unlock your academic potential
Copyright © 2020–2026 A2Z Services. All Rights Reserved. Developed and managed by ZUCOL.