Coventry University: Quantitative Research on Subjective Well-being
VerifiedAdded on  2023/06/09
|10
|2217
|320
Report
AI Summary
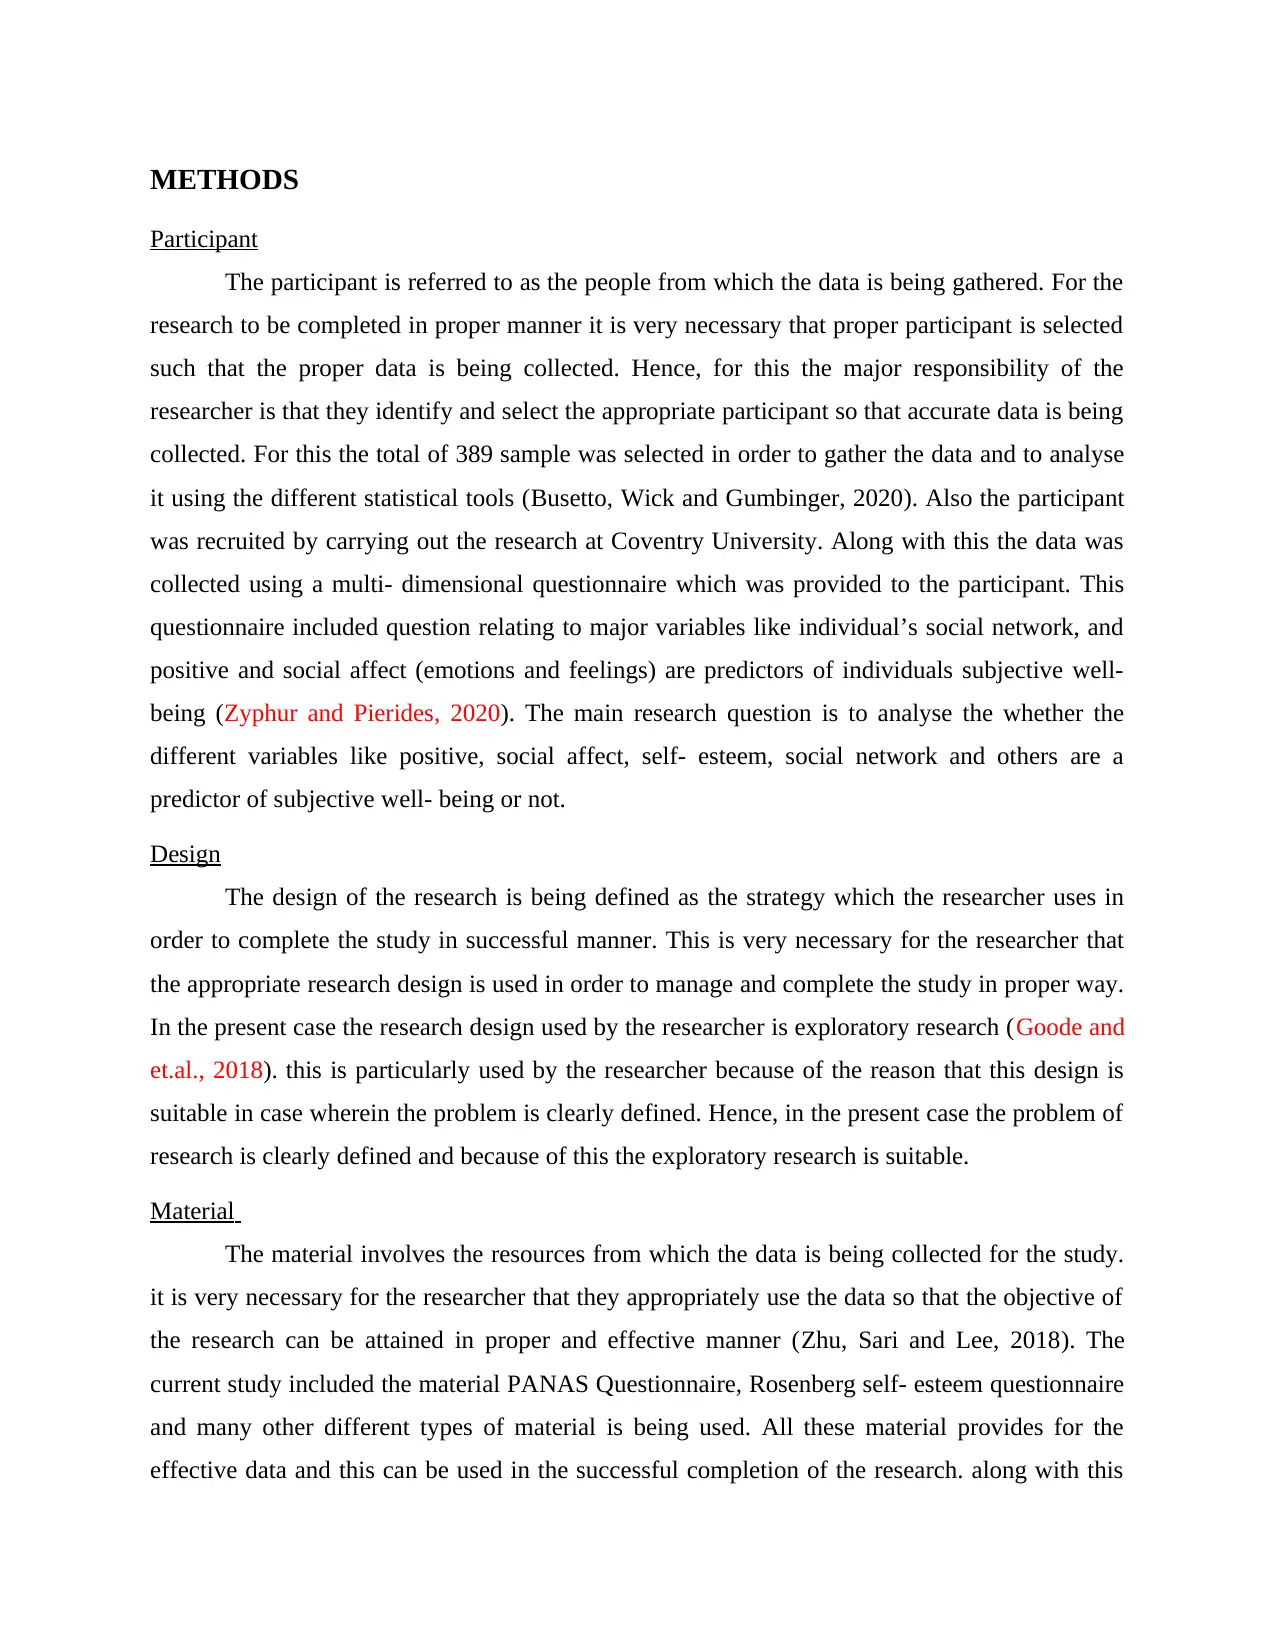
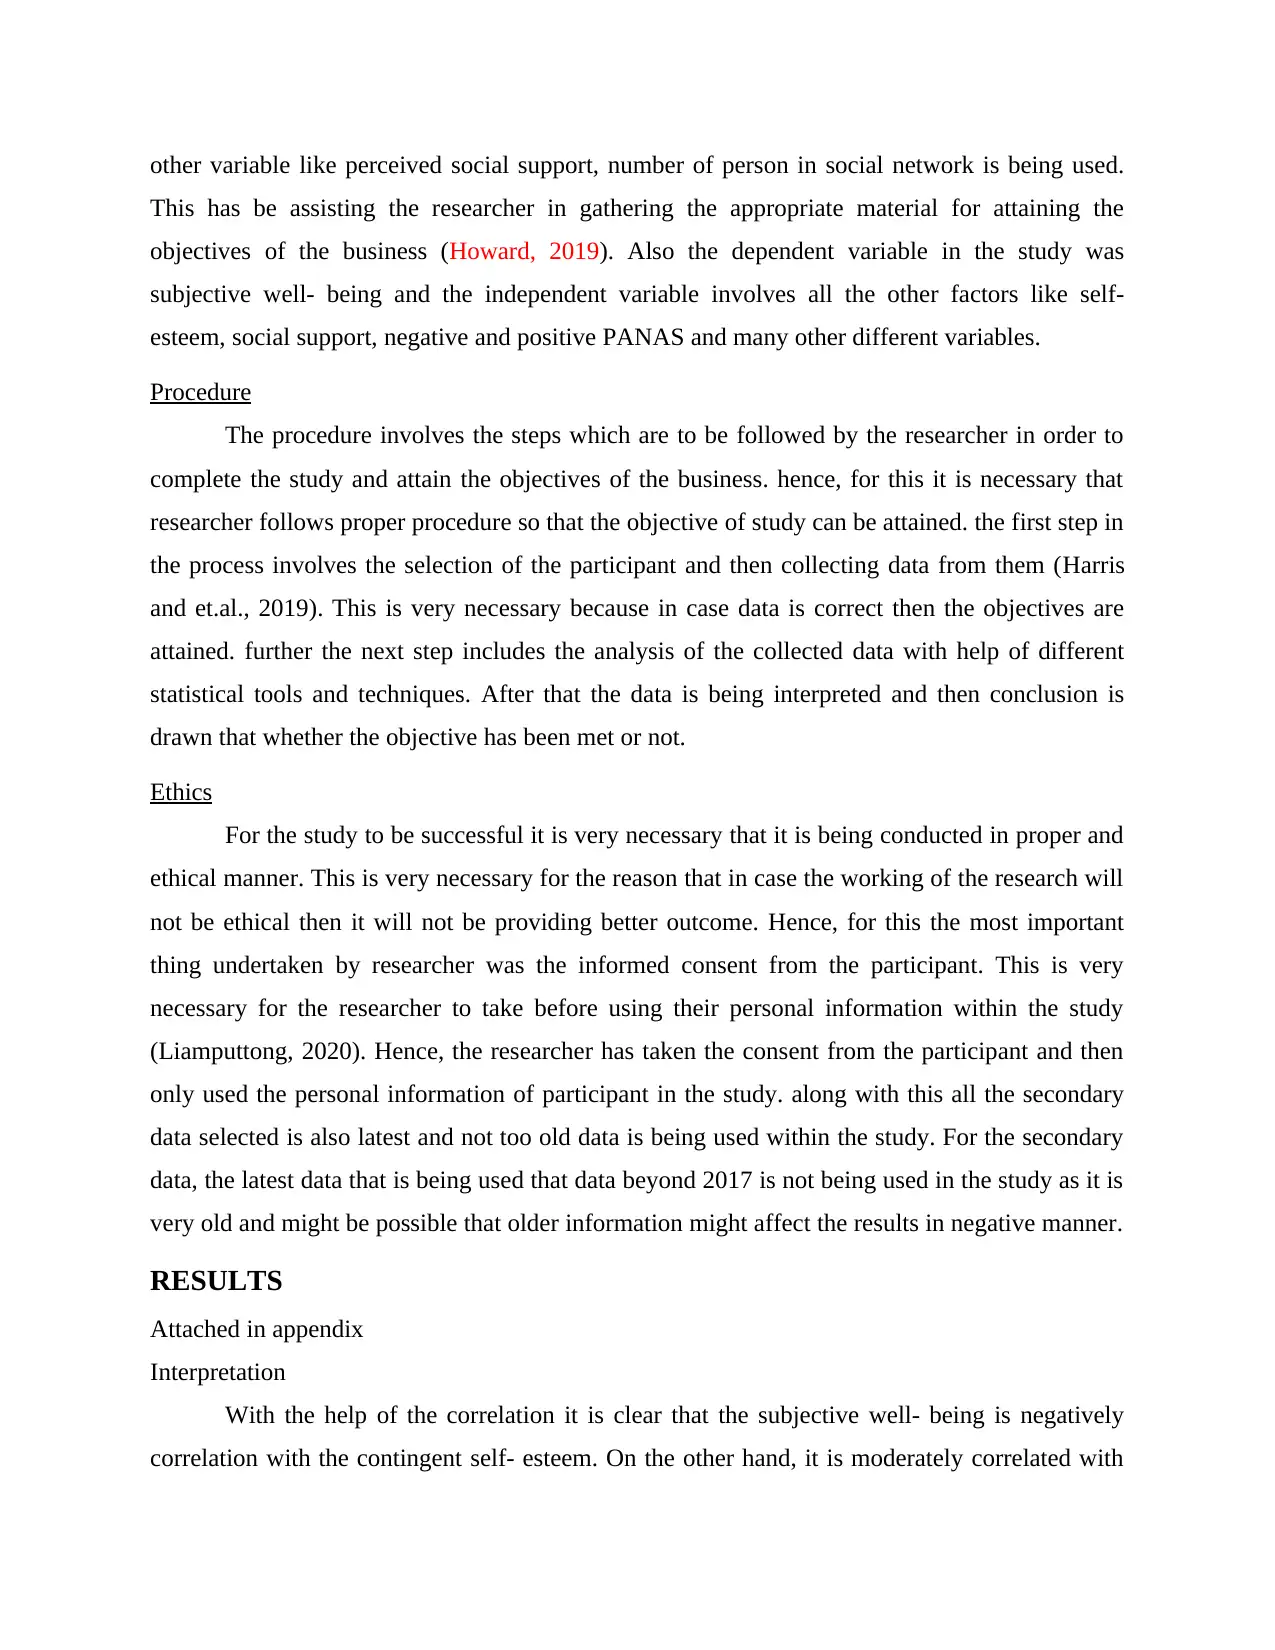
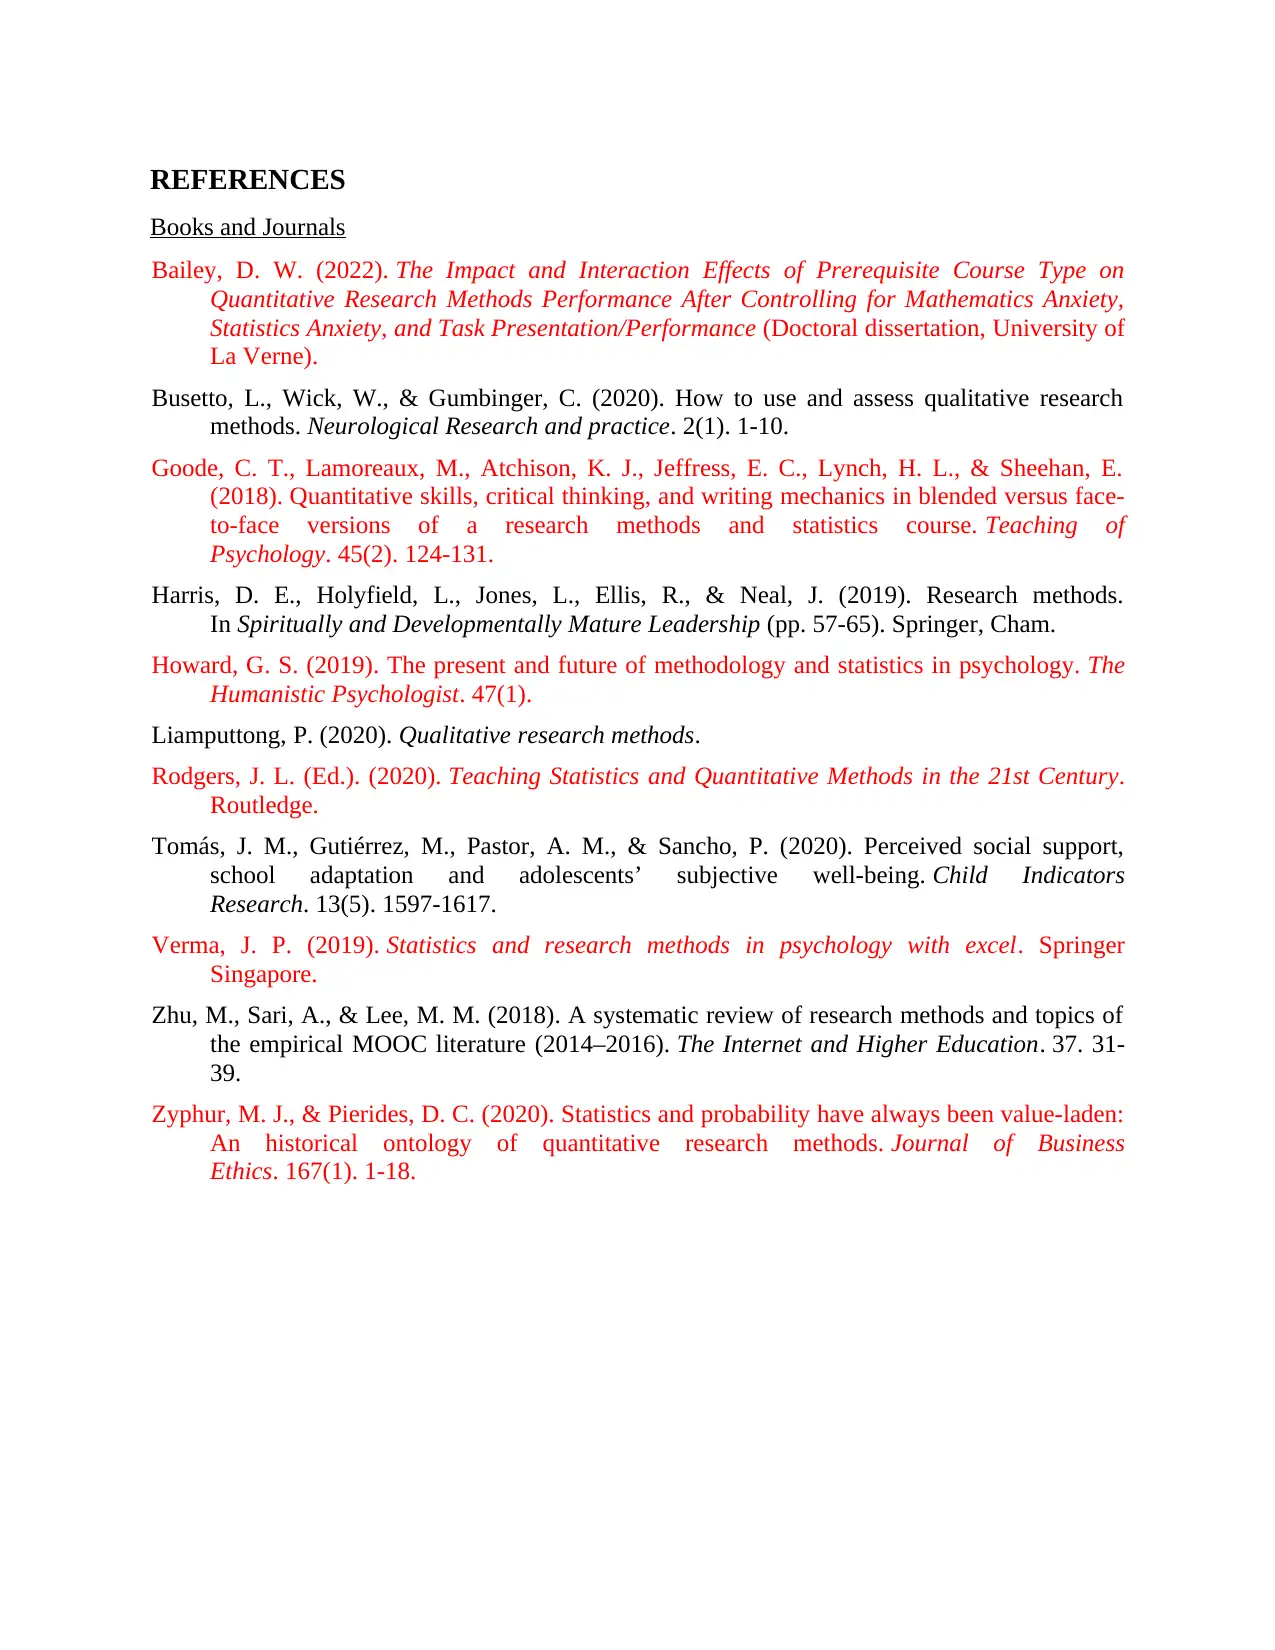
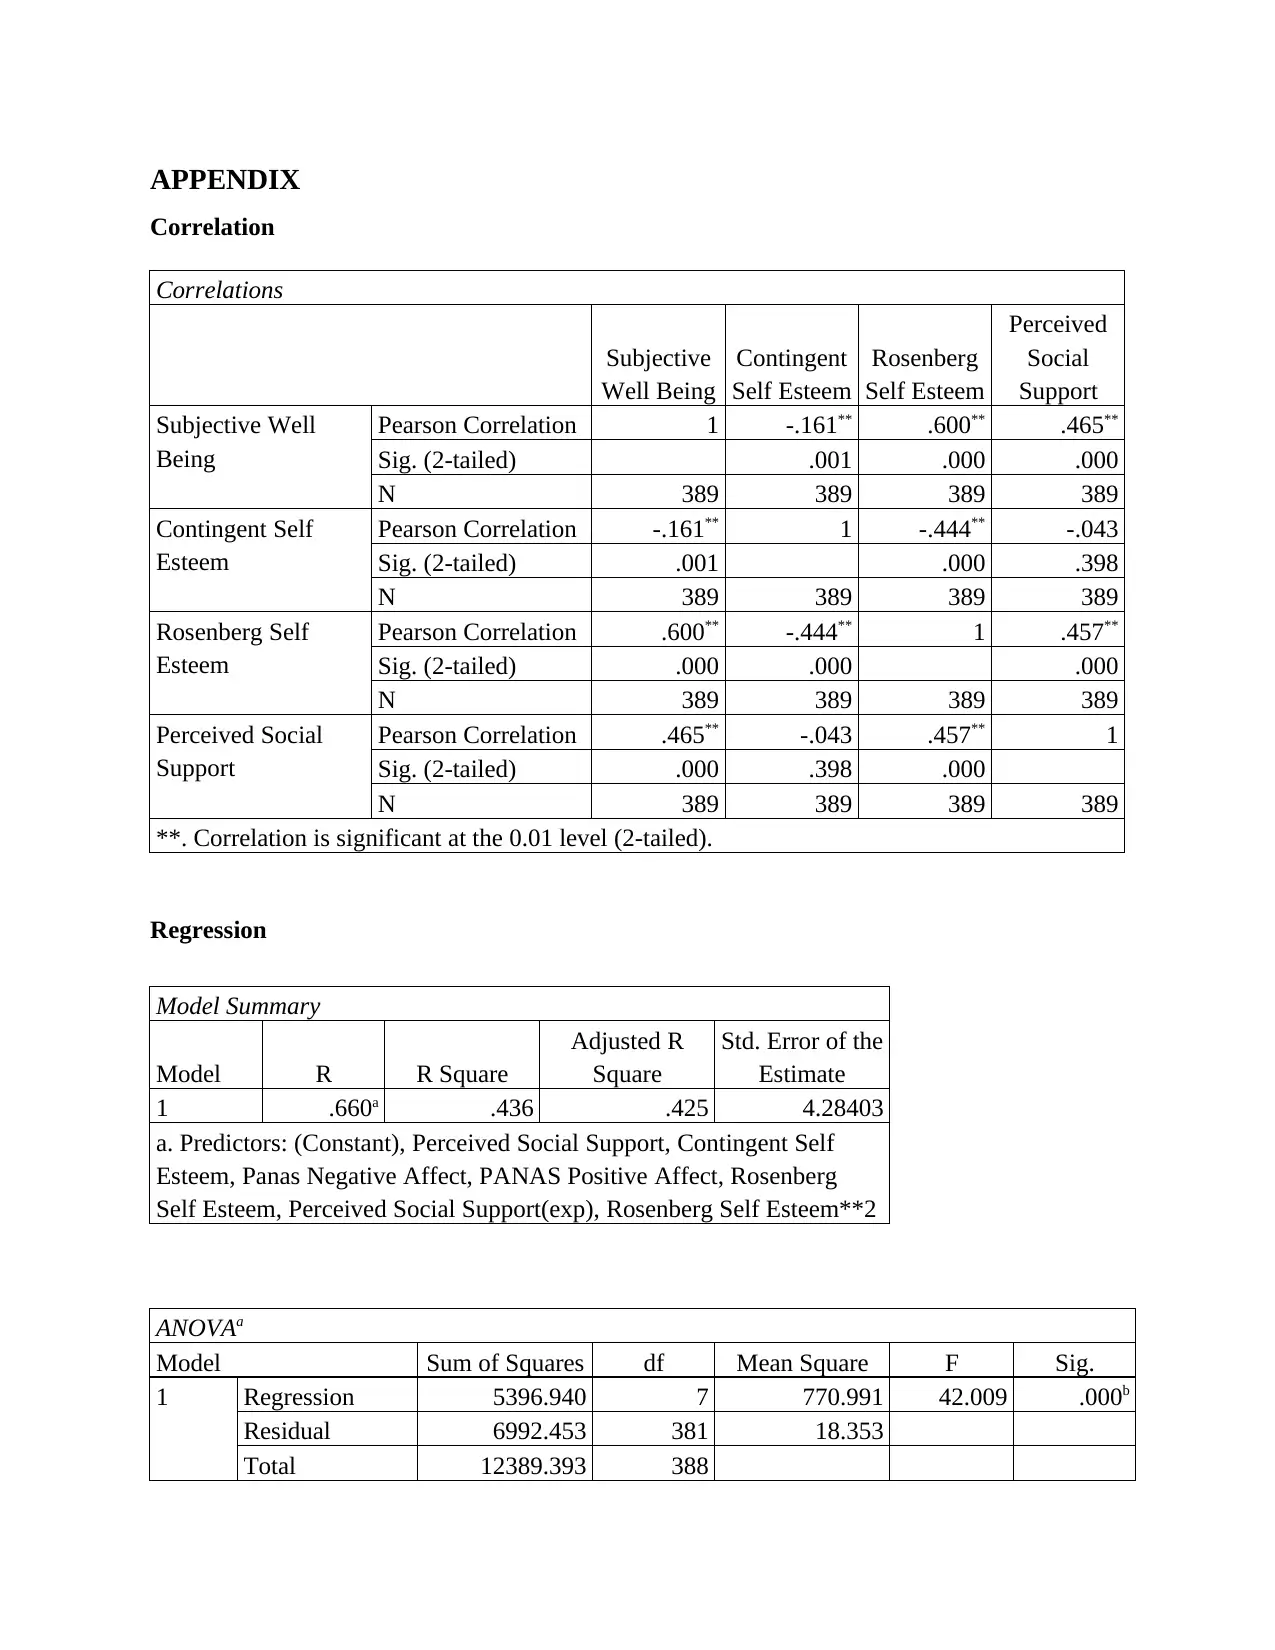
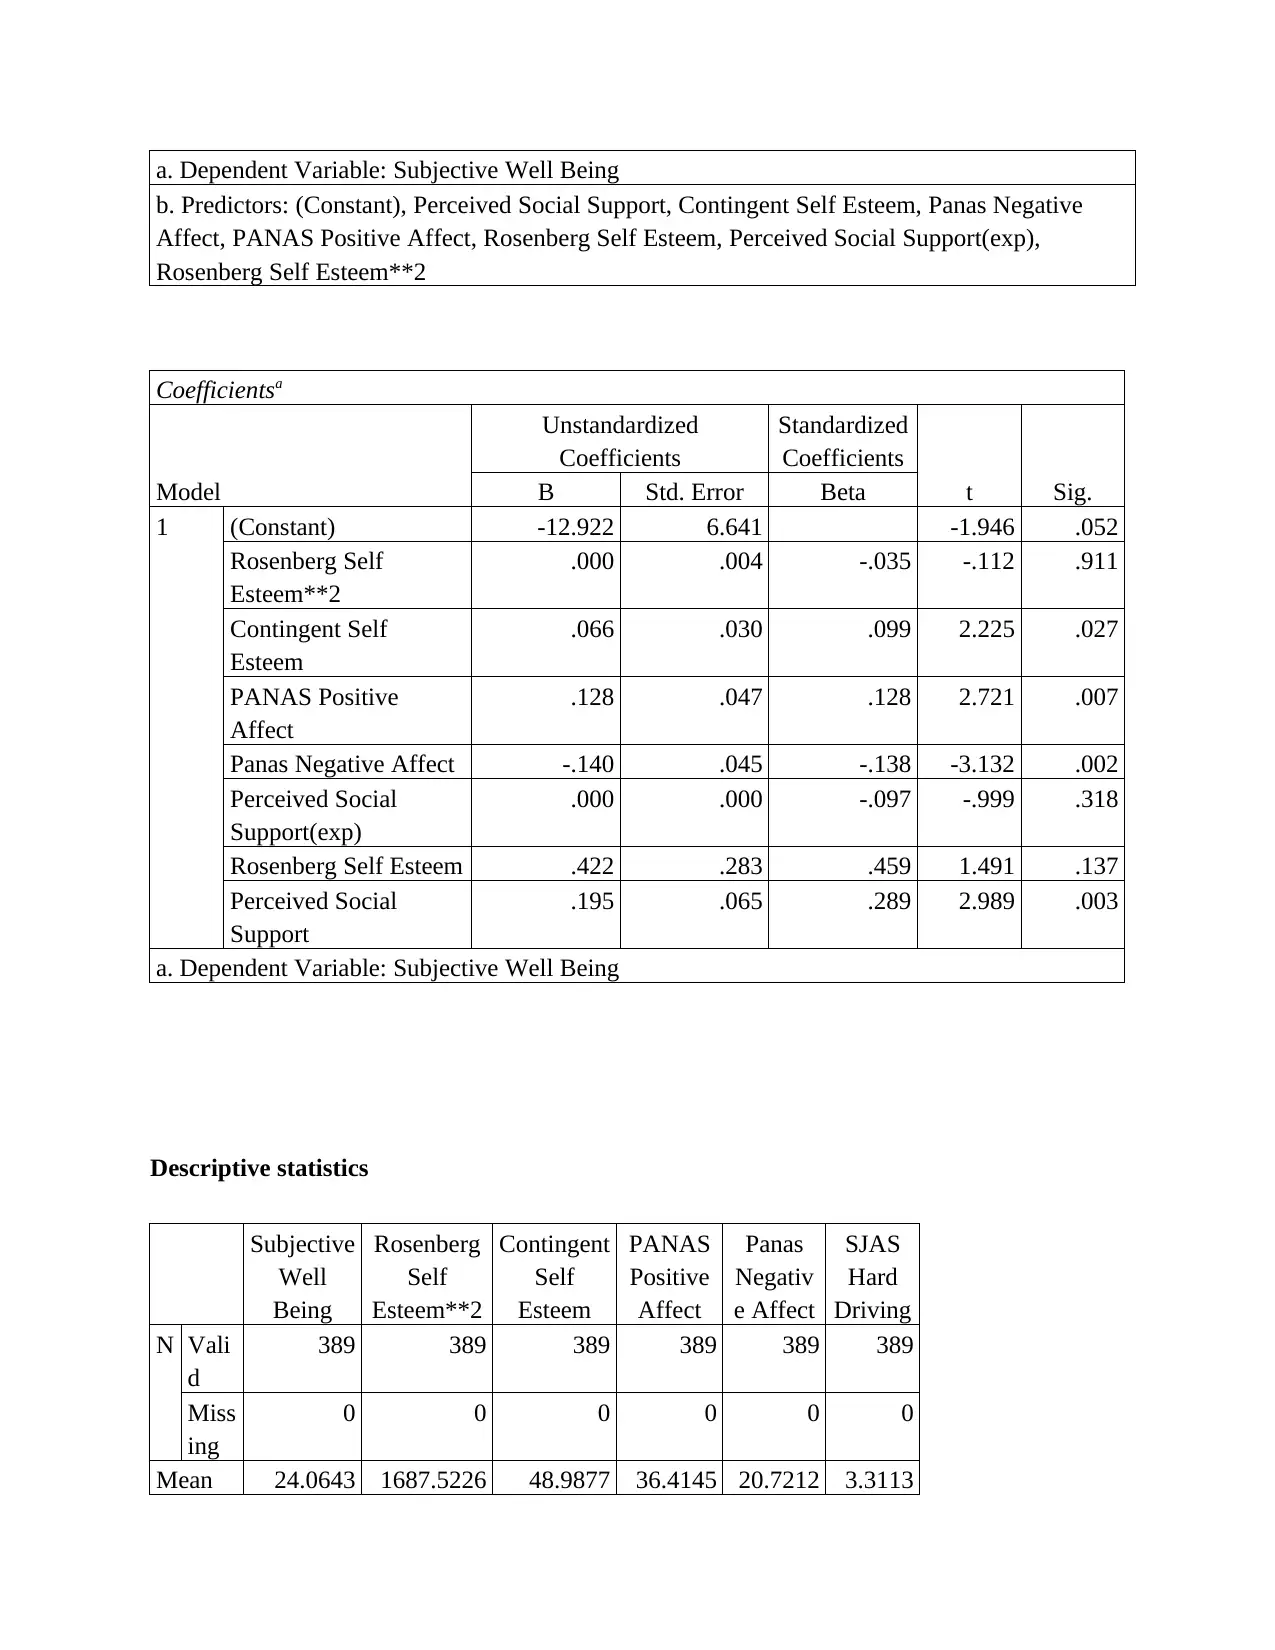
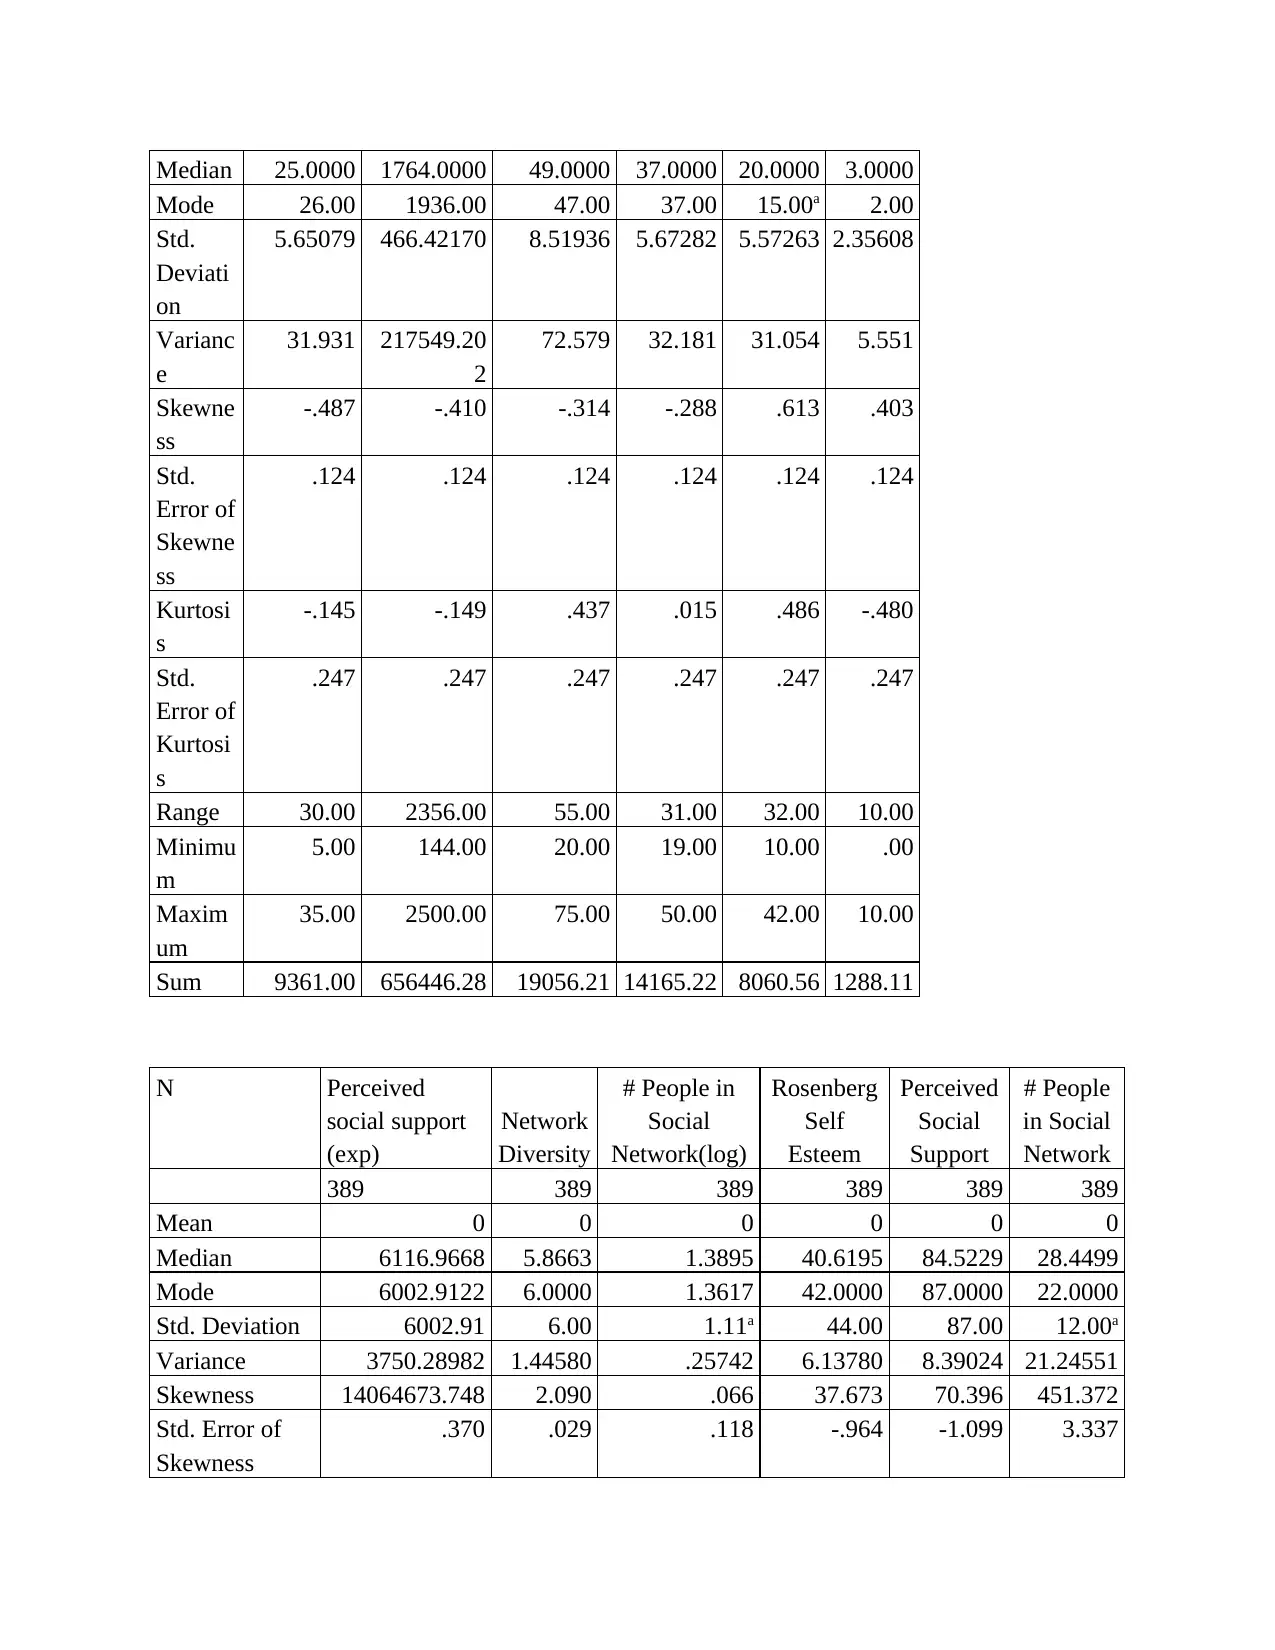
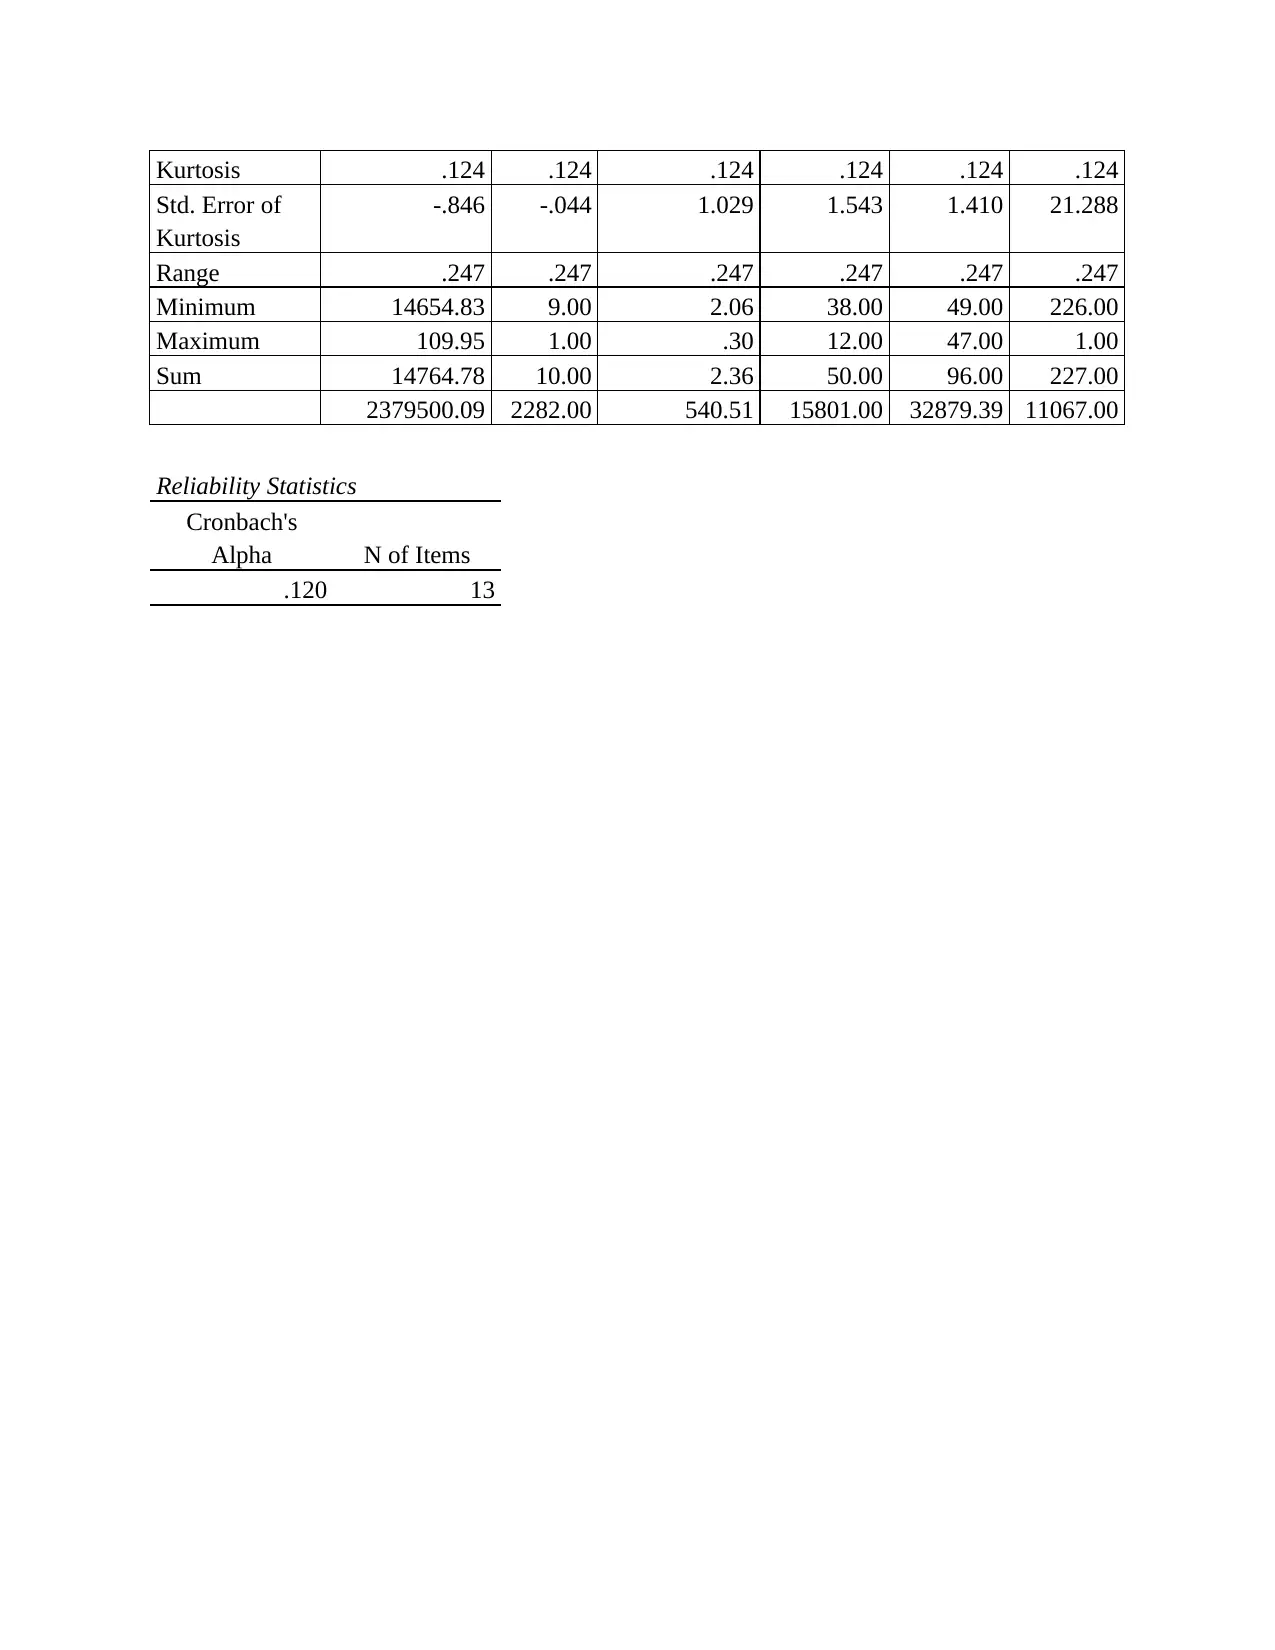
This report outlines a quantitative research study conducted at Coventry University, investigating the predictors of subjective well-being (SWB). The research employs an exploratory design, utilizing a multi-dimensional questionnaire to collect data from 389 participants. Key variables include self-esteem, perceived social support, the size of an individual’s social network, and positive and negative affect. Statistical analyses, including correlation and regression, are performed to determine the relationship between these variables and SWB. The report details the methods used, including participant selection, materials (such as the PANAS and Rosenberg Self-Esteem questionnaires), procedure, and ethical considerations, such as informed consent. The results indicate a negative correlation between contingent self-esteem and SWB, and a moderate correlation between perceived social support, Rosenberg self-esteem and SWB. Regression analysis supports the alternate hypothesis that these variables are significant predictors of SWB. The document includes a detailed appendix with correlation matrices, regression model summaries, ANOVA tables, and descriptive statistics.

Research Methods in
Psychology Quantitative Stats
Paraphrase This Document
Need a fresh take? Get an instant paraphrase of this document with our AI Paraphraser

TABLE OF CONTENTS
METHODS......................................................................................................................................3
Participant...................................................................................................................................3
Design.........................................................................................................................................3
Material.......................................................................................................................................3
Procedure....................................................................................................................................4
Ethics...........................................................................................................................................4
RESULTS........................................................................................................................................4
REFERENCES................................................................................................................................6
APPENDIX......................................................................................................................................7

METHODS
Participant
The participant is referred to as the people from which the data is being gathered. For the
research to be completed in proper manner it is very necessary that proper participant is selected
such that the proper data is being collected. Hence, for this the major responsibility of the
researcher is that they identify and select the appropriate participant so that accurate data is being
collected. For this the total of 389 sample was selected in order to gather the data and to analyse
it using the different statistical tools (Busetto, Wick and Gumbinger, 2020). Also the participant
was recruited by carrying out the research at Coventry University. Along with this the data was
collected using a multi- dimensional questionnaire which was provided to the participant. This
questionnaire included question relating to major variables like individual’s social network, and
positive and social affect (emotions and feelings) are predictors of individuals subjective well-
being (Zyphur and Pierides, 2020). The main research question is to analyse the whether the
different variables like positive, social affect, self- esteem, social network and others are a
predictor of subjective well- being or not.
Design
The design of the research is being defined as the strategy which the researcher uses in
order to complete the study in successful manner. This is very necessary for the researcher that
the appropriate research design is used in order to manage and complete the study in proper way.
In the present case the research design used by the researcher is exploratory research (Goode and
et.al., 2018). this is particularly used by the researcher because of the reason that this design is
suitable in case wherein the problem is clearly defined. Hence, in the present case the problem of
research is clearly defined and because of this the exploratory research is suitable.
Material
The material involves the resources from which the data is being collected for the study.
it is very necessary for the researcher that they appropriately use the data so that the objective of
the research can be attained in proper and effective manner (Zhu, Sari and Lee, 2018). The
current study included the material PANAS Questionnaire, Rosenberg self- esteem questionnaire
and many other different types of material is being used. All these material provides for the
effective data and this can be used in the successful completion of the research. along with this
⊘ This is a preview!⊘
Do you want full access?
Subscribe today to unlock all pages.

Trusted by 1+ million students worldwide

other variable like perceived social support, number of person in social network is being used.
This has be assisting the researcher in gathering the appropriate material for attaining the
objectives of the business (Howard, 2019). Also the dependent variable in the study was
subjective well- being and the independent variable involves all the other factors like self-
esteem, social support, negative and positive PANAS and many other different variables.
Procedure
The procedure involves the steps which are to be followed by the researcher in order to
complete the study and attain the objectives of the business. hence, for this it is necessary that
researcher follows proper procedure so that the objective of study can be attained. the first step in
the process involves the selection of the participant and then collecting data from them (Harris
and et.al., 2019). This is very necessary because in case data is correct then the objectives are
attained. further the next step includes the analysis of the collected data with help of different
statistical tools and techniques. After that the data is being interpreted and then conclusion is
drawn that whether the objective has been met or not.
Ethics
For the study to be successful it is very necessary that it is being conducted in proper and
ethical manner. This is very necessary for the reason that in case the working of the research will
not be ethical then it will not be providing better outcome. Hence, for this the most important
thing undertaken by researcher was the informed consent from the participant. This is very
necessary for the researcher to take before using their personal information within the study
(Liamputtong, 2020). Hence, the researcher has taken the consent from the participant and then
only used the personal information of participant in the study. along with this all the secondary
data selected is also latest and not too old data is being used within the study. For the secondary
data, the latest data that is being used that data beyond 2017 is not being used in the study as it is
very old and might be possible that older information might affect the results in negative manner.
RESULTS
Attached in appendix
Interpretation
With the help of the correlation it is clear that the subjective well- being is negatively
correlation with the contingent self- esteem. On the other hand, it is moderately correlated with
Paraphrase This Document
Need a fresh take? Get an instant paraphrase of this document with our AI Paraphraser

other variables that is perceived social support and the Rosenberg self- esteem (Rodgers
(Ed.).2020). This simply means that the moderately correlated variables are affecting the
subjective well- being and is an indicator of it. In against of this, the contingent self- esteem is
not a predictor of the subjective well- being as it is negative correlated to it.
Further with help of the descriptive statistics it was analysed that the average subjective
well- being score is 24.06 and the standard deviation is 5.65. this implies that there is not much
deviation within the values as compared to mean value (Bailey, 2022). Further the average
people in social network involves is 28 and deviation is 21 which is very high.
By evaluation of regression output it is clear that alternate hypothesis is proved correct
and null is being rejected. This is pertaining to the fact that the significance value is less than the
standard that is 0.00. along with this R is 66 % and this indicates that there is moderate
correlation between the variables. In support of this Tomás and et.al., (2020) stated that
subjective well- being is being affected by the different variables like perceived social support,
contingent self- esteem, Rosenberg self- esteem and many other different variables (Verma,
2019).

REFERENCES
Books and Journals
Bailey, D. W. (2022). The Impact and Interaction Effects of Prerequisite Course Type on
Quantitative Research Methods Performance After Controlling for Mathematics Anxiety,
Statistics Anxiety, and Task Presentation/Performance (Doctoral dissertation, University of
La Verne).
Busetto, L., Wick, W., & Gumbinger, C. (2020). How to use and assess qualitative research
methods. Neurological Research and practice. 2(1). 1-10.
Goode, C. T., Lamoreaux, M., Atchison, K. J., Jeffress, E. C., Lynch, H. L., & Sheehan, E.
(2018). Quantitative skills, critical thinking, and writing mechanics in blended versus face-
to-face versions of a research methods and statistics course. Teaching of
Psychology. 45(2). 124-131.
Harris, D. E., Holyfield, L., Jones, L., Ellis, R., & Neal, J. (2019). Research methods.
In Spiritually and Developmentally Mature Leadership (pp. 57-65). Springer, Cham.
Howard, G. S. (2019). The present and future of methodology and statistics in psychology. The
Humanistic Psychologist. 47(1).
Liamputtong, P. (2020). Qualitative research methods.
Rodgers, J. L. (Ed.). (2020). Teaching Statistics and Quantitative Methods in the 21st Century.
Routledge.
Tomás, J. M., Gutiérrez, M., Pastor, A. M., & Sancho, P. (2020). Perceived social support,
school adaptation and adolescents’ subjective well-being. Child Indicators
Research. 13(5). 1597-1617.
Verma, J. P. (2019). Statistics and research methods in psychology with excel. Springer
Singapore.
Zhu, M., Sari, A., & Lee, M. M. (2018). A systematic review of research methods and topics of
the empirical MOOC literature (2014–2016). The Internet and Higher Education. 37. 31-
39.
Zyphur, M. J., & Pierides, D. C. (2020). Statistics and probability have always been value-laden:
An historical ontology of quantitative research methods. Journal of Business
Ethics. 167(1). 1-18.
⊘ This is a preview!⊘
Do you want full access?
Subscribe today to unlock all pages.

Trusted by 1+ million students worldwide

APPENDIX
Correlation
Correlations
Subjective
Well Being
Contingent
Self Esteem
Rosenberg
Self Esteem
Perceived
Social
Support
Subjective Well
Being
Pearson Correlation 1 -.161** .600** .465**
Sig. (2-tailed) .001 .000 .000
N 389 389 389 389
Contingent Self
Esteem
Pearson Correlation -.161** 1 -.444** -.043
Sig. (2-tailed) .001 .000 .398
N 389 389 389 389
Rosenberg Self
Esteem
Pearson Correlation .600** -.444** 1 .457**
Sig. (2-tailed) .000 .000 .000
N 389 389 389 389
Perceived Social
Support
Pearson Correlation .465** -.043 .457** 1
Sig. (2-tailed) .000 .398 .000
N 389 389 389 389
**. Correlation is significant at the 0.01 level (2-tailed).
Regression
Model Summary
Model R R Square
Adjusted R
Square
Std. Error of the
Estimate
1 .660a .436 .425 4.28403
a. Predictors: (Constant), Perceived Social Support, Contingent Self
Esteem, Panas Negative Affect, PANAS Positive Affect, Rosenberg
Self Esteem, Perceived Social Support(exp), Rosenberg Self Esteem**2
ANOVAa
Model Sum of Squares df Mean Square F Sig.
1 Regression 5396.940 7 770.991 42.009 .000b
Residual 6992.453 381 18.353
Total 12389.393 388
Paraphrase This Document
Need a fresh take? Get an instant paraphrase of this document with our AI Paraphraser

a. Dependent Variable: Subjective Well Being
b. Predictors: (Constant), Perceived Social Support, Contingent Self Esteem, Panas Negative
Affect, PANAS Positive Affect, Rosenberg Self Esteem, Perceived Social Support(exp),
Rosenberg Self Esteem**2
Coefficientsa
Model
Unstandardized
Coefficients
Standardized
Coefficients
t Sig.B Std. Error Beta
1 (Constant) -12.922 6.641 -1.946 .052
Rosenberg Self
Esteem**2
.000 .004 -.035 -.112 .911
Contingent Self
Esteem
.066 .030 .099 2.225 .027
PANAS Positive
Affect
.128 .047 .128 2.721 .007
Panas Negative Affect -.140 .045 -.138 -3.132 .002
Perceived Social
Support(exp)
.000 .000 -.097 -.999 .318
Rosenberg Self Esteem .422 .283 .459 1.491 .137
Perceived Social
Support
.195 .065 .289 2.989 .003
a. Dependent Variable: Subjective Well Being
Descriptive statistics
Subjective
Well
Being
Rosenberg
Self
Esteem**2
Contingent
Self
Esteem
PANAS
Positive
Affect
Panas
Negativ
e Affect
SJAS
Hard
Driving
N Vali
d
389 389 389 389 389 389
Miss
ing
0 0 0 0 0 0
Mean 24.0643 1687.5226 48.9877 36.4145 20.7212 3.3113

Median 25.0000 1764.0000 49.0000 37.0000 20.0000 3.0000
Mode 26.00 1936.00 47.00 37.00 15.00a 2.00
Std.
Deviati
on
5.65079 466.42170 8.51936 5.67282 5.57263 2.35608
Varianc
e
31.931 217549.20
2
72.579 32.181 31.054 5.551
Skewne
ss
-.487 -.410 -.314 -.288 .613 .403
Std.
Error of
Skewne
ss
.124 .124 .124 .124 .124 .124
Kurtosi
s
-.145 -.149 .437 .015 .486 -.480
Std.
Error of
Kurtosi
s
.247 .247 .247 .247 .247 .247
Range 30.00 2356.00 55.00 31.00 32.00 10.00
Minimu
m
5.00 144.00 20.00 19.00 10.00 .00
Maxim
um
35.00 2500.00 75.00 50.00 42.00 10.00
Sum 9361.00 656446.28 19056.21 14165.22 8060.56 1288.11
N Perceived
social support
(exp)
Network
Diversity
# People in
Social
Network(log)
Rosenberg
Self
Esteem
Perceived
Social
Support
# People
in Social
Network
389 389 389 389 389 389
Mean 0 0 0 0 0 0
Median 6116.9668 5.8663 1.3895 40.6195 84.5229 28.4499
Mode 6002.9122 6.0000 1.3617 42.0000 87.0000 22.0000
Std. Deviation 6002.91 6.00 1.11a 44.00 87.00 12.00a
Variance 3750.28982 1.44580 .25742 6.13780 8.39024 21.24551
Skewness 14064673.748 2.090 .066 37.673 70.396 451.372
Std. Error of
Skewness
.370 .029 .118 -.964 -1.099 3.337
⊘ This is a preview!⊘
Do you want full access?
Subscribe today to unlock all pages.

Trusted by 1+ million students worldwide

Kurtosis .124 .124 .124 .124 .124 .124
Std. Error of
Kurtosis
-.846 -.044 1.029 1.543 1.410 21.288
Range .247 .247 .247 .247 .247 .247
Minimum 14654.83 9.00 2.06 38.00 49.00 226.00
Maximum 109.95 1.00 .30 12.00 47.00 1.00
Sum 14764.78 10.00 2.36 50.00 96.00 227.00
2379500.09 2282.00 540.51 15801.00 32879.39 11067.00
Reliability Statistics
Cronbach's
Alpha N of Items
.120 13
1 out of 10
Related Documents
Your All-in-One AI-Powered Toolkit for Academic Success.
 +13062052269
info@desklib.com
Available 24*7 on WhatsApp / Email
Unlock your academic potential
Copyright © 2020–2026 A2Z Services. All Rights Reserved. Developed and managed by ZUCOL.


