Applying the Biopsychosocial Perspective to Health Behavior Analysis
VerifiedAdded on 2021/02/20
|16
|2541
|29
Report
AI Summary
This report provides a critical analysis of health behavior through the application of the biopsychosocial perspective. It delves into statistical analyses, focusing on correlations and regression to understand the relationships between various factors. The study examines self-efficacy, confidence, and usefulness as key variables, exploring their interdependencies and impact on health-related outcomes. The report includes descriptive statistics, correlation matrices, and regression analyses, providing interpretations of the findings and their implications. The analysis also considers the influence of academic performance, such as math and science grades, on the observed variables. Overall, the report aims to offer insights into the complex interplay of psychological, social, and biological factors that shape health behaviors, drawing conclusions from the statistical data presented.
Apply the biopsychosocial
perspective to the critical
analysis of a health behaviour
perspective to the critical
analysis of a health behaviour
Paraphrase This Document
Need a fresh take? Get an instant paraphrase of this document with our AI Paraphraser

Table of Contents
MAIN BODY...................................................................................................................................3
MAIN BODY...................................................................................................................................3
MAIN BODY
Correlations
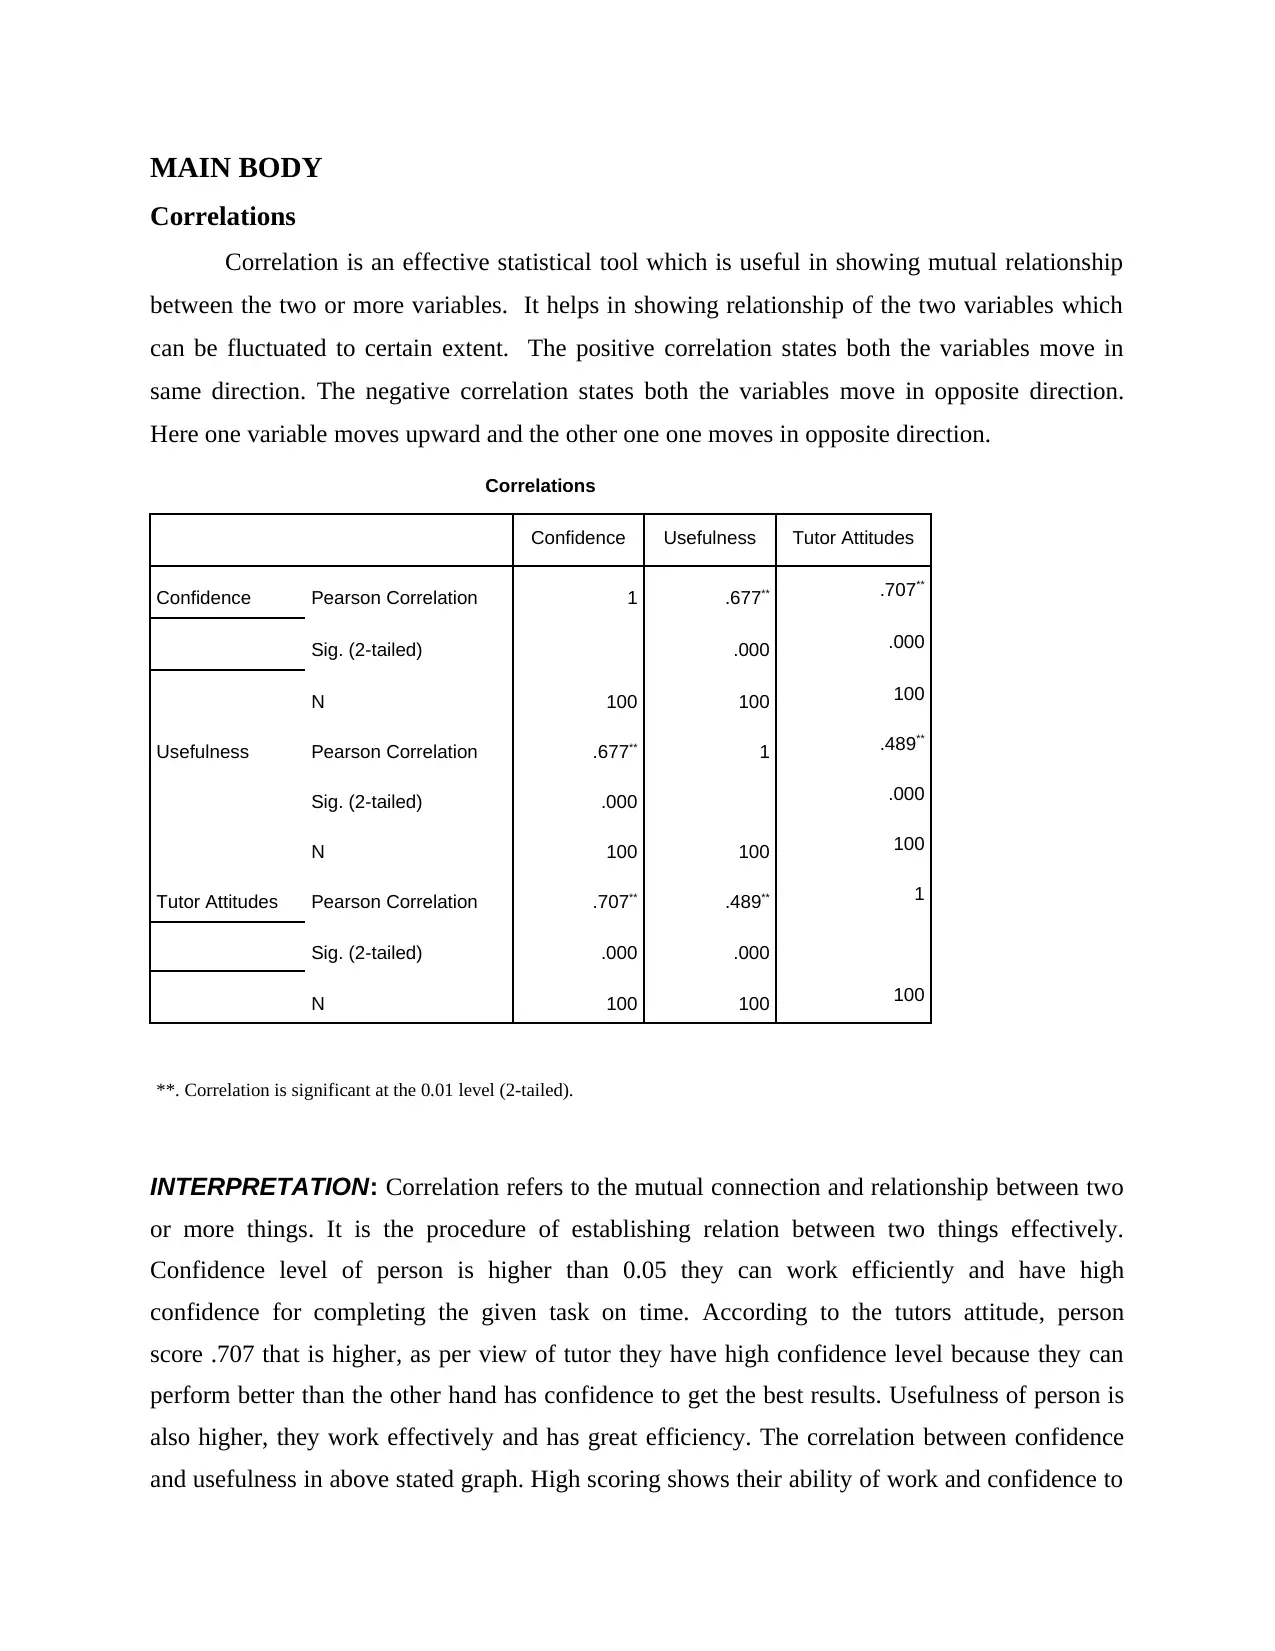
Correlation is an effective statistical tool which is useful in showing mutual relationship
between the two or more variables. It helps in showing relationship of the two variables which
can be fluctuated to certain extent. The positive correlation states both the variables move in
same direction. The negative correlation states both the variables move in opposite direction.
Here one variable moves upward and the other one one moves in opposite direction.
Correlations
Confidence Usefulness Tutor Attitudes
Confidence Pearson Correlation 1 .677** .707**
Sig. (2-tailed) .000 .000
N 100 100 100
Usefulness Pearson Correlation .677** 1 .489**
Sig. (2-tailed) .000 .000
N 100 100 100
Tutor Attitudes Pearson Correlation .707** .489** 1
Sig. (2-tailed) .000 .000
N 100 100 100
**. Correlation is significant at the 0.01 level (2-tailed).
INTERPRETATION: Correlation refers to the mutual connection and relationship between two
or more things. It is the procedure of establishing relation between two things effectively.
Confidence level of person is higher than 0.05 they can work efficiently and have high
confidence for completing the given task on time. According to the tutors attitude, person
score .707 that is higher, as per view of tutor they have high confidence level because they can
perform better than the other hand has confidence to get the best results. Usefulness of person is
also higher, they work effectively and has great efficiency. The correlation between confidence
and usefulness in above stated graph. High scoring shows their ability of work and confidence to
Correlations
Correlation is an effective statistical tool which is useful in showing mutual relationship
between the two or more variables. It helps in showing relationship of the two variables which
can be fluctuated to certain extent. The positive correlation states both the variables move in
same direction. The negative correlation states both the variables move in opposite direction.
Here one variable moves upward and the other one one moves in opposite direction.
Correlations
Confidence Usefulness Tutor Attitudes
Confidence Pearson Correlation 1 .677** .707**
Sig. (2-tailed) .000 .000
N 100 100 100
Usefulness Pearson Correlation .677** 1 .489**
Sig. (2-tailed) .000 .000
N 100 100 100
Tutor Attitudes Pearson Correlation .707** .489** 1
Sig. (2-tailed) .000 .000
N 100 100 100
**. Correlation is significant at the 0.01 level (2-tailed).
INTERPRETATION: Correlation refers to the mutual connection and relationship between two
or more things. It is the procedure of establishing relation between two things effectively.
Confidence level of person is higher than 0.05 they can work efficiently and have high
confidence for completing the given task on time. According to the tutors attitude, person
score .707 that is higher, as per view of tutor they have high confidence level because they can
perform better than the other hand has confidence to get the best results. Usefulness of person is
also higher, they work effectively and has great efficiency. The correlation between confidence
and usefulness in above stated graph. High scoring shows their ability of work and confidence to
⊘ This is a preview!⊘
Do you want full access?
Subscribe today to unlock all pages.
Trusted by 1+ million students worldwide
accomplish given task better than the others. Tutors give positive comments and have positive
attitudes towards that person. On the other hand if the scoring is >0.30 it considered as low
confidence level among person, those person how have low score they cannot been able to
complete the project and performance with good confidence level.
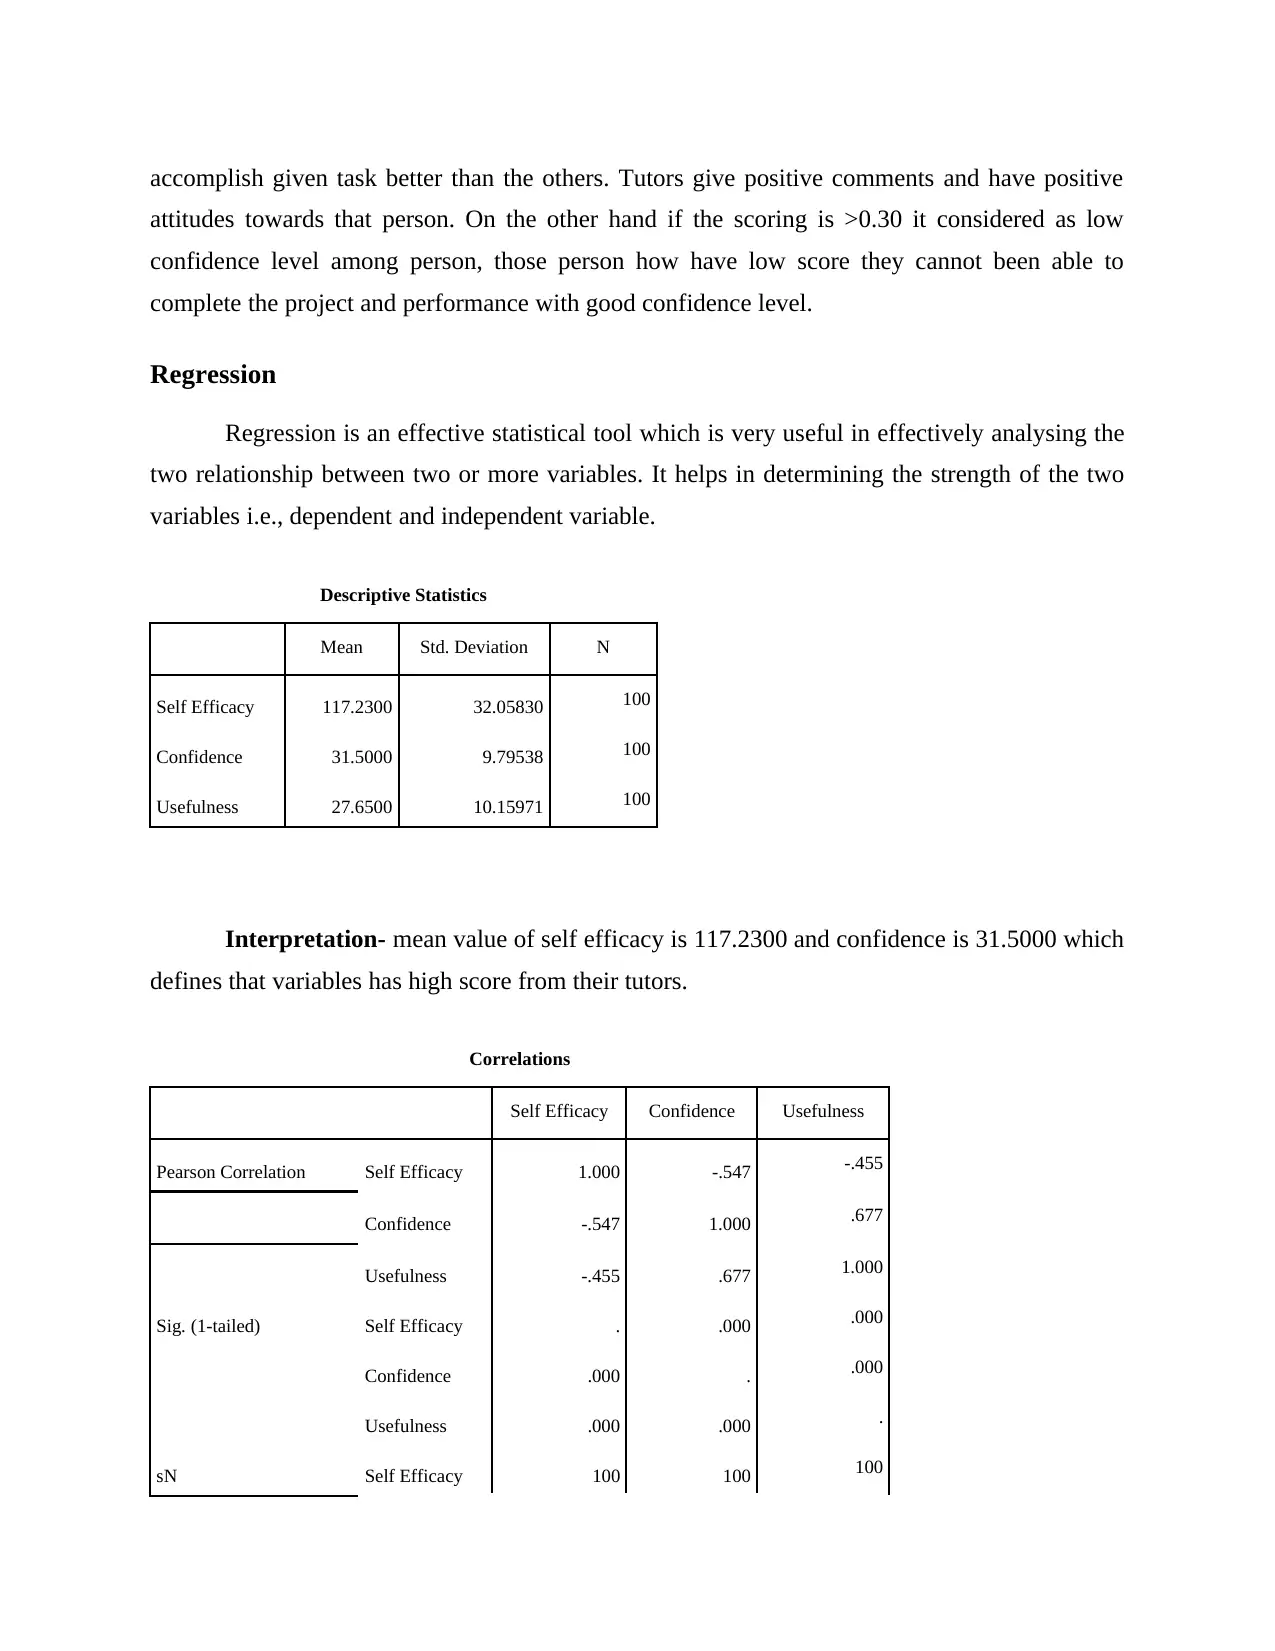
Regression
Regression is an effective statistical tool which is very useful in effectively analysing the
two relationship between two or more variables. It helps in determining the strength of the two
variables i.e., dependent and independent variable.
Descriptive Statistics
Mean Std. Deviation N
Self Efficacy 117.2300 32.05830 100
Confidence 31.5000 9.79538 100
Usefulness 27.6500 10.15971 100
Interpretation- mean value of self efficacy is 117.2300 and confidence is 31.5000 which
defines that variables has high score from their tutors.
Correlations
Self Efficacy Confidence Usefulness
Pearson Correlation Self Efficacy 1.000 -.547 -.455
Confidence -.547 1.000 .677
Usefulness -.455 .677 1.000
Sig. (1-tailed) Self Efficacy . .000 .000
Confidence .000 . .000
Usefulness .000 .000 .
sN Self Efficacy 100 100 100
attitudes towards that person. On the other hand if the scoring is >0.30 it considered as low
confidence level among person, those person how have low score they cannot been able to
complete the project and performance with good confidence level.
Regression
Regression is an effective statistical tool which is very useful in effectively analysing the
two relationship between two or more variables. It helps in determining the strength of the two
variables i.e., dependent and independent variable.
Descriptive Statistics
Mean Std. Deviation N
Self Efficacy 117.2300 32.05830 100
Confidence 31.5000 9.79538 100
Usefulness 27.6500 10.15971 100
Interpretation- mean value of self efficacy is 117.2300 and confidence is 31.5000 which
defines that variables has high score from their tutors.
Correlations
Self Efficacy Confidence Usefulness
Pearson Correlation Self Efficacy 1.000 -.547 -.455
Confidence -.547 1.000 .677
Usefulness -.455 .677 1.000
Sig. (1-tailed) Self Efficacy . .000 .000
Confidence .000 . .000
Usefulness .000 .000 .
sN Self Efficacy 100 100 100
Paraphrase This Document
Need a fresh take? Get an instant paraphrase of this document with our AI Paraphraser
Confidence 100 100 100
Usefulness 100 100 100
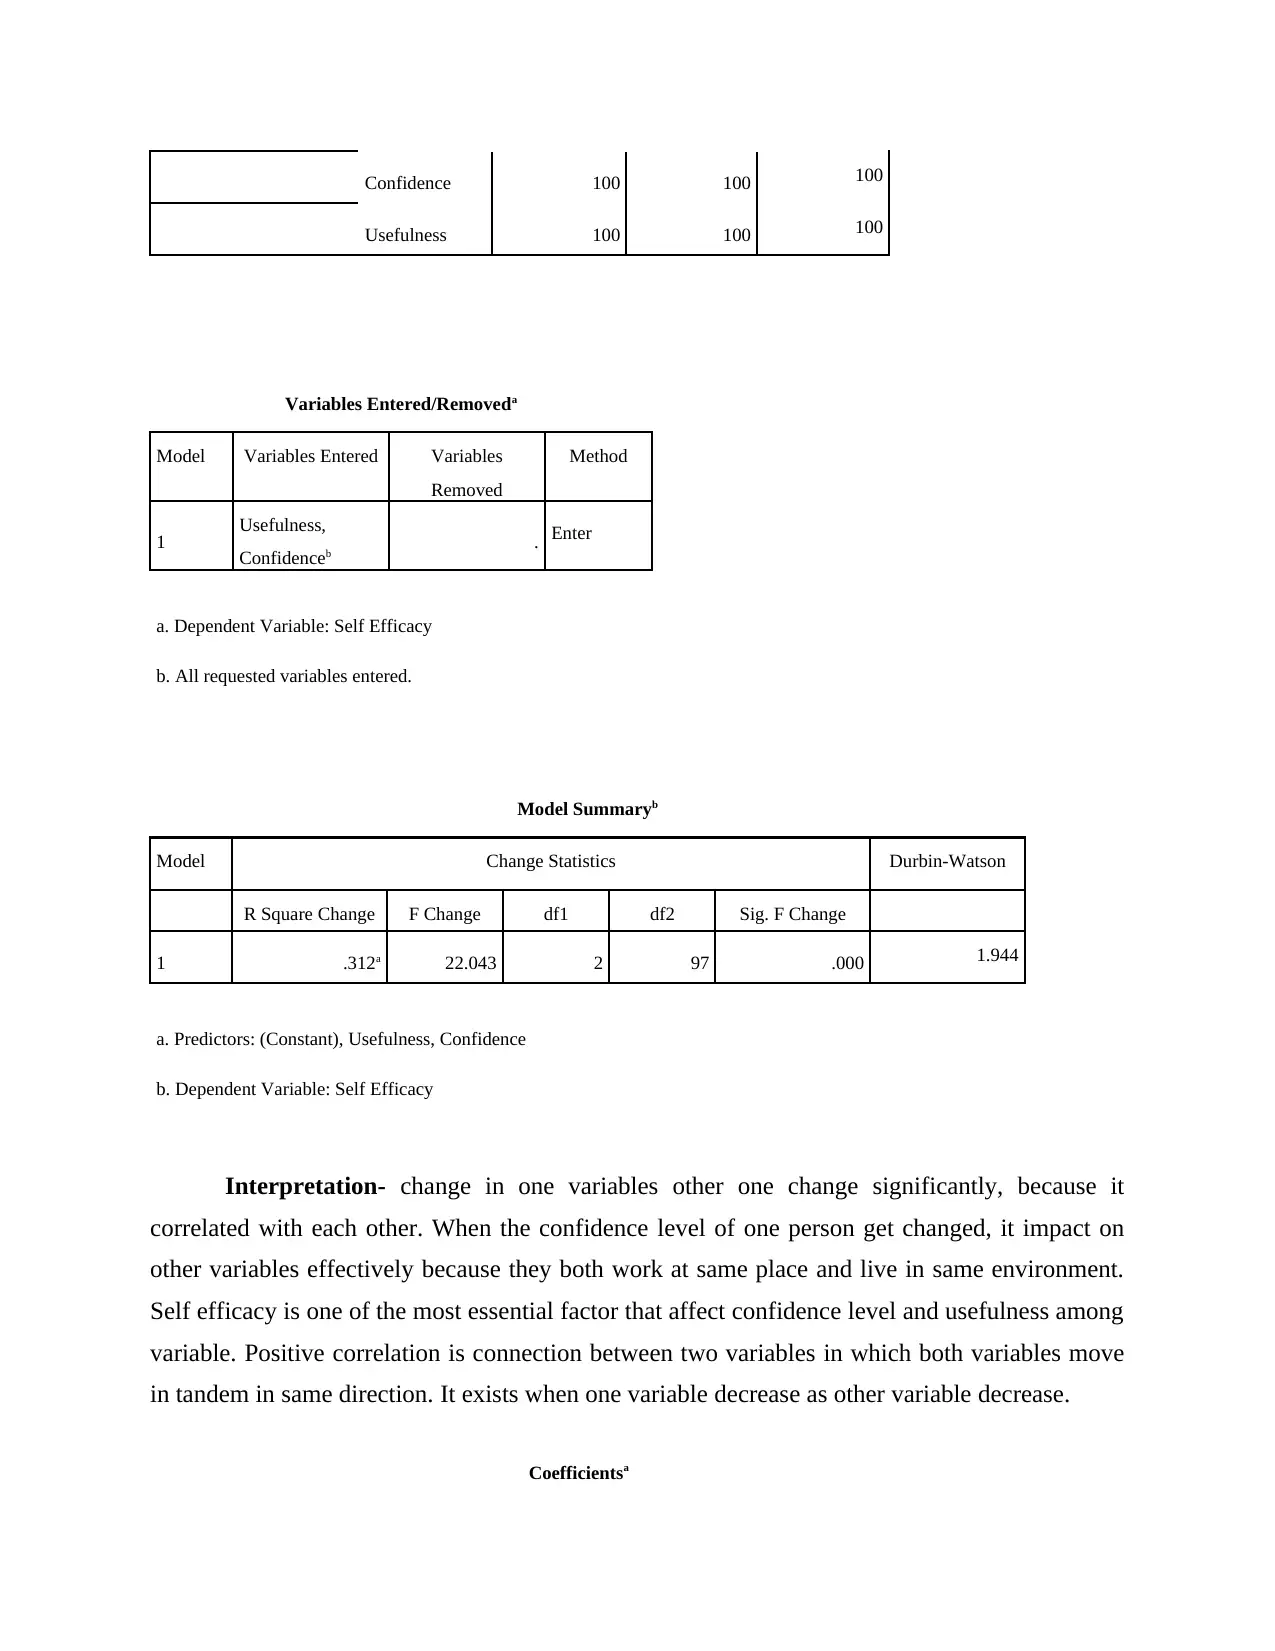
Variables Entered/Removeda
Model Variables Entered Variables
Removed
Method
1 Usefulness,
Confidenceb . Enter
a. Dependent Variable: Self Efficacy
b. All requested variables entered.
Model Summaryb
Model Change Statistics Durbin-Watson
R Square Change F Change df1 df2 Sig. F Change
1 .312a 22.043 2 97 .000 1.944
a. Predictors: (Constant), Usefulness, Confidence
b. Dependent Variable: Self Efficacy
Interpretation- change in one variables other one change significantly, because it
correlated with each other. When the confidence level of one person get changed, it impact on
other variables effectively because they both work at same place and live in same environment.
Self efficacy is one of the most essential factor that affect confidence level and usefulness among
variable. Positive correlation is connection between two variables in which both variables move
in tandem in same direction. It exists when one variable decrease as other variable decrease.
Coefficientsa
Usefulness 100 100 100
Variables Entered/Removeda
Model Variables Entered Variables
Removed
Method
1 Usefulness,
Confidenceb . Enter
a. Dependent Variable: Self Efficacy
b. All requested variables entered.
Model Summaryb
Model Change Statistics Durbin-Watson
R Square Change F Change df1 df2 Sig. F Change
1 .312a 22.043 2 97 .000 1.944
a. Predictors: (Constant), Usefulness, Confidence
b. Dependent Variable: Self Efficacy
Interpretation- change in one variables other one change significantly, because it
correlated with each other. When the confidence level of one person get changed, it impact on
other variables effectively because they both work at same place and live in same environment.
Self efficacy is one of the most essential factor that affect confidence level and usefulness among
variable. Positive correlation is connection between two variables in which both variables move
in tandem in same direction. It exists when one variable decrease as other variable decrease.
Coefficientsa
Model Unstandardized Coefficients Standardized
Coefficients
t Sig.
B Std. Error Beta
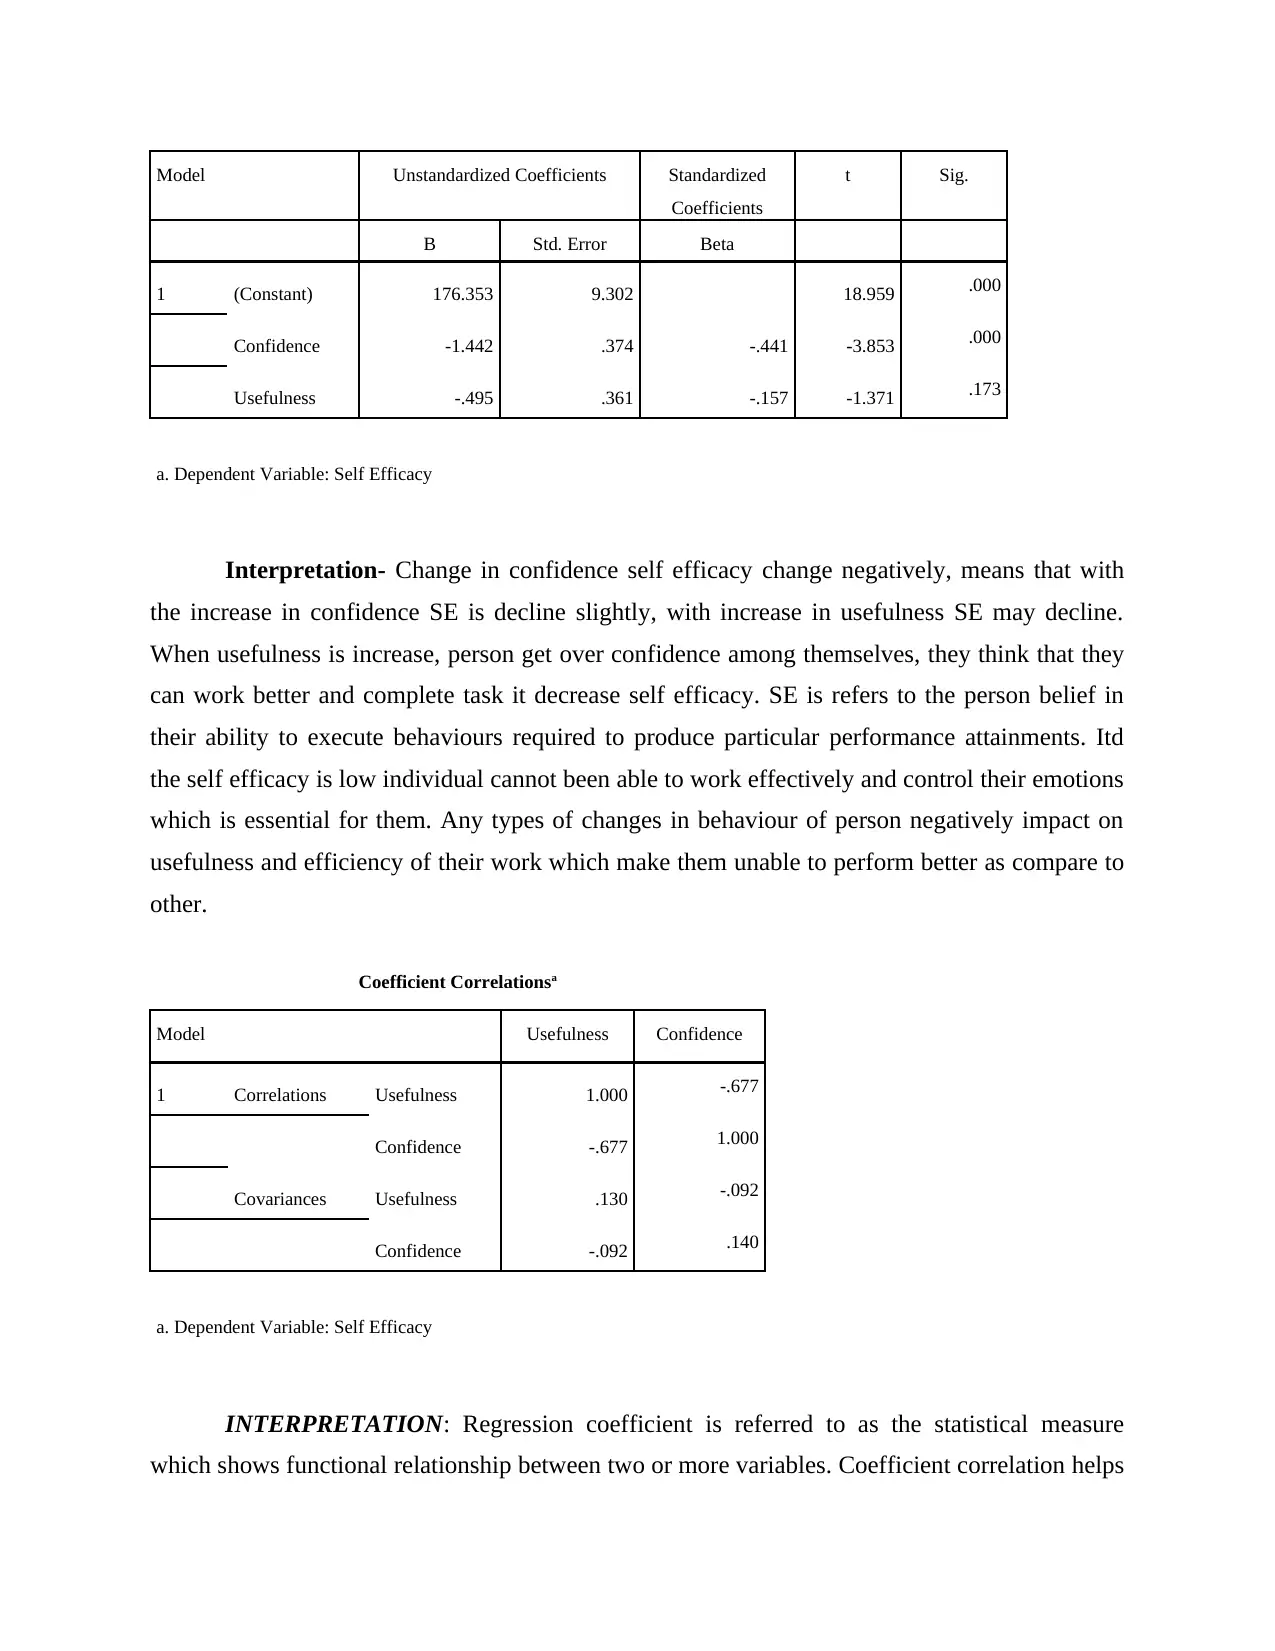
1 (Constant) 176.353 9.302 18.959 .000
Confidence -1.442 .374 -.441 -3.853 .000
Usefulness -.495 .361 -.157 -1.371 .173
a. Dependent Variable: Self Efficacy
Interpretation- Change in confidence self efficacy change negatively, means that with
the increase in confidence SE is decline slightly, with increase in usefulness SE may decline.
When usefulness is increase, person get over confidence among themselves, they think that they
can work better and complete task it decrease self efficacy. SE is refers to the person belief in
their ability to execute behaviours required to produce particular performance attainments. Itd
the self efficacy is low individual cannot been able to work effectively and control their emotions
which is essential for them. Any types of changes in behaviour of person negatively impact on
usefulness and efficiency of their work which make them unable to perform better as compare to
other.
Coefficient Correlationsa
Model Usefulness Confidence
1 Correlations Usefulness 1.000 -.677
Confidence -.677 1.000
Covariances Usefulness .130 -.092
Confidence -.092 .140
a. Dependent Variable: Self Efficacy
INTERPRETATION: Regression coefficient is referred to as the statistical measure
which shows functional relationship between two or more variables. Coefficient correlation helps
Coefficients
t Sig.
B Std. Error Beta
1 (Constant) 176.353 9.302 18.959 .000
Confidence -1.442 .374 -.441 -3.853 .000
Usefulness -.495 .361 -.157 -1.371 .173
a. Dependent Variable: Self Efficacy
Interpretation- Change in confidence self efficacy change negatively, means that with
the increase in confidence SE is decline slightly, with increase in usefulness SE may decline.
When usefulness is increase, person get over confidence among themselves, they think that they
can work better and complete task it decrease self efficacy. SE is refers to the person belief in
their ability to execute behaviours required to produce particular performance attainments. Itd
the self efficacy is low individual cannot been able to work effectively and control their emotions
which is essential for them. Any types of changes in behaviour of person negatively impact on
usefulness and efficiency of their work which make them unable to perform better as compare to
other.
Coefficient Correlationsa
Model Usefulness Confidence
1 Correlations Usefulness 1.000 -.677
Confidence -.677 1.000
Covariances Usefulness .130 -.092
Confidence -.092 .140
a. Dependent Variable: Self Efficacy
INTERPRETATION: Regression coefficient is referred to as the statistical measure
which shows functional relationship between two or more variables. Coefficient correlation helps
⊘ This is a preview!⊘
Do you want full access?
Subscribe today to unlock all pages.
Trusted by 1+ million students worldwide
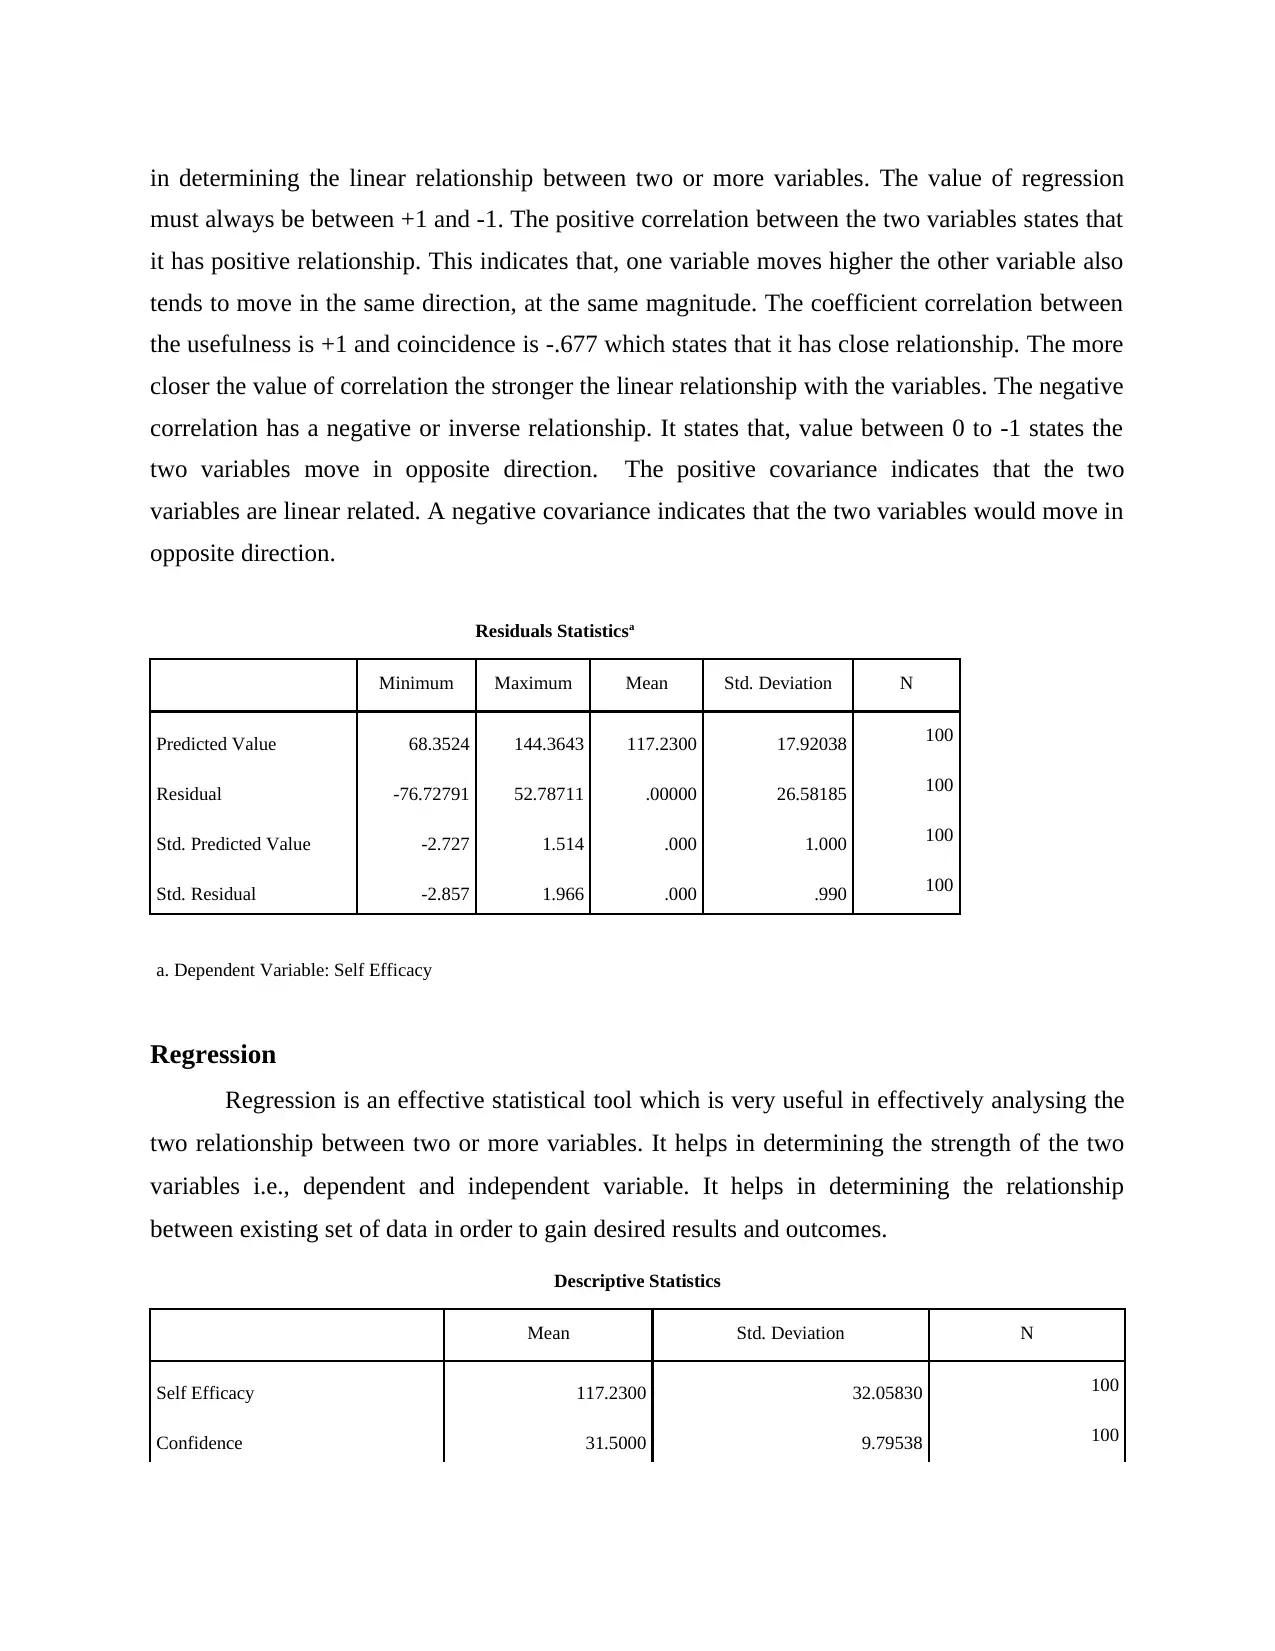
in determining the linear relationship between two or more variables. The value of regression
must always be between +1 and -1. The positive correlation between the two variables states that
it has positive relationship. This indicates that, one variable moves higher the other variable also
tends to move in the same direction, at the same magnitude. The coefficient correlation between
the usefulness is +1 and coincidence is -.677 which states that it has close relationship. The more
closer the value of correlation the stronger the linear relationship with the variables. The negative
correlation has a negative or inverse relationship. It states that, value between 0 to -1 states the
two variables move in opposite direction. The positive covariance indicates that the two
variables are linear related. A negative covariance indicates that the two variables would move in
opposite direction.
Residuals Statisticsa
Minimum Maximum Mean Std. Deviation N
Predicted Value 68.3524 144.3643 117.2300 17.92038 100
Residual -76.72791 52.78711 .00000 26.58185 100
Std. Predicted Value -2.727 1.514 .000 1.000 100
Std. Residual -2.857 1.966 .000 .990 100
a. Dependent Variable: Self Efficacy
Regression
Regression is an effective statistical tool which is very useful in effectively analysing the
two relationship between two or more variables. It helps in determining the strength of the two
variables i.e., dependent and independent variable. It helps in determining the relationship
between existing set of data in order to gain desired results and outcomes.
Descriptive Statistics
Mean Std. Deviation N
Self Efficacy 117.2300 32.05830 100
Confidence 31.5000 9.79538 100
Paraphrase This Document
Need a fresh take? Get an instant paraphrase of this document with our AI Paraphraser
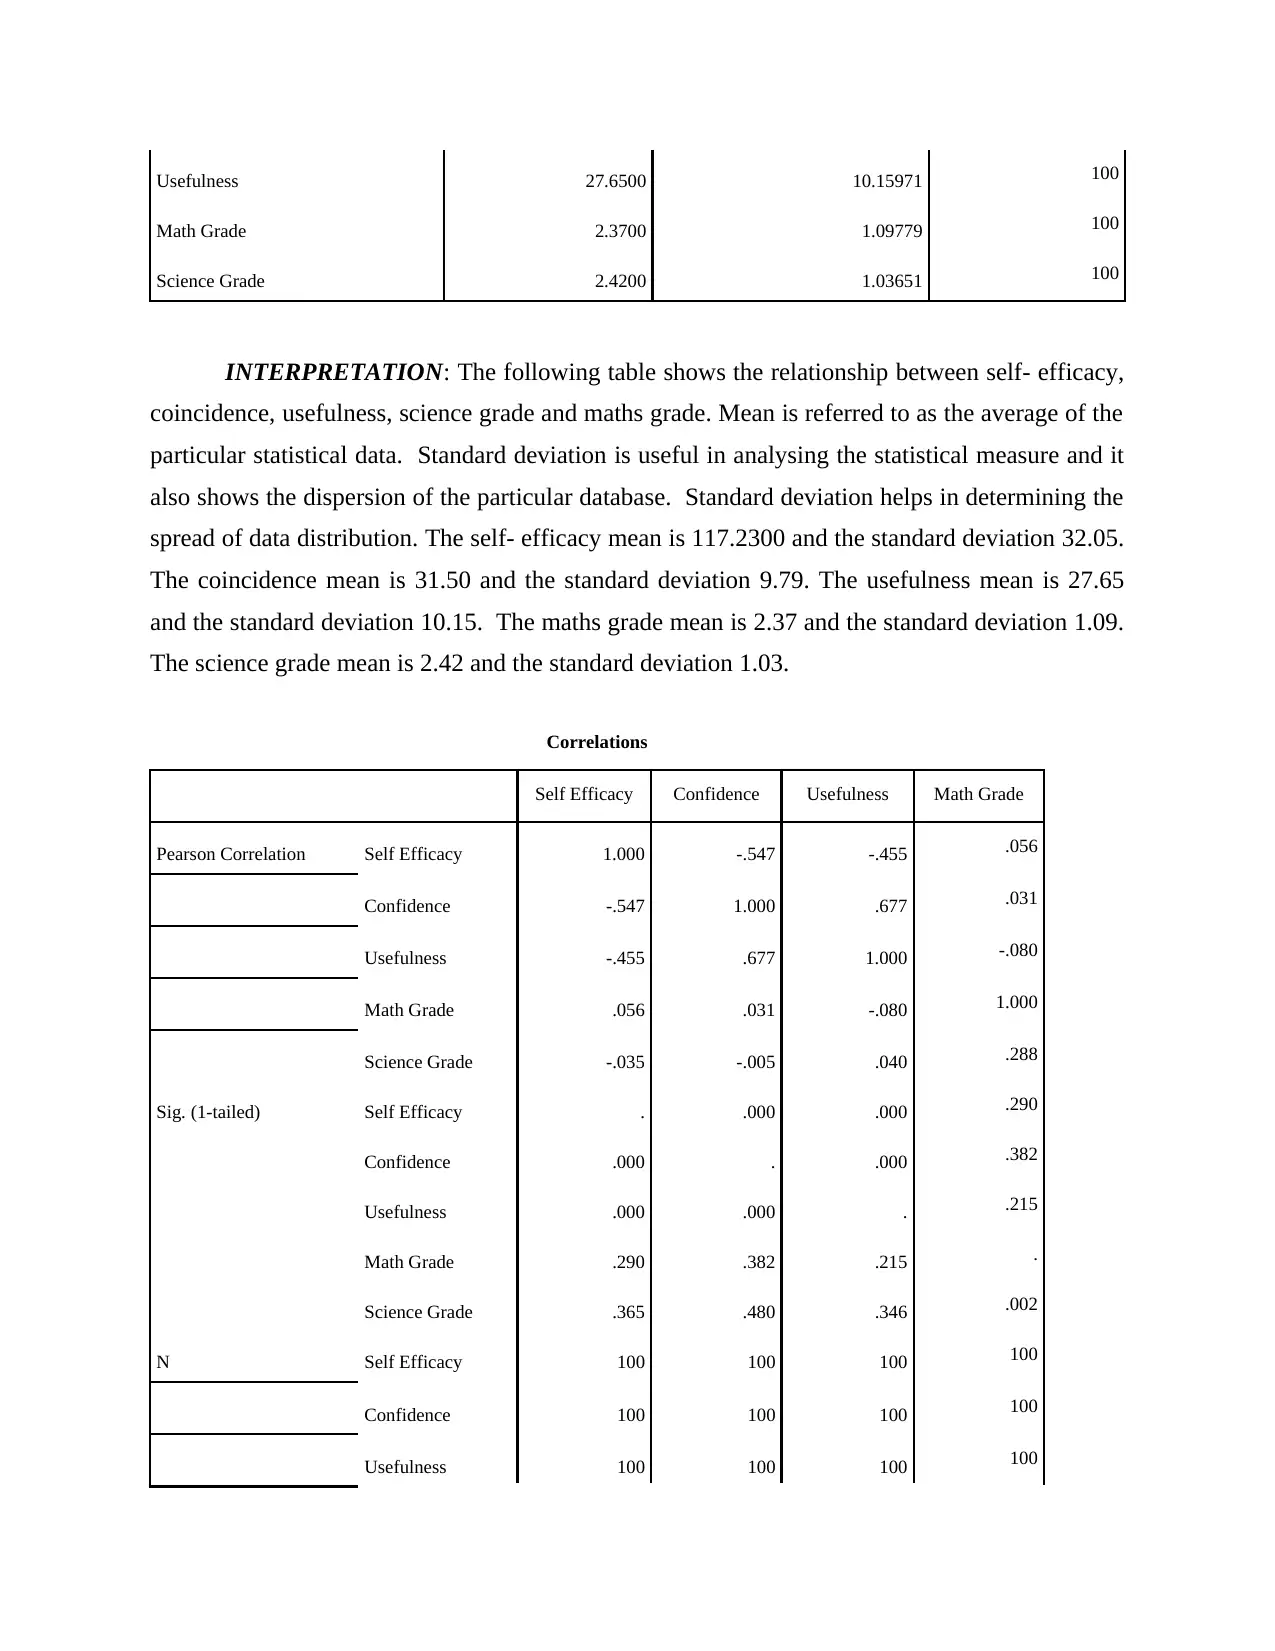
Usefulness 27.6500 10.15971 100
Math Grade 2.3700 1.09779 100
Science Grade 2.4200 1.03651 100
INTERPRETATION: The following table shows the relationship between self- efficacy,
coincidence, usefulness, science grade and maths grade. Mean is referred to as the average of the
particular statistical data. Standard deviation is useful in analysing the statistical measure and it
also shows the dispersion of the particular database. Standard deviation helps in determining the
spread of data distribution. The self- efficacy mean is 117.2300 and the standard deviation 32.05.
The coincidence mean is 31.50 and the standard deviation 9.79. The usefulness mean is 27.65
and the standard deviation 10.15. The maths grade mean is 2.37 and the standard deviation 1.09.
The science grade mean is 2.42 and the standard deviation 1.03.
Correlations
Self Efficacy Confidence Usefulness Math Grade
Pearson Correlation Self Efficacy 1.000 -.547 -.455 .056
Confidence -.547 1.000 .677 .031
Usefulness -.455 .677 1.000 -.080
Math Grade .056 .031 -.080 1.000
Science Grade -.035 -.005 .040 .288
Sig. (1-tailed) Self Efficacy . .000 .000 .290
Confidence .000 . .000 .382
Usefulness .000 .000 . .215
Math Grade .290 .382 .215 .
Science Grade .365 .480 .346 .002
N Self Efficacy 100 100 100 100
Confidence 100 100 100 100
Usefulness 100 100 100 100
Math Grade 100 100 100 100
Science Grade 100 100 100 100
Correlations
Science Grade
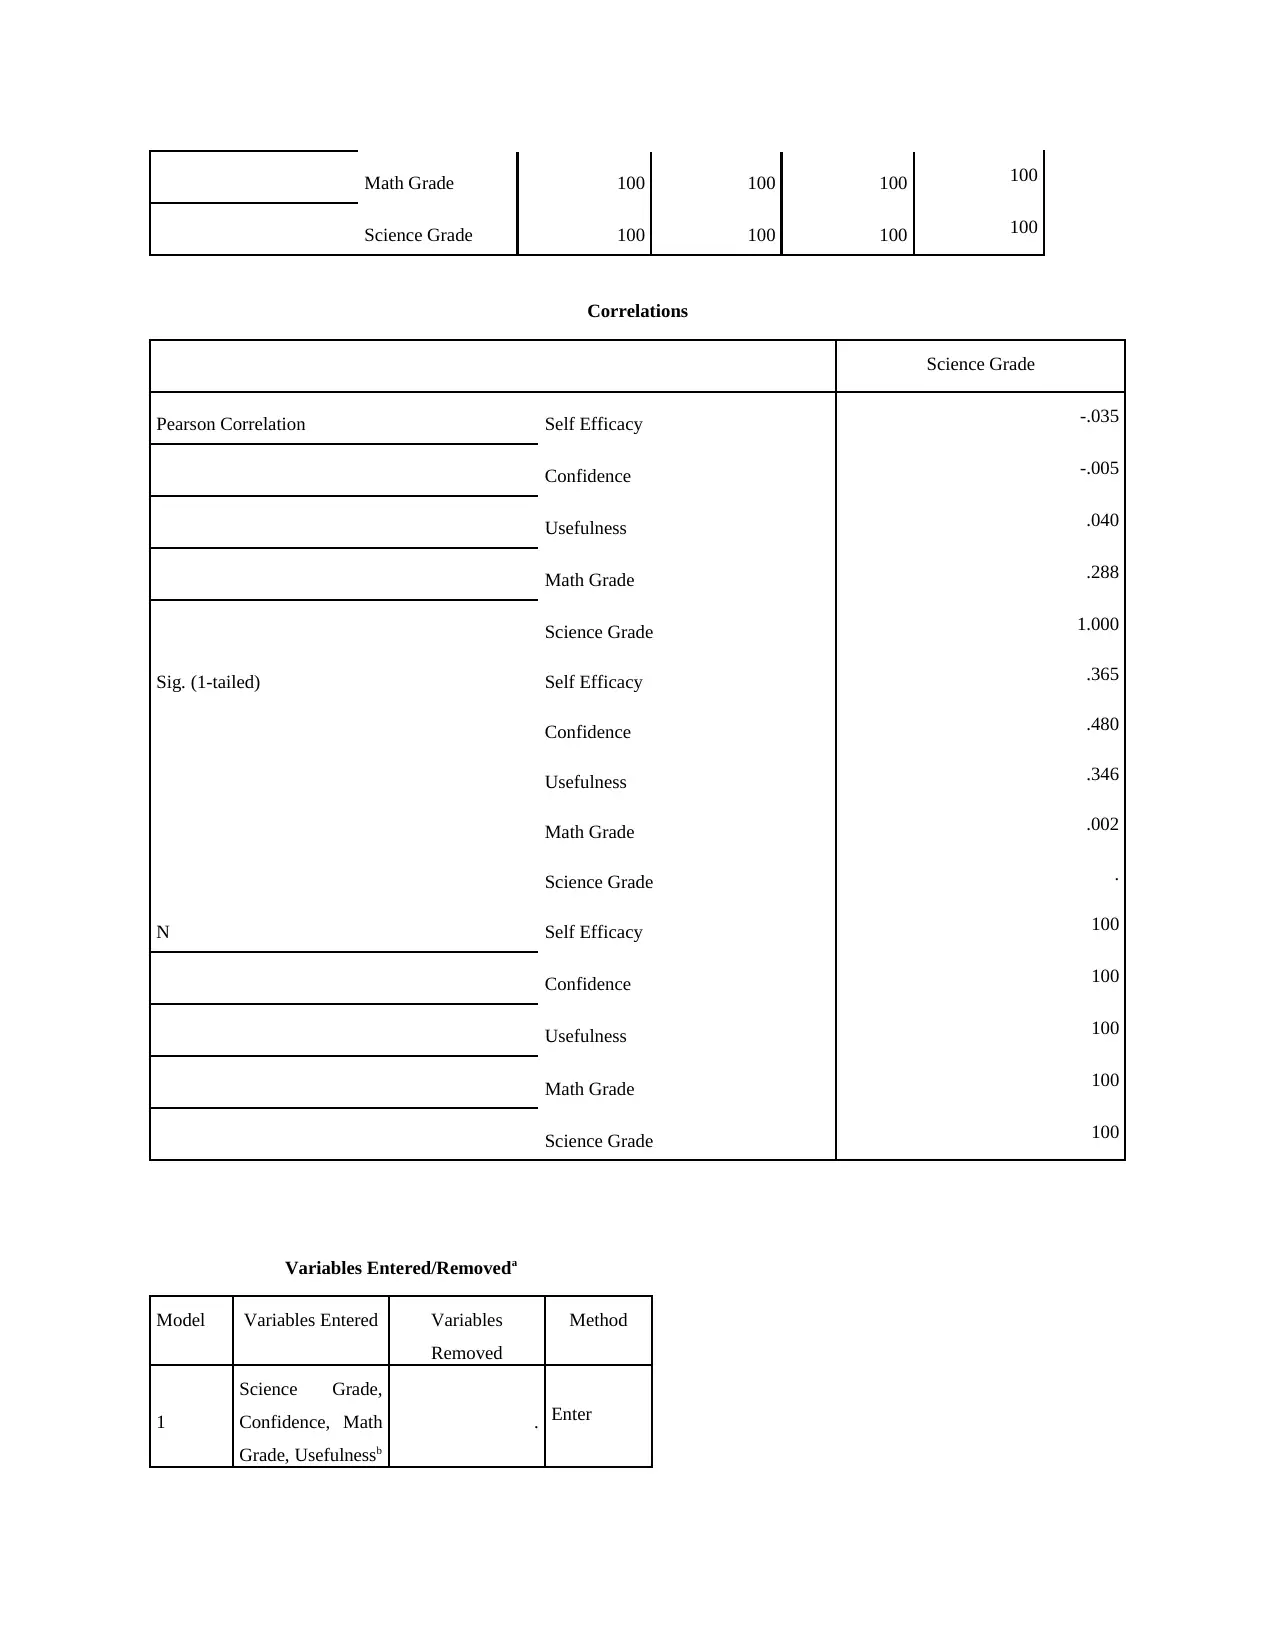
Pearson Correlation Self Efficacy -.035
Confidence -.005
Usefulness .040
Math Grade .288
Science Grade 1.000
Sig. (1-tailed) Self Efficacy .365
Confidence .480
Usefulness .346
Math Grade .002
Science Grade .
N Self Efficacy 100
Confidence 100
Usefulness 100
Math Grade 100
Science Grade 100
Variables Entered/Removeda
Model Variables Entered Variables
Removed
Method
1
Science Grade,
Confidence, Math
Grade, Usefulnessb
. Enter
Science Grade 100 100 100 100
Correlations
Science Grade
Pearson Correlation Self Efficacy -.035
Confidence -.005
Usefulness .040
Math Grade .288
Science Grade 1.000
Sig. (1-tailed) Self Efficacy .365
Confidence .480
Usefulness .346
Math Grade .002
Science Grade .
N Self Efficacy 100
Confidence 100
Usefulness 100
Math Grade 100
Science Grade 100
Variables Entered/Removeda
Model Variables Entered Variables
Removed
Method
1
Science Grade,
Confidence, Math
Grade, Usefulnessb
. Enter
⊘ This is a preview!⊘
Do you want full access?
Subscribe today to unlock all pages.
Trusted by 1+ million students worldwide
a. Dependent Variable: Self Efficacy
b. All requested variables entered.
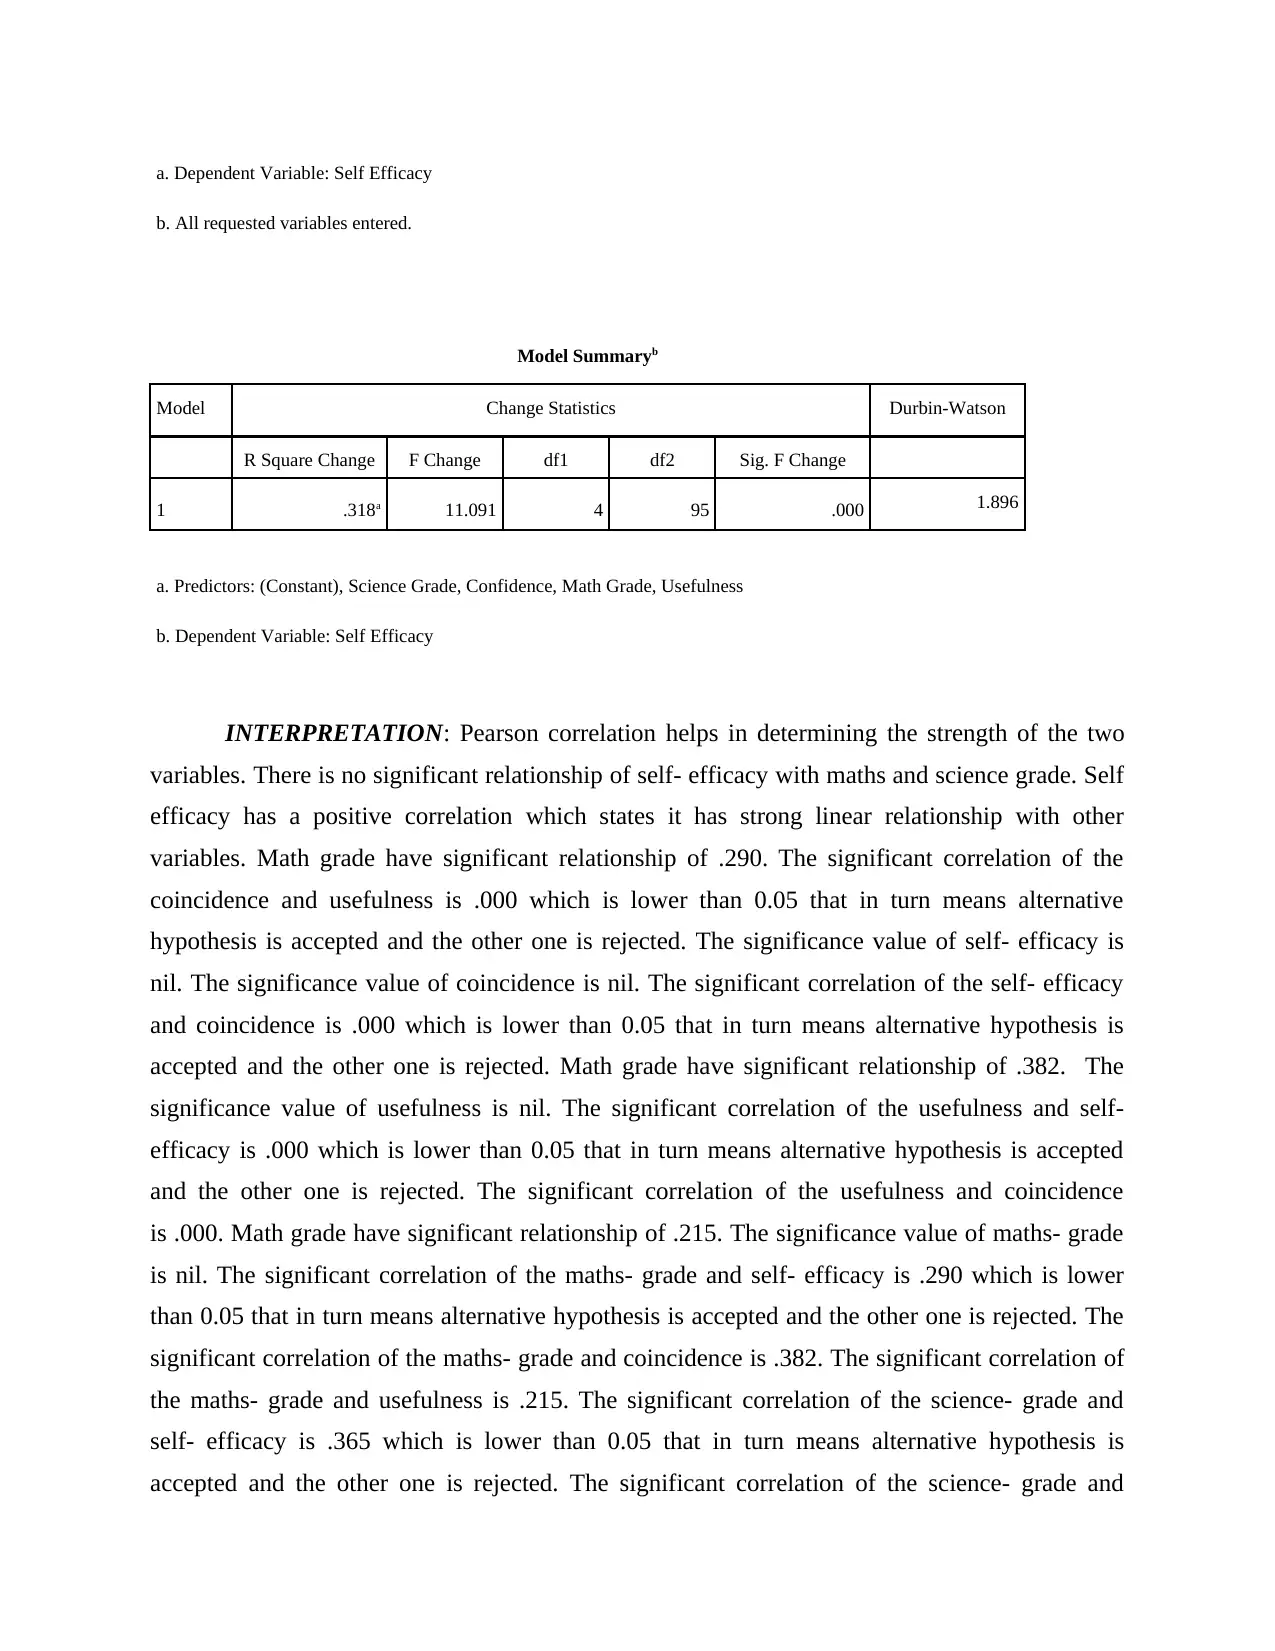
Model Summaryb
Model Change Statistics Durbin-Watson
R Square Change F Change df1 df2 Sig. F Change
1 .318a 11.091 4 95 .000 1.896
a. Predictors: (Constant), Science Grade, Confidence, Math Grade, Usefulness
b. Dependent Variable: Self Efficacy
INTERPRETATION: Pearson correlation helps in determining the strength of the two
variables. There is no significant relationship of self- efficacy with maths and science grade. Self
efficacy has a positive correlation which states it has strong linear relationship with other
variables. Math grade have significant relationship of .290. The significant correlation of the
coincidence and usefulness is .000 which is lower than 0.05 that in turn means alternative
hypothesis is accepted and the other one is rejected. The significance value of self- efficacy is
nil. The significance value of coincidence is nil. The significant correlation of the self- efficacy
and coincidence is .000 which is lower than 0.05 that in turn means alternative hypothesis is
accepted and the other one is rejected. Math grade have significant relationship of .382. The
significance value of usefulness is nil. The significant correlation of the usefulness and self-
efficacy is .000 which is lower than 0.05 that in turn means alternative hypothesis is accepted
and the other one is rejected. The significant correlation of the usefulness and coincidence
is .000. Math grade have significant relationship of .215. The significance value of maths- grade
is nil. The significant correlation of the maths- grade and self- efficacy is .290 which is lower
than 0.05 that in turn means alternative hypothesis is accepted and the other one is rejected. The
significant correlation of the maths- grade and coincidence is .382. The significant correlation of
the maths- grade and usefulness is .215. The significant correlation of the science- grade and
self- efficacy is .365 which is lower than 0.05 that in turn means alternative hypothesis is
accepted and the other one is rejected. The significant correlation of the science- grade and
b. All requested variables entered.
Model Summaryb
Model Change Statistics Durbin-Watson
R Square Change F Change df1 df2 Sig. F Change
1 .318a 11.091 4 95 .000 1.896
a. Predictors: (Constant), Science Grade, Confidence, Math Grade, Usefulness
b. Dependent Variable: Self Efficacy
INTERPRETATION: Pearson correlation helps in determining the strength of the two
variables. There is no significant relationship of self- efficacy with maths and science grade. Self
efficacy has a positive correlation which states it has strong linear relationship with other
variables. Math grade have significant relationship of .290. The significant correlation of the
coincidence and usefulness is .000 which is lower than 0.05 that in turn means alternative
hypothesis is accepted and the other one is rejected. The significance value of self- efficacy is
nil. The significance value of coincidence is nil. The significant correlation of the self- efficacy
and coincidence is .000 which is lower than 0.05 that in turn means alternative hypothesis is
accepted and the other one is rejected. Math grade have significant relationship of .382. The
significance value of usefulness is nil. The significant correlation of the usefulness and self-
efficacy is .000 which is lower than 0.05 that in turn means alternative hypothesis is accepted
and the other one is rejected. The significant correlation of the usefulness and coincidence
is .000. Math grade have significant relationship of .215. The significance value of maths- grade
is nil. The significant correlation of the maths- grade and self- efficacy is .290 which is lower
than 0.05 that in turn means alternative hypothesis is accepted and the other one is rejected. The
significant correlation of the maths- grade and coincidence is .382. The significant correlation of
the maths- grade and usefulness is .215. The significant correlation of the science- grade and
self- efficacy is .365 which is lower than 0.05 that in turn means alternative hypothesis is
accepted and the other one is rejected. The significant correlation of the science- grade and
Paraphrase This Document
Need a fresh take? Get an instant paraphrase of this document with our AI Paraphraser
coincidence is .480. The significant correlation of the science- grade and usefulness is .346. The
significant correlation of the science- grade and usefulness is .002.
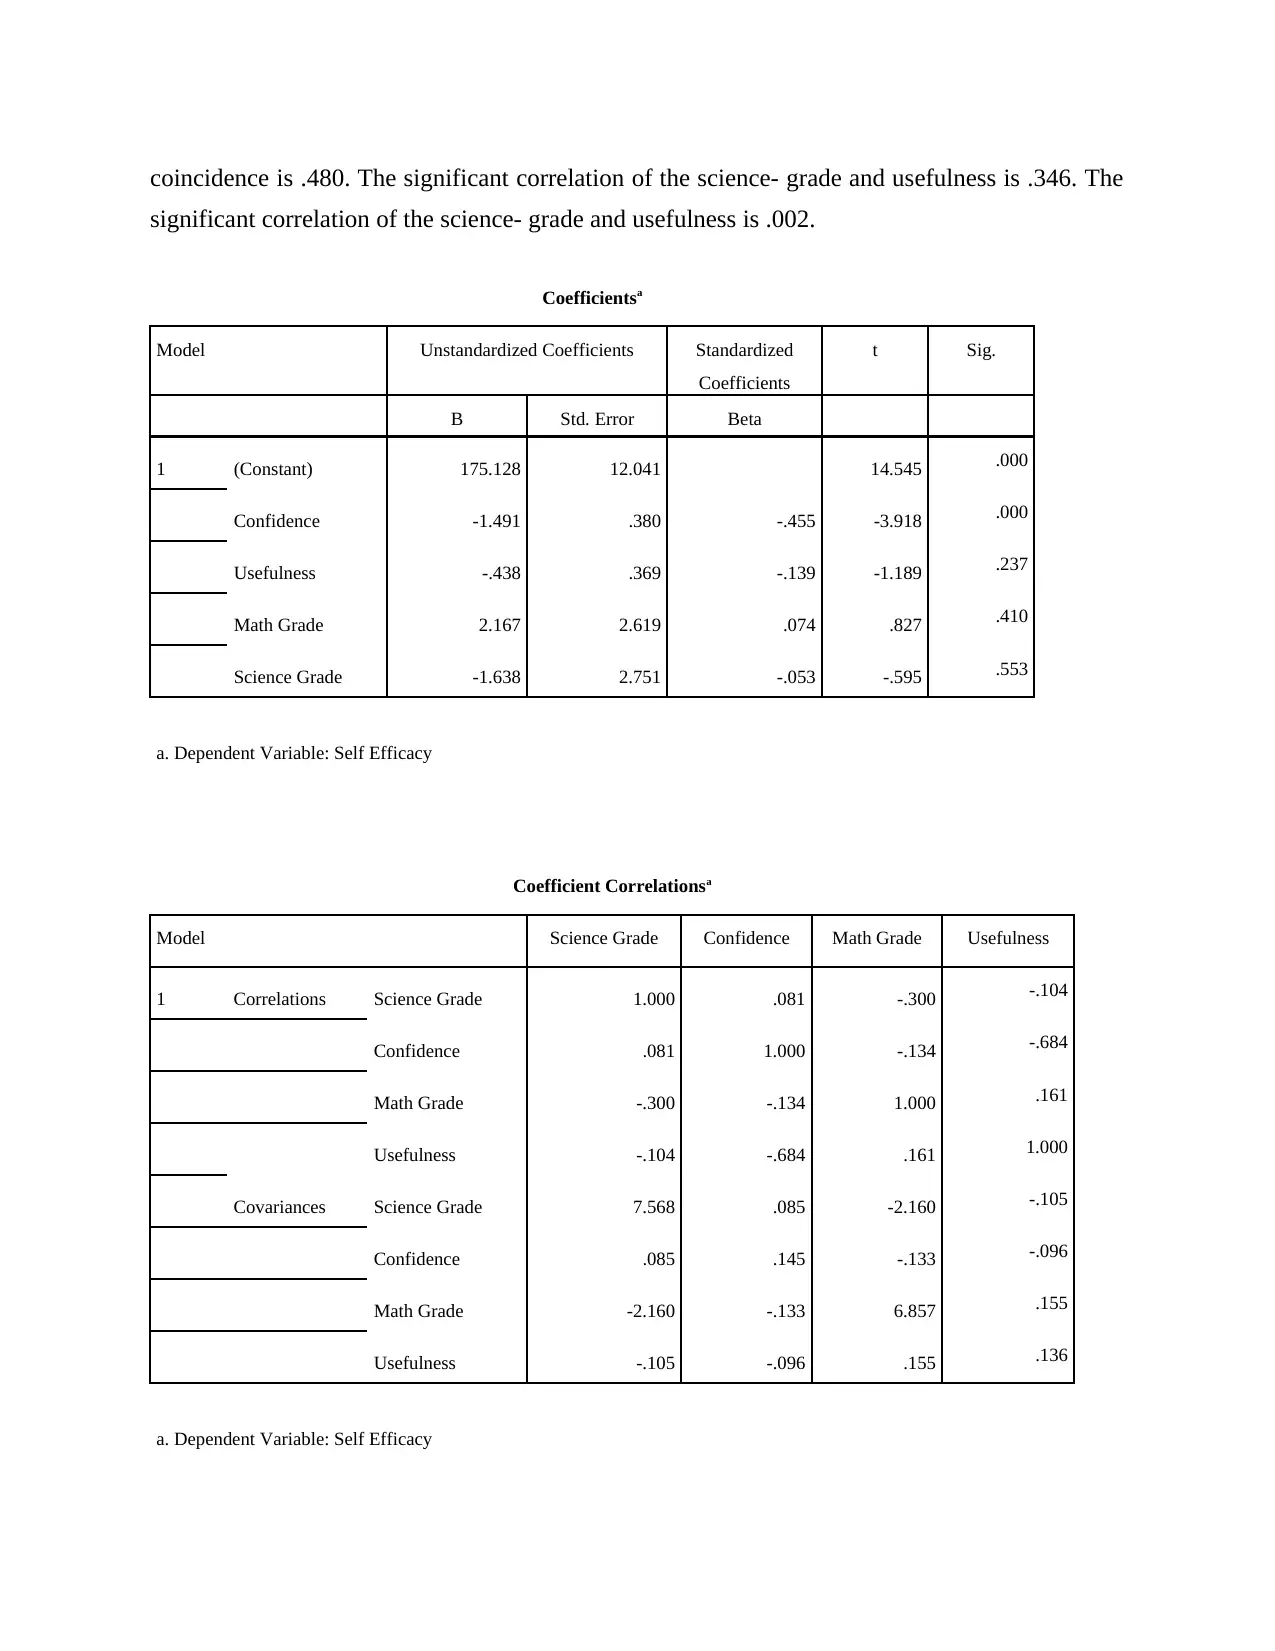
Coefficientsa
Model Unstandardized Coefficients Standardized
Coefficients
t Sig.
B Std. Error Beta
1 (Constant) 175.128 12.041 14.545 .000
Confidence -1.491 .380 -.455 -3.918 .000
Usefulness -.438 .369 -.139 -1.189 .237
Math Grade 2.167 2.619 .074 .827 .410
Science Grade -1.638 2.751 -.053 -.595 .553
a. Dependent Variable: Self Efficacy
Coefficient Correlationsa
Model Science Grade Confidence Math Grade Usefulness
1 Correlations Science Grade 1.000 .081 -.300 -.104
Confidence .081 1.000 -.134 -.684
Math Grade -.300 -.134 1.000 .161
Usefulness -.104 -.684 .161 1.000
Covariances Science Grade 7.568 .085 -2.160 -.105
Confidence .085 .145 -.133 -.096
Math Grade -2.160 -.133 6.857 .155
Usefulness -.105 -.096 .155 .136
a. Dependent Variable: Self Efficacy
significant correlation of the science- grade and usefulness is .002.
Coefficientsa
Model Unstandardized Coefficients Standardized
Coefficients
t Sig.
B Std. Error Beta
1 (Constant) 175.128 12.041 14.545 .000
Confidence -1.491 .380 -.455 -3.918 .000
Usefulness -.438 .369 -.139 -1.189 .237
Math Grade 2.167 2.619 .074 .827 .410
Science Grade -1.638 2.751 -.053 -.595 .553
a. Dependent Variable: Self Efficacy
Coefficient Correlationsa
Model Science Grade Confidence Math Grade Usefulness
1 Correlations Science Grade 1.000 .081 -.300 -.104
Confidence .081 1.000 -.134 -.684
Math Grade -.300 -.134 1.000 .161
Usefulness -.104 -.684 .161 1.000
Covariances Science Grade 7.568 .085 -2.160 -.105
Confidence .085 .145 -.133 -.096
Math Grade -2.160 -.133 6.857 .155
Usefulness -.105 -.096 .155 .136
a. Dependent Variable: Self Efficacy
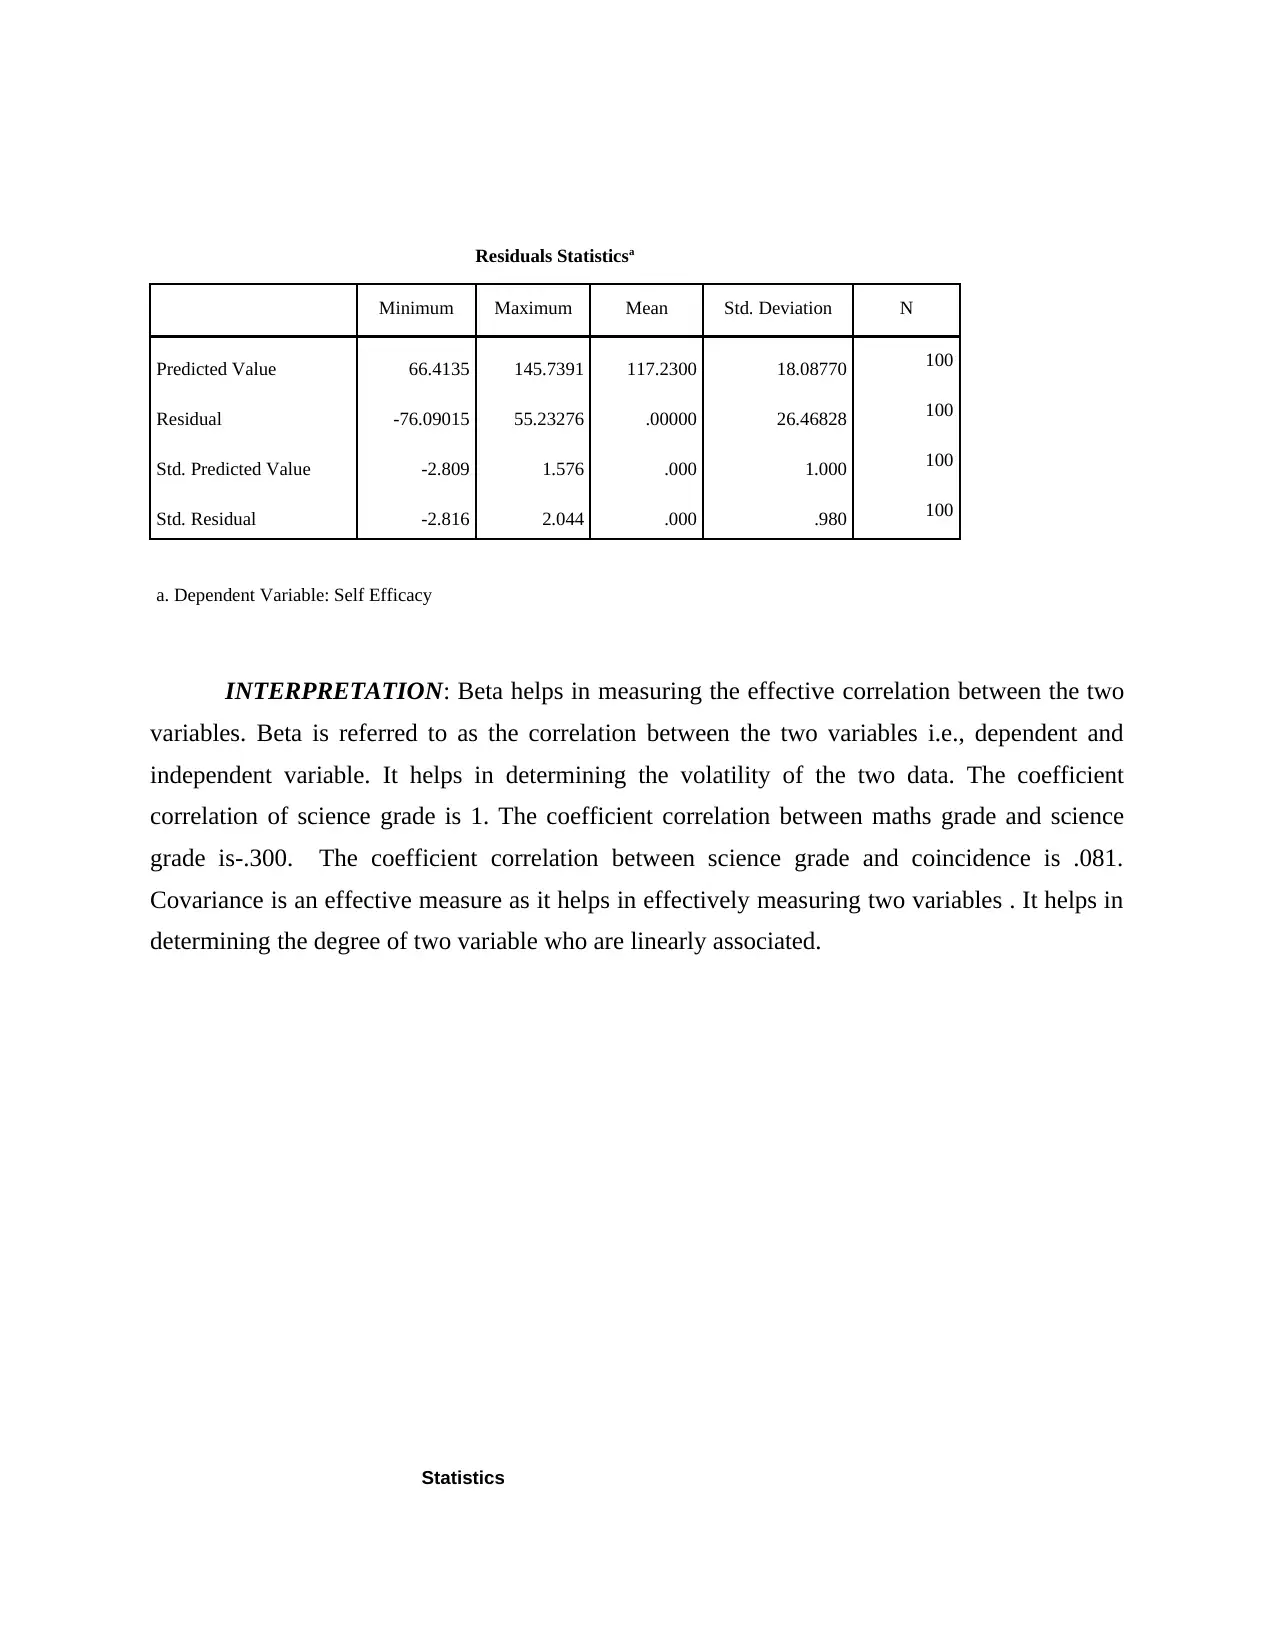
Residuals Statisticsa
Minimum Maximum Mean Std. Deviation N
Predicted Value 66.4135 145.7391 117.2300 18.08770 100
Residual -76.09015 55.23276 .00000 26.46828 100
Std. Predicted Value -2.809 1.576 .000 1.000 100
Std. Residual -2.816 2.044 .000 .980 100
a. Dependent Variable: Self Efficacy
INTERPRETATION: Beta helps in measuring the effective correlation between the two
variables. Beta is referred to as the correlation between the two variables i.e., dependent and
independent variable. It helps in determining the volatility of the two data. The coefficient
correlation of science grade is 1. The coefficient correlation between maths grade and science
grade is-.300. The coefficient correlation between science grade and coincidence is .081.
Covariance is an effective measure as it helps in effectively measuring two variables . It helps in
determining the degree of two variable who are linearly associated.
Statistics
⊘ This is a preview!⊘
Do you want full access?
Subscribe today to unlock all pages.
Trusted by 1+ million students worldwide
1 out of 16
Related Documents


Your All-in-One AI-Powered Toolkit for Academic Success.
+13062052269
info@desklib.com
Available 24*7 on WhatsApp / Email
![[object Object]](/_next/static/media/star-bottom.7253800d.svg)
Unlock your academic potential
Copyright © 2020–2026 A2Z Services. All Rights Reserved. Developed and managed by ZUCOL.