CVEN9892 Assignment 1: Assessing the Life Cycle of PET Bottles
VerifiedAdded on 2023/07/04
|20
|5224
|109
Report
AI Summary
This report presents a Life Cycle Assessment (LCA) of PET bottles used for drinking water supply in Australia, evaluating the environmental impact across four scenarios using OpenLCA software. The scenarios include reusing a single PET bottle with tap water, importing bottles and water from China using wind power, sourcing all materials and energy from Australia using coal power, and using a combination of Australian resources and recycled PET with coal power. The analysis considers climate change, land acidification, ozone layer depletion, human toxicity, and eutrophication. The findings indicate that reusing bottles has the least environmental impact, while the other scenarios vary depending on the energy source, material origin, and transportation methods. The report concludes by discussing the influencing factors and uncertainties associated with each scenario, providing a comprehensive overview of the environmental considerations related to PET bottle usage.
CVEN9892 Assignment
1ASSIGNMENT COVER
SHEET
Note that Assignment 1 is submitted electronically via Turnitin.
Make this cover sheet the first sheet of your assignment report file (does not count towards the page limit).
ACADEMIC REQUIREMENTS
Before submitting this assignment, students are strongly advised to:
Review the assessment requirements contained in the briefing document for the assignment;
Review the various matters related to assessment in the relevant Course Outline;
Review the Plagiarism and Academic Integrity website at https://student.unsw.edu.au/plagiarism to
ensure they are familiar with the requirements to provide appropriate acknowledgement of source
materials; and
Retain a copy of this assessment for their records and in case it is misplaced and has to be re-submitted.
If after reviewing this material there is any doubt about assessment requirements, then in the first instance the
student should consult with the Course Coordinator and then if necessary with the Director of the
Undergraduate Teaching and Learning Committee.
While students are generally encouraged to work with other students to enhance learning, all assignments
submitted for assessment by a student must be their entire own work and they may be required to explain any
or all parts of the assignment to the Course Coordinator or other authorised persons. Collusion is where
another person(s) assist in the preparation of an assignment without the consent or knowledge of the Course
Coordinator.
Plagiarism and Collusion are considered as Academic Misconduct and will be dealt with according to
University Policy.
STUDENT DECLARATION OF ACADEMIC INTEGRITY
Each of us declares that this assessment item is our own work, except where acknowledged, and has not been
submitted for academic credit elsewhere, and acknowledge that the assessor of this item may, for the purpose
of assessing this item:
Reproduce this assessment item and provide a copy to another member of the University; and/or
Communicate a copy of this assessment item to a plagiarism checking service (which may then retain a
copy of the assessment item on its database for the purpose of future plagiarism checking).
We certify that we have read and understood the University Rules in respect of Student Academic
Misconduct.
GROUP NAME or NUMBER (include this in the name of the file you submit): A1 Group 20
Surname:_ ___Name: __ID:____ SIGNATURE: ________ CONTRIBUTION (%): 33.33
Surname:__ __Name: _ID: z____ SIGNATURE:_________ CONTRIBUTION (%): 33.33
Surname:______Name: ____ID: Z____ SIGNATURE:_________ CONTRIBUTION (%): 33.33
Paraphrase This Document
Need a fresh take? Get an instant paraphrase of this document with our AI Paraphraser
Executive summary
According to the survey, Australians sell hundreds of millions of plastic bottles every year. The
number of PET bottles required will grow over the next five years due to market demand. 53% of
these plastic bottles end up in landfill and 12% are discharged into the environment or ocean, where it
takes 1,000 years to break down naturally. This paper will use OpenLCA to analyze the environmental
impact of using PET bottles to supply Australians with drinking water for a year in four scenarios.
Scenario 1: The Australian re-uses the same PET bottle for a year with water supplied through the
local Australian tap water supply system.
Scenario 2: The production of PET bottles and the filling of drinking water are both in China, using
wind power and using 100% raw materials, and transported from China to Australia using a
combination of sea and rail.
Scenario 3: 100% of the raw materials for drinking water and PET bottles are provided by Australia,
the energy provides by burn hard coal, and the local transportation method is lorry.
Scenario 4: Australia supplies 50% drinking water raw material and 50% recycled PET granulate,
powered by hard coal and transported locally using lorry.
In each scenario, we adjust parameters for country regions, energy types, and modes of transportation
to improve the plausibility of our tasks. The raw material, production, use, recycling and eventual
disappearance of plastic bottles will be assessed, and the final results will include the following
categories: climate change (GWP100), land acidification (TAP100), ozone layer depletion (ODP100),
human toxicity (HTPinf), rich Nutritization (FEP100).
The conclusions was based on our group discussions and openLCA result. The environmental impact
of Scenario 1 is negligible, and that of Scenario 2 is next. Compared with Scenario 3 and Scenario 4,
the impact on the environment is not much different, but Scenario 4 uses recyclable materials, so we
believe that Scenario 3 has the greatest impact on the environment.
Contents
1.0 Introduction......................................................................................................................... 1
1.1 Background..................................................................................................................1
1.2 Methodology................................................................................................................ 1
2.0 Scope definition................................................................................................................... 1
2.1 Scope........................................................................................................................... 1
2.1.1 Functional unit....................................................................................................2
2.2.2 System boundaries...............................................................................................2
3.0 Process of Life Cycle Analysis..............................................................................................2
3.1 Assumptions.................................................................................................................3
3.2 Data collection.............................................................................................................. 3
4. 0 Results............................................................................................................................... 4
5.0 Discussion........................................................................................................................... 6
5.1 Environmental indicators contribution and comparison......................................................6
5.2 Influencing factors of indicators......................................................................................6
5.2.1 Scenario 1 and Scenario 3....................................................................................7
5.2.2 Scenario 2.......................................................................................................... 7
5.2.3 Scenario 4.......................................................................................................... 7
5.3 Reflection and uncertainty.......................................................................................7
6.0 Conclusion.......................................................................................................................... 8
7.0 Reference............................................................................................................................ 9
Appendix................................................................................................................................ 10
⊘ This is a preview!⊘
Do you want full access?
Subscribe today to unlock all pages.
Trusted by 1+ million students worldwide
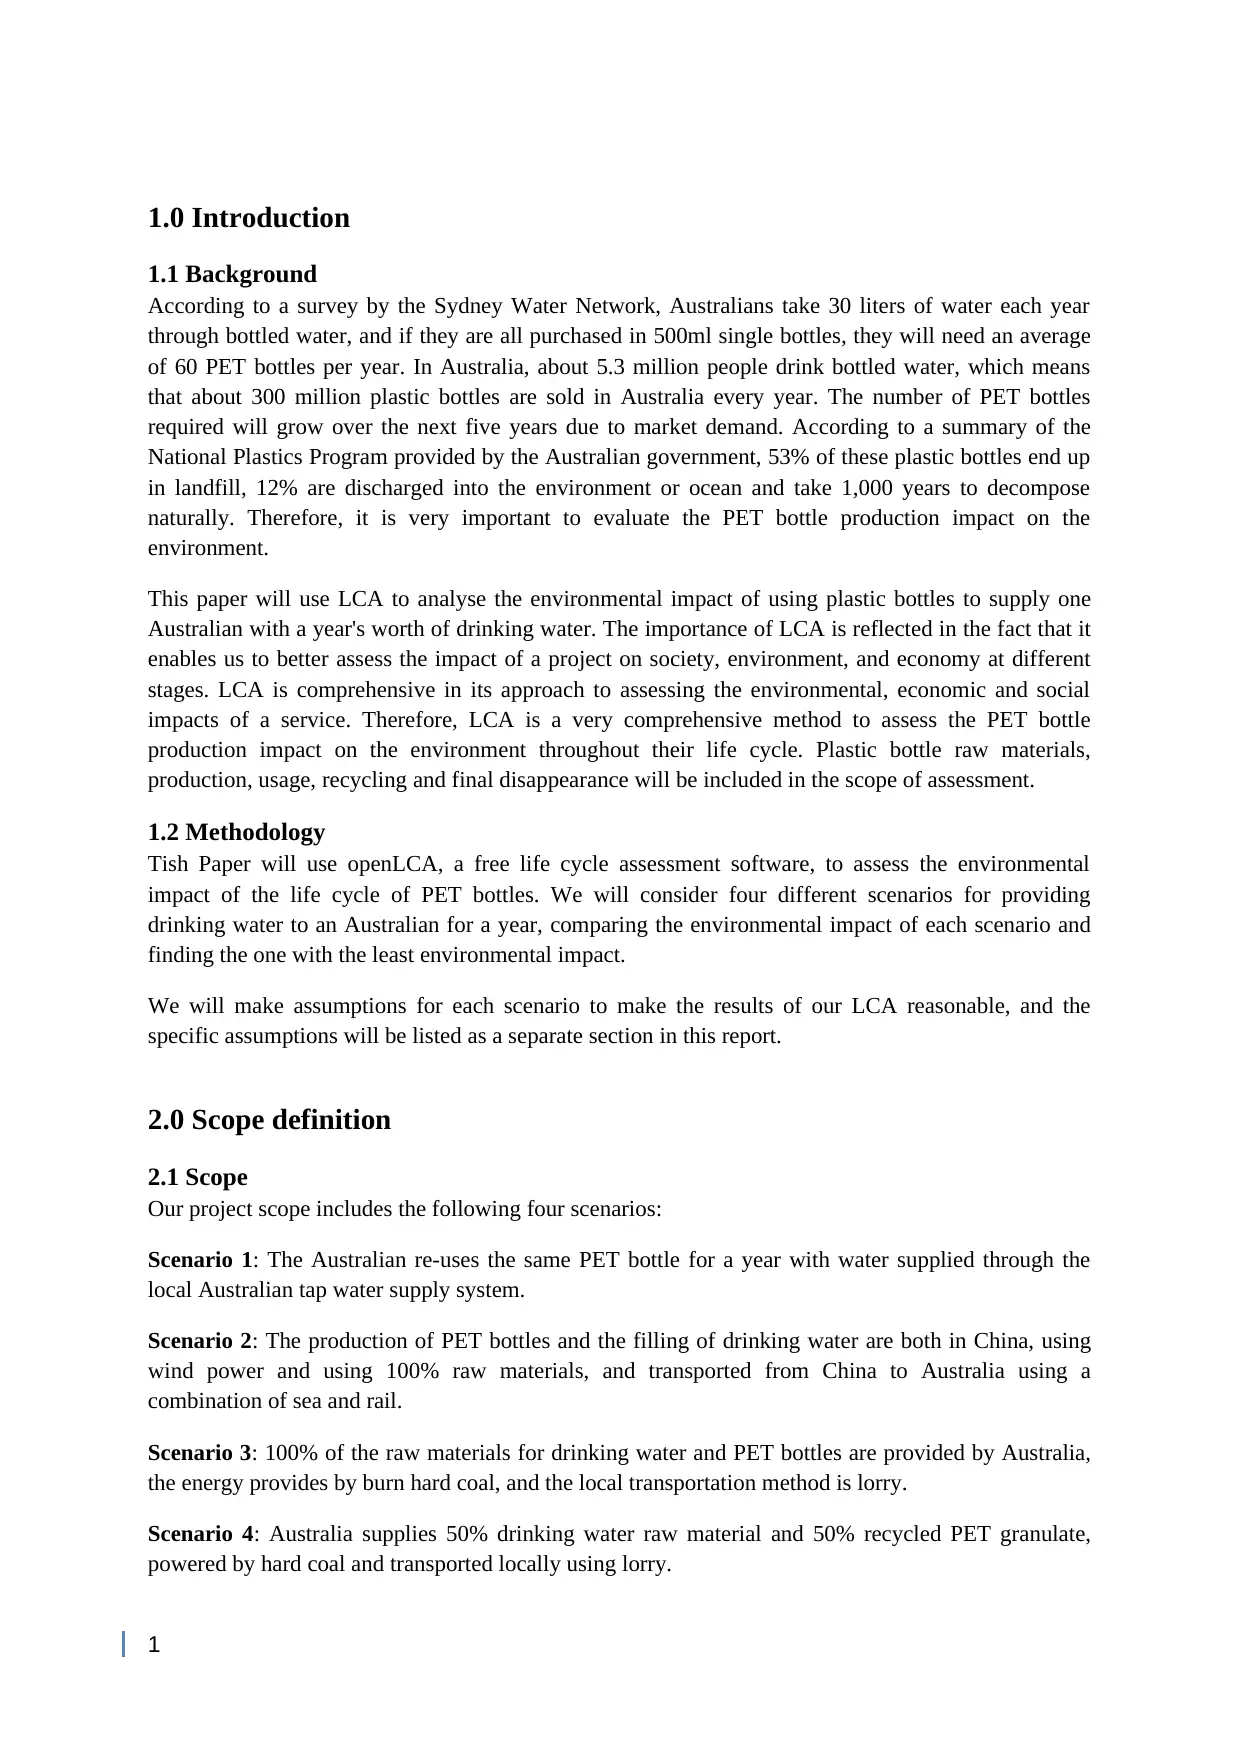
1.0 Introduction
1.1 Background
According to a survey by the Sydney Water Network, Australians take 30 liters of water each year
through bottled water, and if they are all purchased in 500ml single bottles, they will need an average
of 60 PET bottles per year. In Australia, about 5.3 million people drink bottled water, which means
that about 300 million plastic bottles are sold in Australia every year. The number of PET bottles
required will grow over the next five years due to market demand. According to a summary of the
National Plastics Program provided by the Australian government, 53% of these plastic bottles end up
in landfill, 12% are discharged into the environment or ocean and take 1,000 years to decompose
naturally. Therefore, it is very important to evaluate the PET bottle production impact on the
environment.
This paper will use LCA to analyse the environmental impact of using plastic bottles to supply one
Australian with a year's worth of drinking water. The importance of LCA is reflected in the fact that it
enables us to better assess the impact of a project on society, environment, and economy at different
stages. LCA is comprehensive in its approach to assessing the environmental, economic and social
impacts of a service. Therefore, LCA is a very comprehensive method to assess the PET bottle
production impact on the environment throughout their life cycle. Plastic bottle raw materials,
production, usage, recycling and final disappearance will be included in the scope of assessment.
1.2 Methodology
Tish Paper will use openLCA, a free life cycle assessment software, to assess the environmental
impact of the life cycle of PET bottles. We will consider four different scenarios for providing
drinking water to an Australian for a year, comparing the environmental impact of each scenario and
finding the one with the least environmental impact.
We will make assumptions for each scenario to make the results of our LCA reasonable, and the
specific assumptions will be listed as a separate section in this report.
2.0 Scope definition
2.1 Scope
Our project scope includes the following four scenarios:
Scenario 1: The Australian re-uses the same PET bottle for a year with water supplied through the
local Australian tap water supply system.
Scenario 2: The production of PET bottles and the filling of drinking water are both in China, using
wind power and using 100% raw materials, and transported from China to Australia using a
combination of sea and rail.
Scenario 3: 100% of the raw materials for drinking water and PET bottles are provided by Australia,
the energy provides by burn hard coal, and the local transportation method is lorry.
Scenario 4: Australia supplies 50% drinking water raw material and 50% recycled PET granulate,
powered by hard coal and transported locally using lorry.
1
Paraphrase This Document
Need a fresh take? Get an instant paraphrase of this document with our AI Paraphraser
The analysis in this report will include the following categories: climate change (GWP100), terrestrial
acidification (TAP100), ozone layer depletion (ODP100), human toxicity (HTPinf), eutrophication
(FEP100).
In each scenario, we tune parameters for country regions, energy types and transportation methods to
improve the rationality of our tasks.
2.1.1 Functional unit
We need to determine the appropriate Functional unit to objectively compare the methods of providing
drinking water for an Australian for a year. In OpenLCA, the material quantity, weight and energy
consumption will be represented by Functional unit. In scenario 1, according to our measurements, a
PET bottle needs 0.009kg of polyethylene terephthalate granulate and 0.009kg of polypropylene
granulate, and 0.5kg of water is needed to fill a bottle. In this scenario we use hard coal to generate
electricity to produce PET bottles. According to the research report of the Pacific Research Institute, it
takes 2MJ of energy to produce a PET bottle. We use the same assumptions for PET bottle parameters
and energy consumption in the next three scenarios and assume that a person needs to drink two liters
of water per day. It means that four bottles of water are needed every day, and 1460 bottles of water
are consumed in a year. In the selection of drinking water, we choose softened water as the input
parameter, because there are literatures to support that softened water can be drunk.
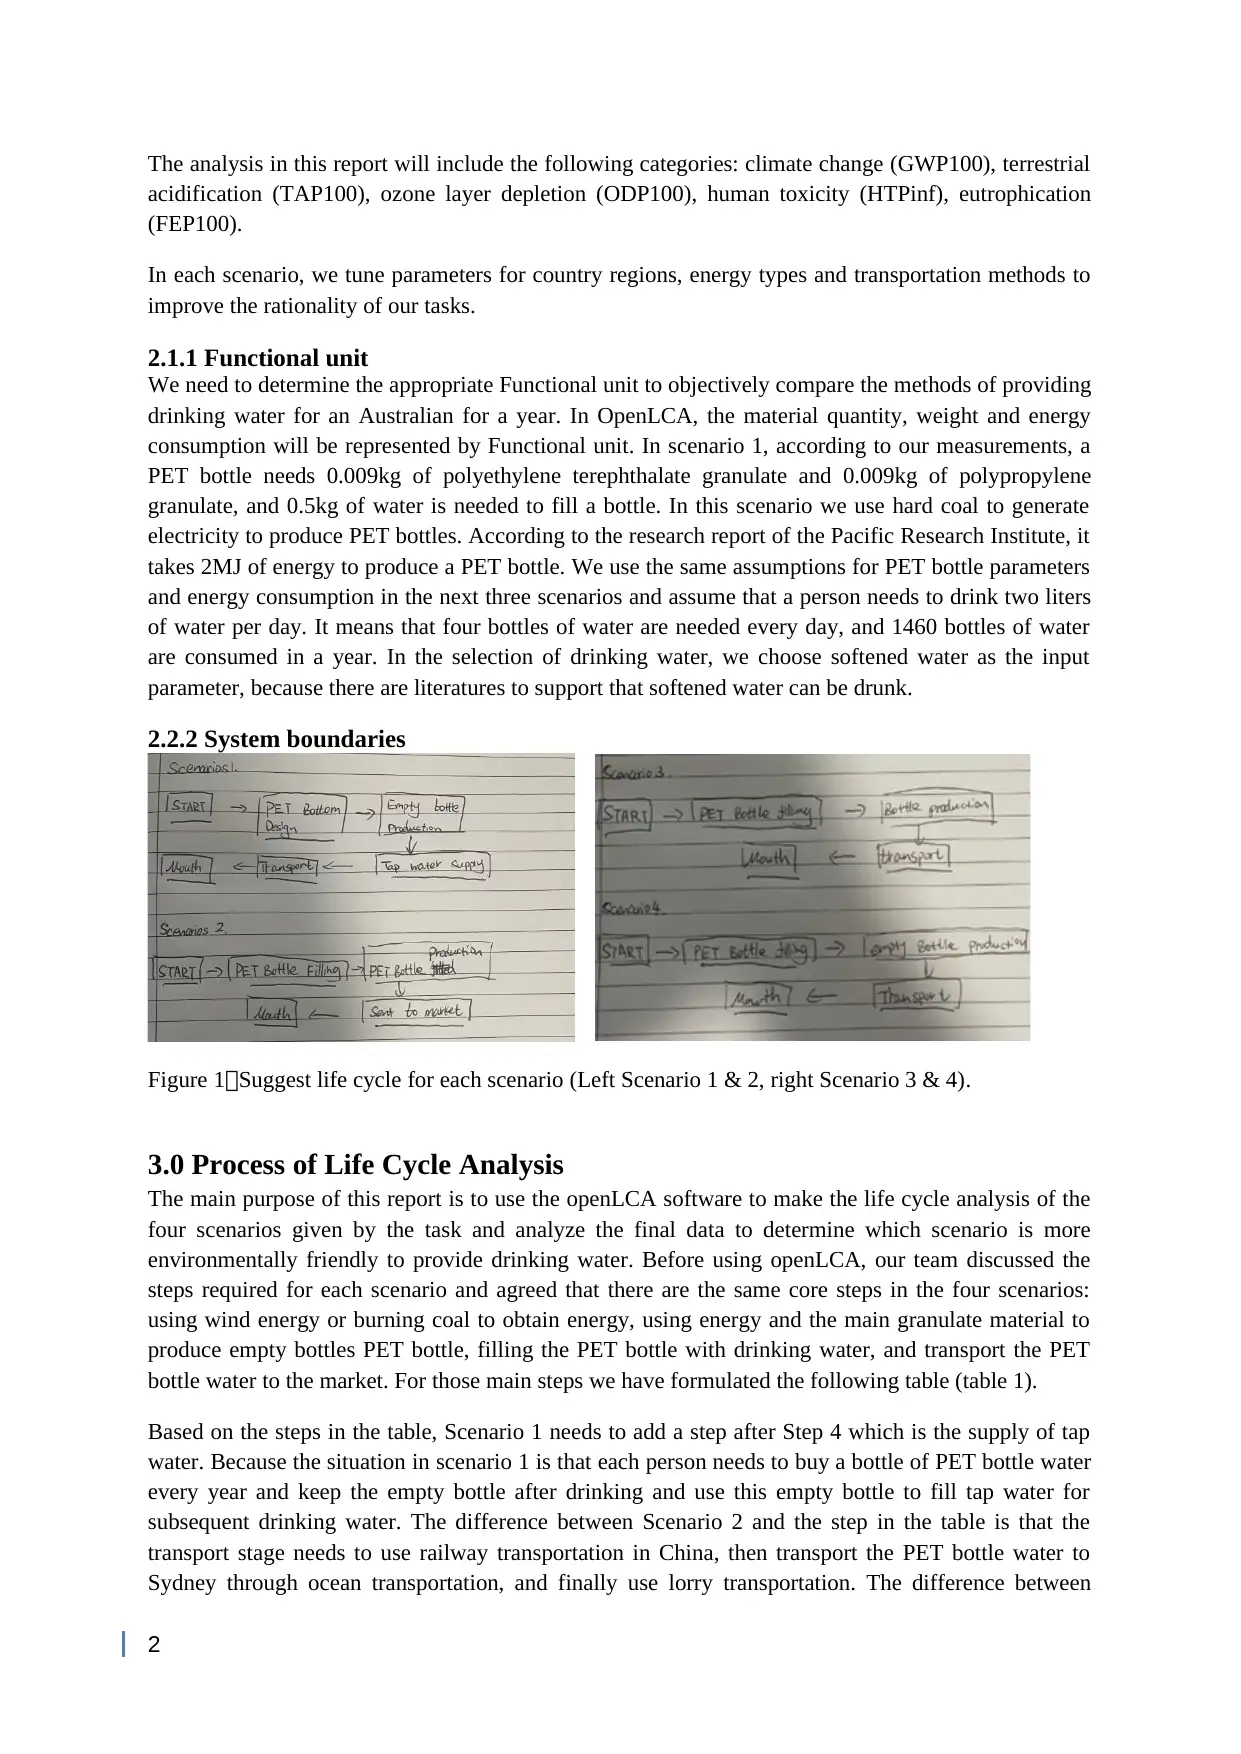
2.2.2 System boundaries
Figure 1:Suggest life cycle for each scenario (Left Scenario 1 & 2, right Scenario 3 & 4).
3.0 Process of Life Cycle Analysis
The main purpose of this report is to use the openLCA software to make the life cycle analysis of the
four scenarios given by the task and analyze the final data to determine which scenario is more
environmentally friendly to provide drinking water. Before using openLCA, our team discussed the
steps required for each scenario and agreed that there are the same core steps in the four scenarios:
using wind energy or burning coal to obtain energy, using energy and the main granulate material to
produce empty bottles PET bottle, filling the PET bottle with drinking water, and transport the PET
bottle water to the market. For those main steps we have formulated the following table (table 1).
Based on the steps in the table, Scenario 1 needs to add a step after Step 4 which is the supply of tap
water. Because the situation in scenario 1 is that each person needs to buy a bottle of PET bottle water
every year and keep the empty bottle after drinking and use this empty bottle to fill tap water for
subsequent drinking water. The difference between Scenario 2 and the step in the table is that the
transport stage needs to use railway transportation in China, then transport the PET bottle water to
Sydney through ocean transportation, and finally use lorry transportation. The difference between
2
acidification (TAP100), ozone layer depletion (ODP100), human toxicity (HTPinf), eutrophication
(FEP100).
In each scenario, we tune parameters for country regions, energy types and transportation methods to
improve the rationality of our tasks.
2.1.1 Functional unit
We need to determine the appropriate Functional unit to objectively compare the methods of providing
drinking water for an Australian for a year. In OpenLCA, the material quantity, weight and energy
consumption will be represented by Functional unit. In scenario 1, according to our measurements, a
PET bottle needs 0.009kg of polyethylene terephthalate granulate and 0.009kg of polypropylene
granulate, and 0.5kg of water is needed to fill a bottle. In this scenario we use hard coal to generate
electricity to produce PET bottles. According to the research report of the Pacific Research Institute, it
takes 2MJ of energy to produce a PET bottle. We use the same assumptions for PET bottle parameters
and energy consumption in the next three scenarios and assume that a person needs to drink two liters
of water per day. It means that four bottles of water are needed every day, and 1460 bottles of water
are consumed in a year. In the selection of drinking water, we choose softened water as the input
parameter, because there are literatures to support that softened water can be drunk.
2.2.2 System boundaries
Figure 1:Suggest life cycle for each scenario (Left Scenario 1 & 2, right Scenario 3 & 4).
3.0 Process of Life Cycle Analysis
The main purpose of this report is to use the openLCA software to make the life cycle analysis of the
four scenarios given by the task and analyze the final data to determine which scenario is more
environmentally friendly to provide drinking water. Before using openLCA, our team discussed the
steps required for each scenario and agreed that there are the same core steps in the four scenarios:
using wind energy or burning coal to obtain energy, using energy and the main granulate material to
produce empty bottles PET bottle, filling the PET bottle with drinking water, and transport the PET
bottle water to the market. For those main steps we have formulated the following table (table 1).
Based on the steps in the table, Scenario 1 needs to add a step after Step 4 which is the supply of tap
water. Because the situation in scenario 1 is that each person needs to buy a bottle of PET bottle water
every year and keep the empty bottle after drinking and use this empty bottle to fill tap water for
subsequent drinking water. The difference between Scenario 2 and the step in the table is that the
transport stage needs to use railway transportation in China, then transport the PET bottle water to
Sydney through ocean transportation, and finally use lorry transportation. The difference between
2
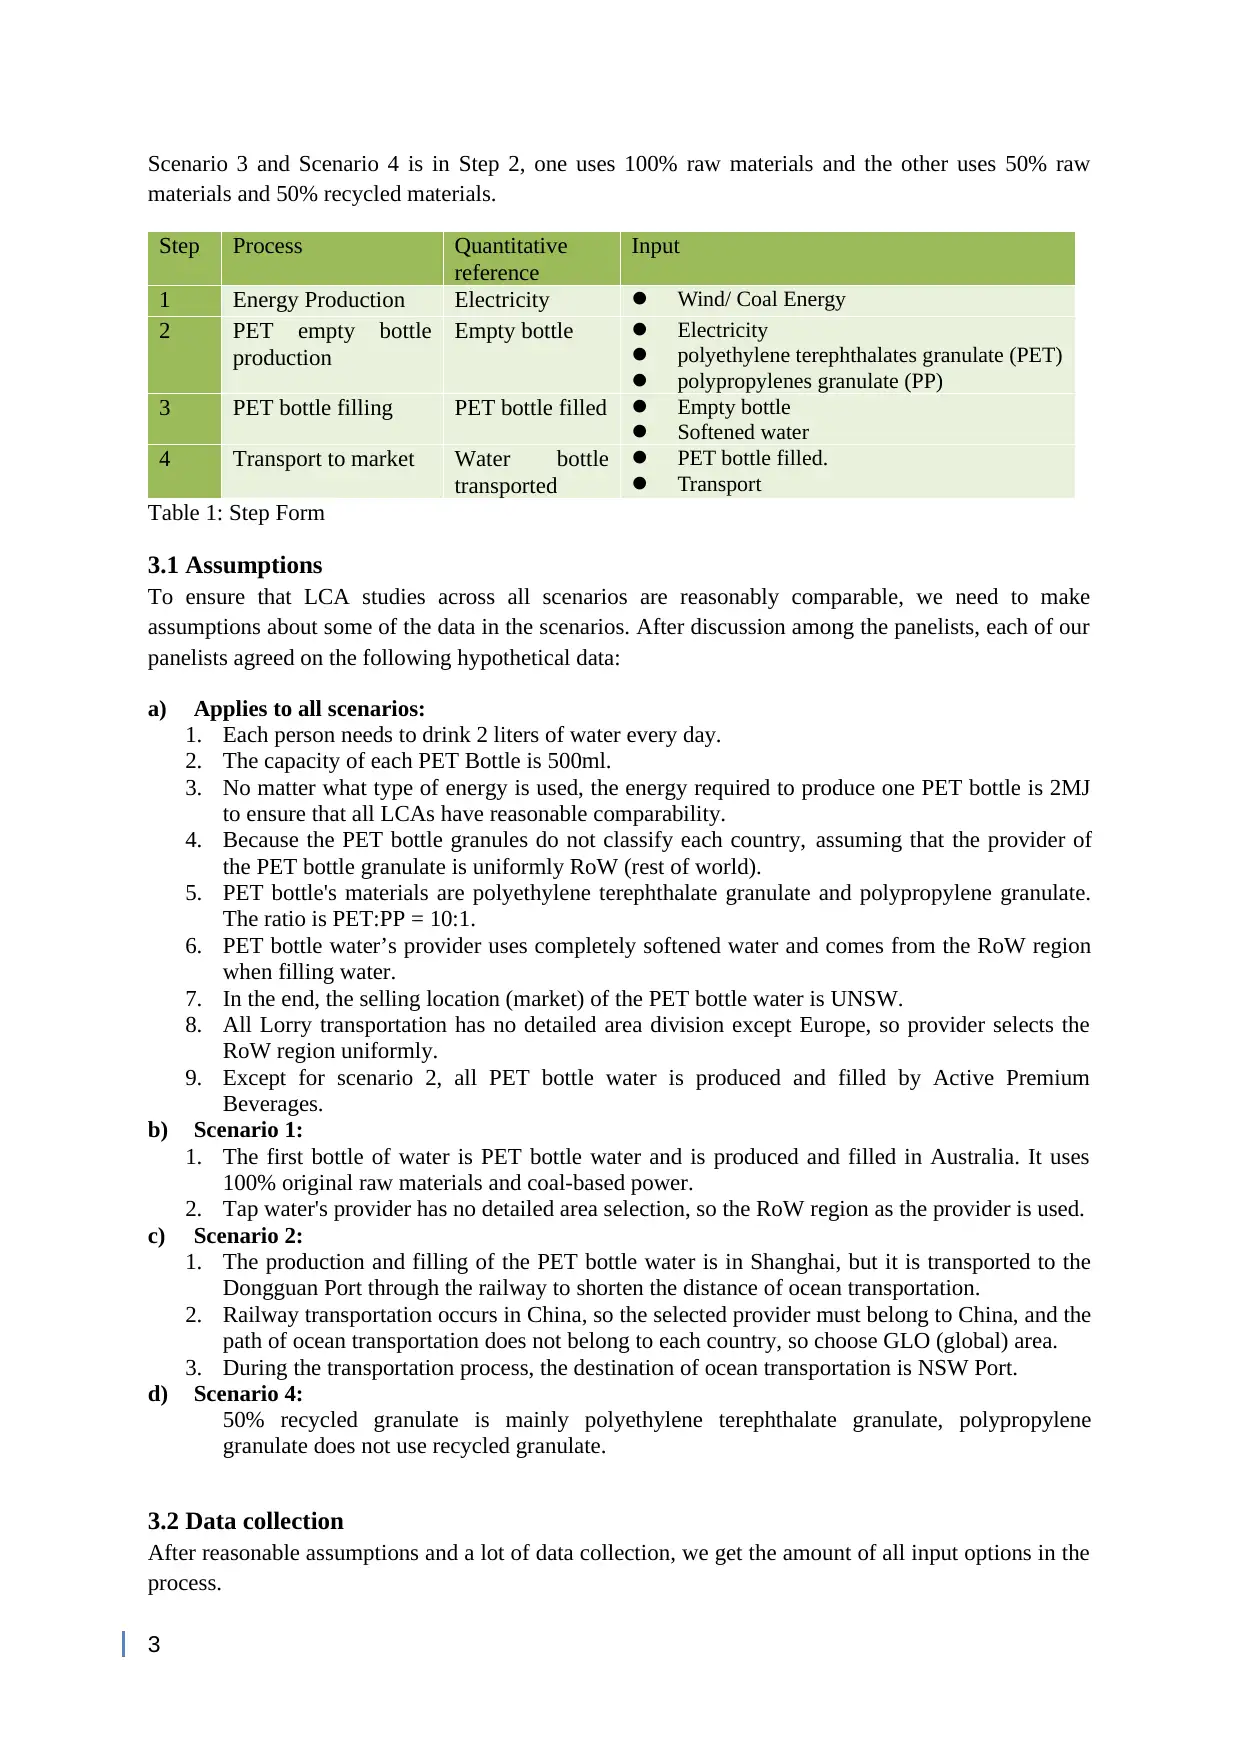
Scenario 3 and Scenario 4 is in Step 2, one uses 100% raw materials and the other uses 50% raw
materials and 50% recycled materials.
Step Process Quantitative
reference
Input
1 Energy Production Electricity Wind/ Coal Energy
2 PET empty bottle
production
Empty bottle Electricity
polyethylene terephthalates granulate (PET)
polypropylenes granulate (PP)
3 PET bottle filling PET bottle filled Empty bottle
Softened water
4 Transport to market Water bottle
transported
PET bottle filled.
Transport
Table 1: Step Form
3.1 Assumptions
To ensure that LCA studies across all scenarios are reasonably comparable, we need to make
assumptions about some of the data in the scenarios. After discussion among the panelists, each of our
panelists agreed on the following hypothetical data:
a) Applies to all scenarios:
1. Each person needs to drink 2 liters of water every day.
2. The capacity of each PET Bottle is 500ml.
3. No matter what type of energy is used, the energy required to produce one PET bottle is 2MJ
to ensure that all LCAs have reasonable comparability.
4. Because the PET bottle granules do not classify each country, assuming that the provider of
the PET bottle granulate is uniformly RoW (rest of world).
5. PET bottle's materials are polyethylene terephthalate granulate and polypropylene granulate.
The ratio is PET:PP = 10:1.
6. PET bottle water’s provider uses completely softened water and comes from the RoW region
when filling water.
7. In the end, the selling location (market) of the PET bottle water is UNSW.
8. All Lorry transportation has no detailed area division except Europe, so provider selects the
RoW region uniformly.
9. Except for scenario 2, all PET bottle water is produced and filled by Active Premium
Beverages.
b) Scenario 1:
1. The first bottle of water is PET bottle water and is produced and filled in Australia. It uses
100% original raw materials and coal-based power.
2. Tap water's provider has no detailed area selection, so the RoW region as the provider is used.
c) Scenario 2:
1. The production and filling of the PET bottle water is in Shanghai, but it is transported to the
Dongguan Port through the railway to shorten the distance of ocean transportation.
2. Railway transportation occurs in China, so the selected provider must belong to China, and the
path of ocean transportation does not belong to each country, so choose GLO (global) area.
3. During the transportation process, the destination of ocean transportation is NSW Port.
d) Scenario 4:
50% recycled granulate is mainly polyethylene terephthalate granulate, polypropylene
granulate does not use recycled granulate.
3.2 Data collection
After reasonable assumptions and a lot of data collection, we get the amount of all input options in the
process.
3
⊘ This is a preview!⊘
Do you want full access?
Subscribe today to unlock all pages.
Trusted by 1+ million students worldwide
According to the research, due to the advancement of technology, the weight of an empty PET
bottle is only 9.9g in recent years. The main materials of PET bottles are pet granulate and pp
granulate, and the ratio is 10:1. Therefore, the input amount of the constituent materials of an
empty bottle is 0.009kg of pet granulate and 0.0009kg of pp granulate.
According to the assumed data, it can be known that there is 500ml of water in a bottle of PET
bottle water, so the total weight of a bottle of PET bottle water is 0.5099kg.
Except for Scenario 2, PET bottle water for other scenarios is produced from Active Premium
Beverages and shipped to the UNSW market. Among them, according to Google map, the
transportation distance can be obtained as 32km.
Scenario 2, the first transportation distance is from the PET bottle water production plant in
Shanghai to Dongguan port, and the distance is about 1843km through Google map. Then
through research, it can be found that the ocean route from Dongguan Port to Sydney is 5226
nautical miles, and 1 nautical mile is equal to 1.852 kilometers. Therefore, according to the
calculation, it can be obtained that the distance of Scenario 2 on ocean transportation is about
9678km. Finally, the lorry transport used from NSW Port to UNSW needs to travel 7.2km.
Each person needs to drink 2 liters of water per day, and a bottle of PET bottle water contains
500ml of water, so the amount of bottle water each person drinks per year is 4*365=1460. In
input, pet granulate amount, pp granulate amount, empty bottle amount, softened water amount,
PET bottle filled amount and transport amount must be multiplied by 1460, except scenario 1.
In Scenario 1, because only one bottle of PET bottle water needs to be purchased, it is only
necessary to multiply the tap water amount by (1460-1) in the supply of tap water process.
4. 0 Results
After having reasonable hypotheses and complete data, our team members unanimously decided to
proceed with the LCA study through discussion. According to the research of the group, we found that
there is a complete "Energy production" step in the provided openLCA document, so we use the
process provided by the openLCA document for the first "Energy production" step of each scenario in
the task, and the difference lies in scenario 1,3,4 use coal energy, scenario 2 uses wind energy.
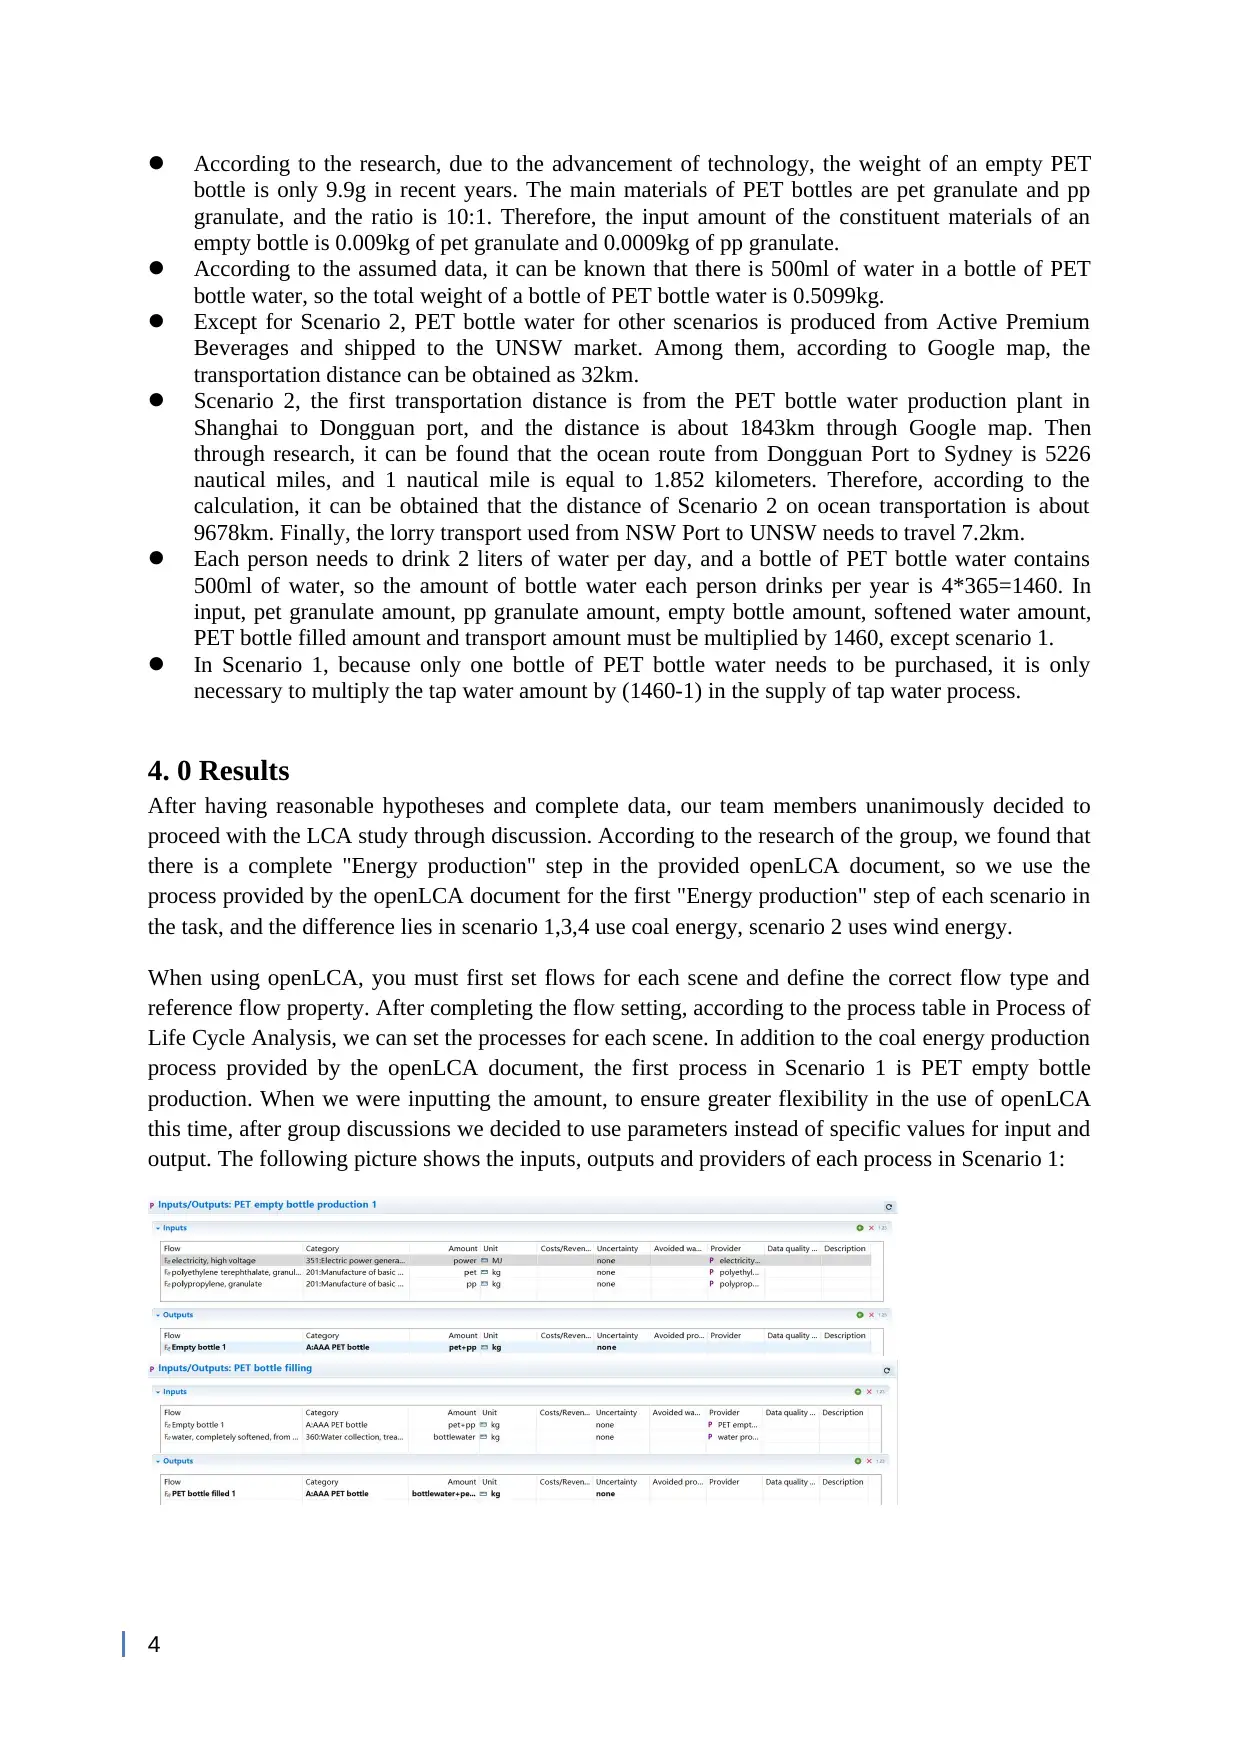
When using openLCA, you must first set flows for each scene and define the correct flow type and
reference flow property. After completing the flow setting, according to the process table in Process of
Life Cycle Analysis, we can set the processes for each scene. In addition to the coal energy production
process provided by the openLCA document, the first process in Scenario 1 is PET empty bottle
production. When we were inputting the amount, to ensure greater flexibility in the use of openLCA
this time, after group discussions we decided to use parameters instead of specific values for input and
output. The following picture shows the inputs, outputs and providers of each process in Scenario 1:
4
bottle is only 9.9g in recent years. The main materials of PET bottles are pet granulate and pp
granulate, and the ratio is 10:1. Therefore, the input amount of the constituent materials of an
empty bottle is 0.009kg of pet granulate and 0.0009kg of pp granulate.
According to the assumed data, it can be known that there is 500ml of water in a bottle of PET
bottle water, so the total weight of a bottle of PET bottle water is 0.5099kg.
Except for Scenario 2, PET bottle water for other scenarios is produced from Active Premium
Beverages and shipped to the UNSW market. Among them, according to Google map, the
transportation distance can be obtained as 32km.
Scenario 2, the first transportation distance is from the PET bottle water production plant in
Shanghai to Dongguan port, and the distance is about 1843km through Google map. Then
through research, it can be found that the ocean route from Dongguan Port to Sydney is 5226
nautical miles, and 1 nautical mile is equal to 1.852 kilometers. Therefore, according to the
calculation, it can be obtained that the distance of Scenario 2 on ocean transportation is about
9678km. Finally, the lorry transport used from NSW Port to UNSW needs to travel 7.2km.
Each person needs to drink 2 liters of water per day, and a bottle of PET bottle water contains
500ml of water, so the amount of bottle water each person drinks per year is 4*365=1460. In
input, pet granulate amount, pp granulate amount, empty bottle amount, softened water amount,
PET bottle filled amount and transport amount must be multiplied by 1460, except scenario 1.
In Scenario 1, because only one bottle of PET bottle water needs to be purchased, it is only
necessary to multiply the tap water amount by (1460-1) in the supply of tap water process.
4. 0 Results
After having reasonable hypotheses and complete data, our team members unanimously decided to
proceed with the LCA study through discussion. According to the research of the group, we found that
there is a complete "Energy production" step in the provided openLCA document, so we use the
process provided by the openLCA document for the first "Energy production" step of each scenario in
the task, and the difference lies in scenario 1,3,4 use coal energy, scenario 2 uses wind energy.
When using openLCA, you must first set flows for each scene and define the correct flow type and
reference flow property. After completing the flow setting, according to the process table in Process of
Life Cycle Analysis, we can set the processes for each scene. In addition to the coal energy production
process provided by the openLCA document, the first process in Scenario 1 is PET empty bottle
production. When we were inputting the amount, to ensure greater flexibility in the use of openLCA
this time, after group discussions we decided to use parameters instead of specific values for input and
output. The following picture shows the inputs, outputs and providers of each process in Scenario 1:
4
Paraphrase This Document
Need a fresh take? Get an instant paraphrase of this document with our AI Paraphraser
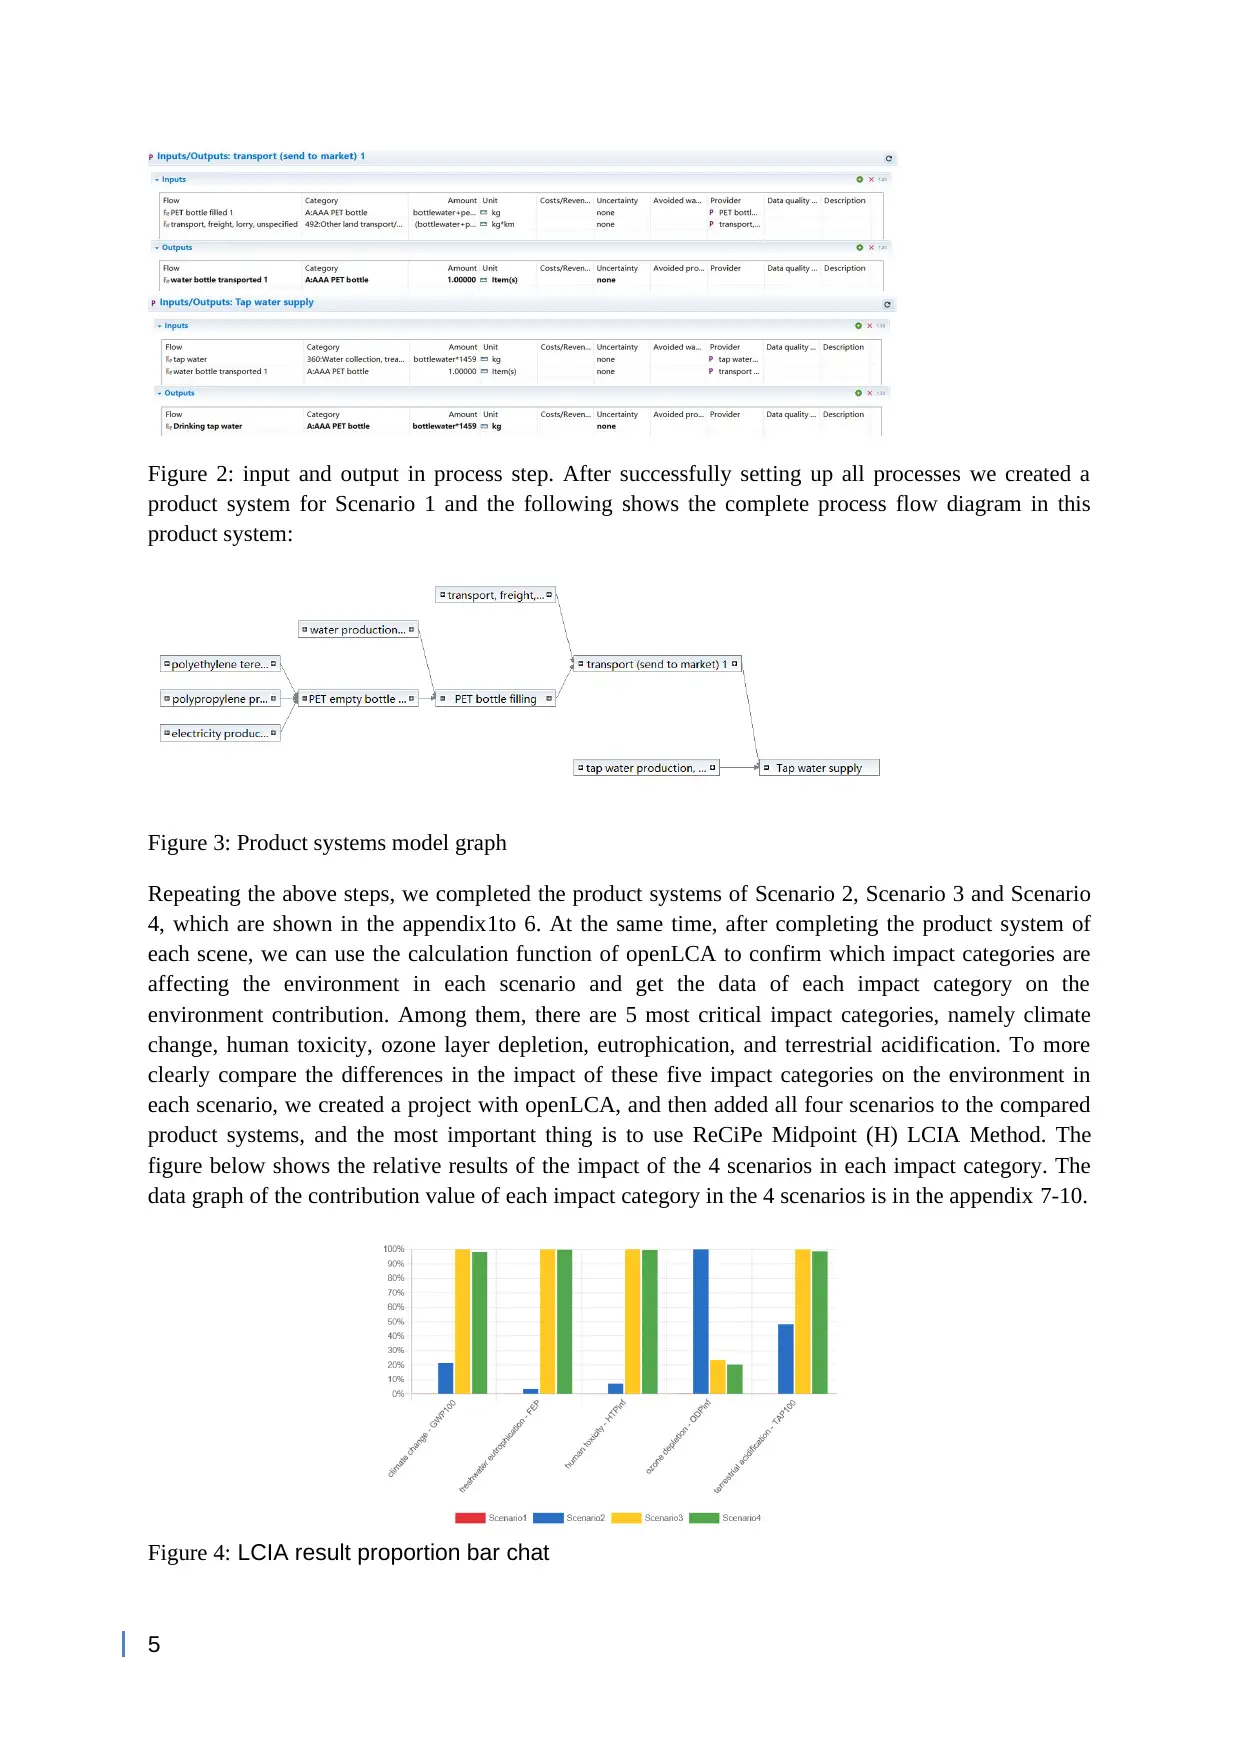
Figure 2: input and output in process step. After successfully setting up all processes we created a
product system for Scenario 1 and the following shows the complete process flow diagram in this
product system:
Figure 3: Product systems model graph
Repeating the above steps, we completed the product systems of Scenario 2, Scenario 3 and Scenario
4, which are shown in the appendix1to 6. At the same time, after completing the product system of
each scene, we can use the calculation function of openLCA to confirm which impact categories are
affecting the environment in each scenario and get the data of each impact category on the
environment contribution. Among them, there are 5 most critical impact categories, namely climate
change, human toxicity, ozone layer depletion, eutrophication, and terrestrial acidification. To more
clearly compare the differences in the impact of these five impact categories on the environment in
each scenario, we created a project with openLCA, and then added all four scenarios to the compared
product systems, and the most important thing is to use ReCiPe Midpoint (H) LCIA Method. The
figure below shows the relative results of the impact of the 4 scenarios in each impact category. The
data graph of the contribution value of each impact category in the 4 scenarios is in the appendix 7-10.
Figure 4: LCIA result proportion bar chat
5
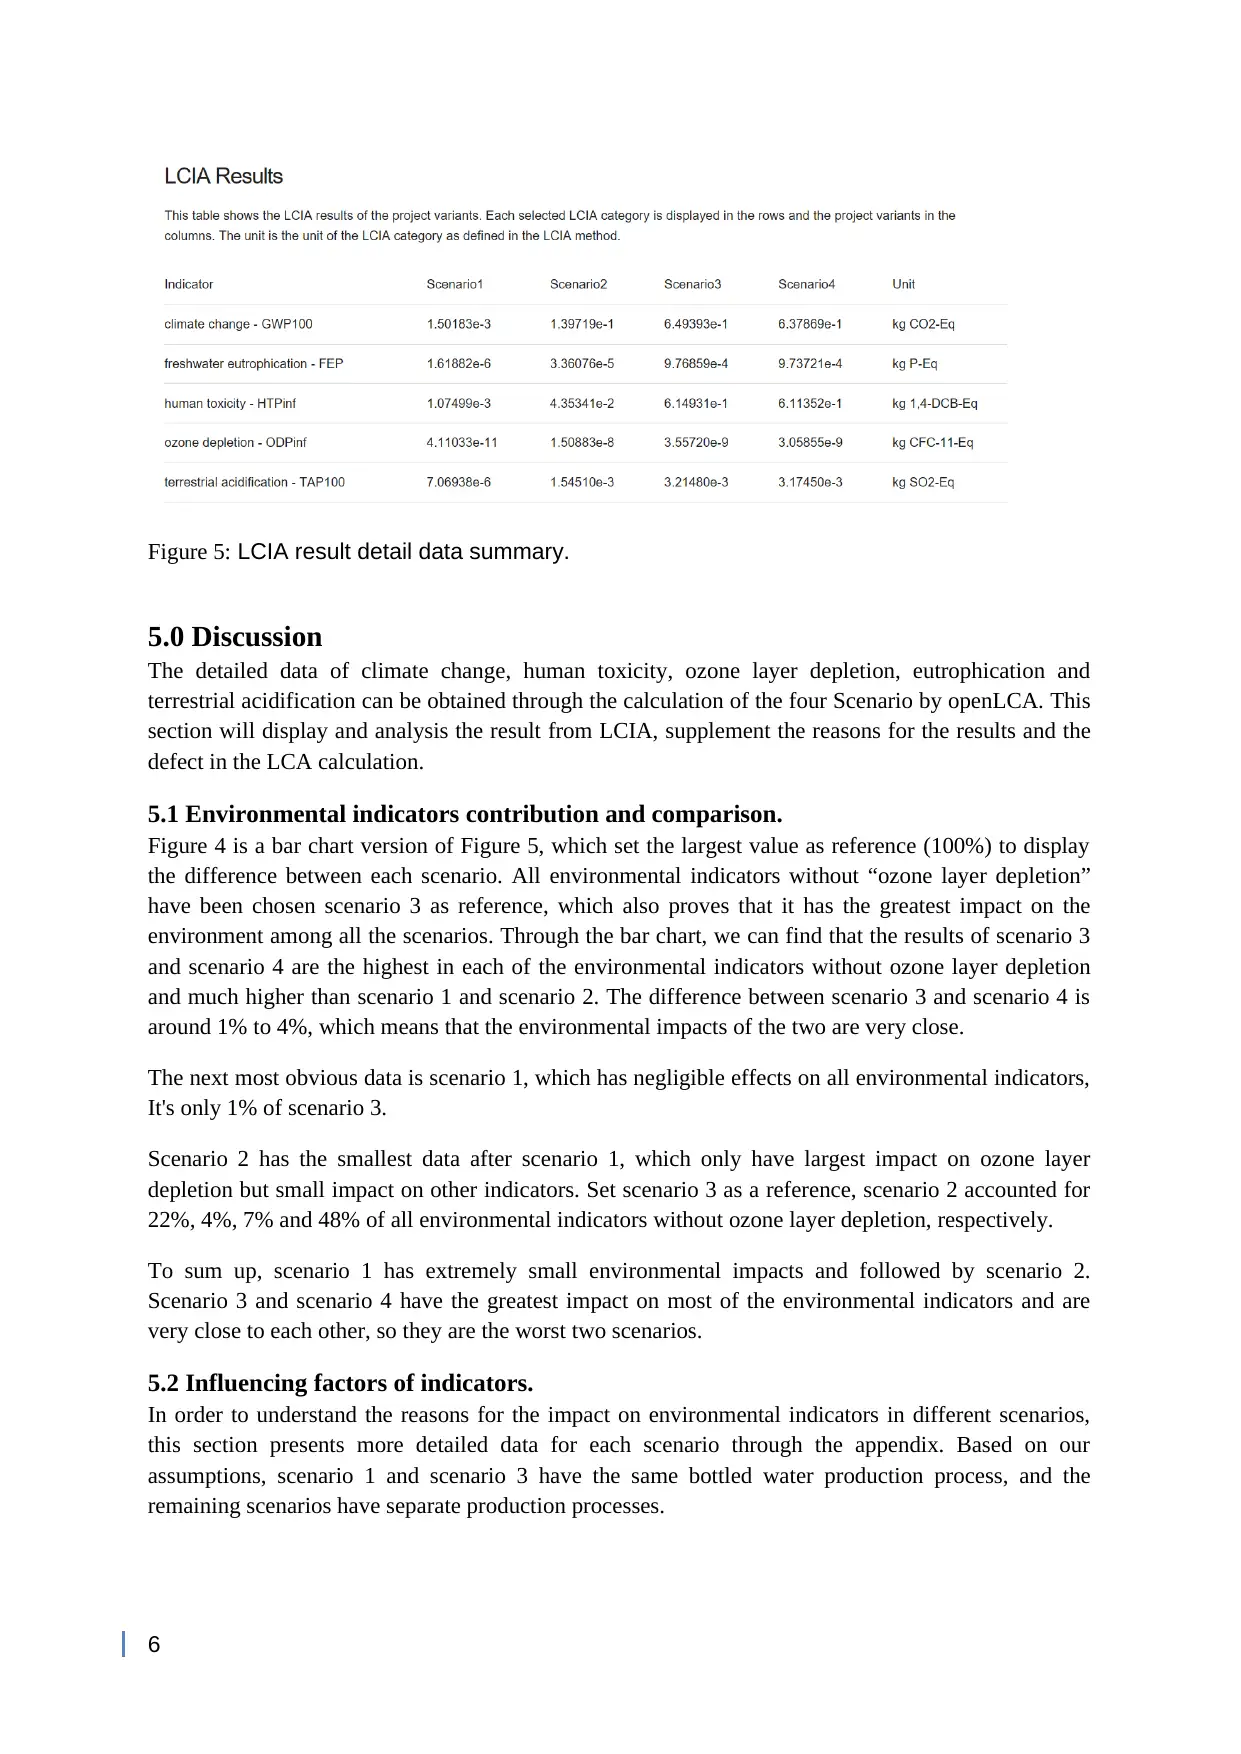
Figure 5: LCIA result detail data summary.
5.0 Discussion
The detailed data of climate change, human toxicity, ozone layer depletion, eutrophication and
terrestrial acidification can be obtained through the calculation of the four Scenario by openLCA. This
section will display and analysis the result from LCIA, supplement the reasons for the results and the
defect in the LCA calculation.
5.1 Environmental indicators contribution and comparison.
Figure 4 is a bar chart version of Figure 5, which set the largest value as reference (100%) to display
the difference between each scenario. All environmental indicators without “ozone layer depletion”
have been chosen scenario 3 as reference, which also proves that it has the greatest impact on the
environment among all the scenarios. Through the bar chart, we can find that the results of scenario 3
and scenario 4 are the highest in each of the environmental indicators without ozone layer depletion
and much higher than scenario 1 and scenario 2. The difference between scenario 3 and scenario 4 is
around 1% to 4%, which means that the environmental impacts of the two are very close.
The next most obvious data is scenario 1, which has negligible effects on all environmental indicators,
It's only 1% of scenario 3.
Scenario 2 has the smallest data after scenario 1, which only have largest impact on ozone layer
depletion but small impact on other indicators. Set scenario 3 as a reference, scenario 2 accounted for
22%, 4%, 7% and 48% of all environmental indicators without ozone layer depletion, respectively.
To sum up, scenario 1 has extremely small environmental impacts and followed by scenario 2.
Scenario 3 and scenario 4 have the greatest impact on most of the environmental indicators and are
very close to each other, so they are the worst two scenarios.
5.2 Influencing factors of indicators.
In order to understand the reasons for the impact on environmental indicators in different scenarios,
this section presents more detailed data for each scenario through the appendix. Based on our
assumptions, scenario 1 and scenario 3 have the same bottled water production process, and the
remaining scenarios have separate production processes.
6
⊘ This is a preview!⊘
Do you want full access?
Subscribe today to unlock all pages.
Trusted by 1+ million students worldwide
5.2.1 Scenario 1 and Scenario 3
The difference between scenario 1 and scenario 3 is that one produces 1 bottle of water a year and
another one produces 1460 bottles of water a year. Considering the particularity of scenario 1, this
section will analysis the data from Appendix 12 as reference, and this is better to compare with
Scenario 4 due to both have similar production process.
From Appendix 12, we can find that among the four environmental indicators which is climate
change, freshwater eutrophication, human toxicity, and terrestrial acidification. The “electricity
production hard coal” produce a huge and exaggerated impact, accounting for about 90% of the total
impact. This directly explains their huge impact on each environmental indicators without ozone layer
depletion shown in figures 5 and 4.
Another particular table comes from the “ozone layer depletion”. Although "other" is the largest
weight, but it is the sum of many small processes and therefore not worth discussing. So, we should
note that the top three factors that have impact on the environment which is “petroleum and gas
production”, “petroleum production” and “electricity production hard coal”. The weight of these three
factors very close that it can be assumed that electricity production from hard coal generation has the
similar effect on the ozone layer as petroleum production.
5.2.2 Scenario 2
The most significant impacts of Scenario 2 on the environment come from the petroleum industry and
transportation processes, and the two are linked. Only scenario 2 requires shipping products from
China to Australia, a process that requires a large amount of petroleum products. From Appendix 13, it
can be found that scenario 2 has a far greater impact on the ozone layer than other scenarios and all the
factors are related to petroleum production, so it is the main reason of the impact on the ozone layer.
Scenarios 3 and 4 have relatively little impact on the ozone layer as they are locally produced and
transported in Australia, which around 20% and 24% of scenario 2. Moreover, for “terrestrial
acidification”, the top 3 most influential factors in scenario 2 are related to transportation and fuel.
Therefore, it can be explained that although coal is not used for electricity generation in scenario 2, the
impact of transportation and fuel on “terrestrial acidification” is still significant, accounting for about
48% of scenario 3.
The influence of scenario 2 on other environmental indicators is small, almost less than one tenth of
that of scenario 3. Meanwhile, it can be seen from Appendix 13 that the influence of all factors on the
environment is relatively average, which is due to the fact that the bottled water production process is
based on wind electricity generation, and this is also the main reason why scenario 2 is better than
other scenarios.
5.2.3 Scenario 4
Based on Appendix 14, the results for scenario 4 and scenario 3 were close, with a difference around
1% to 4%. The only difference between both is that half of the materials produced in scenario 4 are
recyclable. However, this does not avoid the use of coal for electricity generation, so the impact on the
environment is still large. This proves that the use of recyclable materials has limited benefits for the
five environmental indicators targeted in this report.
5.3 Reflection and uncertainty
This report has many defects and question worth reflecting on, and the most serious errors occur in the
design of scenario 4 production process. We only changed the production materials but did not change
the energy cost in water bottle production, which we used the same energy cost as scenario 3. This
results in almost no difference in environmental damage between scenario 3 and scenario 4, even
7
Paraphrase This Document
Need a fresh take? Get an instant paraphrase of this document with our AI Paraphraser
though scenario 3 uses 50% recycled materials. In another scenario simulation report using LCA
analysis, the performance of environmental indicators Global Warming Potential, Abiotic Resource
Depletion, Terrestrial Acidification, Water Scarcity, Ozone Depletion Potential and Freshwater
Ecotoxicity in the production scenario of recyclable materials is better than that of raw materials
(Gileno & Turci, 2021, sec. 1), and the experiment adopts two different recycling method which is
bottle to bottle (B2B) and bottle to fiber (B2F). The above experimental results fully prove that the
recycled material production energy cost should be much lower than raw material. A more
comprehensive view of the environmental impact of water bottles should provide more details of the
power consumption process, which should vary from stage to stage of production.
It can be concluded from the results of this report that electricity production and the production of
petroleum have the most serious environmental impacts. So, improving the structure of electricity
production or using clean energy can reduce environmental damage. Balance the shape and volume of
bottled water to improve transportation efficiency is also worth advocating.
6.0 Conclusion
This section will give corresponding conclusions based on our group discussions. Compared with
Scenario 1, Scenarios 2, 3, and 4 all purchase PET bottom to provide drinking water, while Scenario 1
uses tap water for water supply. We can clearly see that compared with the other three scenarios, the
impact of scenario 1 on the environment is negligible, so it can be concluded that scenario 1 has the
least impact on the environment. Compared with Scenarios 2, 3, and 4, the biggest advantage of
Scenario 2 is the use of wind power. Scenario 2 uses sea transportation to cause a greater impact on
the ozone layer, but we believe that compared with Scenarios 3 and 4, Scenario 2 has little impact on
other indicators, so Scenario 2 has the second largest impact on the environment. From this we can see
that coal power generation has a great impact on the environment, Petroleum use is the most damaging
to the ozone layer. Compared with Scenario 3 and 4, the impact on the environment is not much
different, but Scenario 4 uses recyclable materials, so we believe that Scenario 3 has the greatest
impact on the environment.
8
7.0 Reference
1. Gileno, L. A., & Turci, L. F. R. (2021). Life cycle assessment for PET-bottle recycling in Brazil:
B2B and B2F routes. Cleaner Environmental Systems, 3, 100057.
https://doi.org/10.1016/j.cesys.2021.100057
2. National Plastics Plan summary - DCCEEW. (n.d.). Australian government , Department of
Agriculture, Water and the Environment 2021,
https://www.dcceew.gov.au/environment/protection/waste/publications/national-plastics-plan-
summary (Australian government, 2021)
3. Gleick, P. H., & Cooley, H. (2009). Energy implications of bottled water. Environmental
Research Letters, 4(1), 014009. https://doi.org/10.1088/1748-9326/4/1/014009 (Gleick & Cooley,
2009, sec ?)
4. Million Plastic Bottles Per Minute – Scary Plastic Statistics. (n.d.). 2019
https://www.drinklavit.com/blog/plastic-isnt-green#:~:text=A%20typical%20one%2Dliter
%20plastic,creates%20three%20tons%20of%20CO2. (LAVIT, 2019)
5. Admin, C. A. (2022, June 16). Bottled Water - Cool Australia. Cool Australia.
https://www.coolaustralia.org/bottled-water-secondary/ (coolaustralia.org, 2023)
6. M. (2019, October 28). How to Make Softened Water Drinkable. Clear Water Concepts.
https://clearwaterarizona.com/blog/how-to-make-softened-water-drinkable/#:~:text=You%20can
%20drink%20softened%20water,rid%20of%20the%20sodium%20levels. (Clear water contepts,
2023)
7. Port of Sydney , Australia to Port of Guangzhou (Canton), China sea route and distance. (n.d.-b).
Ports.com. http://ports.com/sea-route/port-of-sydney,australia/port-of-guangzhou-canton,china/
(Ports.com, 2023)
8. Drinking Water | Active Premium Beverages | Old Guildford. (n.d.). Activepremium.
http://www.activepremium.com.au/ (Active Premium Beverages Pty Ltd, 2023)
9
⊘ This is a preview!⊘
Do you want full access?
Subscribe today to unlock all pages.
Trusted by 1+ million students worldwide
1 out of 20
Related Documents


Your All-in-One AI-Powered Toolkit for Academic Success.
+13062052269
info@desklib.com
Available 24*7 on WhatsApp / Email
![[object Object]](/_next/static/media/star-bottom.7253800d.svg)
Unlock your academic potential
Copyright © 2020–2026 A2Z Services. All Rights Reserved. Developed and managed by ZUCOL.