Data Analysis Report for Business Performance
VerifiedAdded on 2020/02/12
|21
|3757
|45
Report
AI Summary
This report analyzes business performance through data analysis using Weka and Excel. It covers profit and loss identification, product profitability, shipping methods, and competitive advantages gained through data analytics. The report concludes with recommendations for improving business operations based on the findings.

DHBI
Paraphrase This Document
Need a fresh take? Get an instant paraphrase of this document with our AI Paraphraser

TABLE OF CONTENTS
INTRODUCTION...........................................................................................................................3
TASK 1............................................................................................................................................3
Identification of whether firm is in profit or in loss....................................................................3
Finding out most profitable and loss making products for the business firms............................4
Average time taken to ship the product.......................................................................................4
Areas from which most of orders are returned............................................................................5
High, medium and low discount on the products........................................................................5
Shipping method mostly used and expensive..............................................................................6
Graph of sales, profit and units....................................................................................................8
Month in which more amount is generated from sales................................................................9
Check to see whether it cost more when order have a higher priority (low, medium, high,
critical) if yes then what would be your suggestion to office Company to reduce these costs. 10
TASK 2..........................................................................................................................................10
Use of Weka to gain competitive advantage and way in which it can be used to gain
competitive advantage...............................................................................................................10
Merits and dermis of Weka in comparison to excel..................................................................12
Application of J48 algorithm on data set in Weka....................................................................13
CONCLUSION..............................................................................................................................19
REFERENCES..............................................................................................................................21
INTRODUCTION
Analytics is one growing field in the current time period. There are number of software’s
that are used in the current time period by the business firms to analyze data. Excel is the one of
the software that is widely used to analyze the data as there are number of advanced functions in
the same. On the basis of results business decisions are made by the managers. In the current
time period data related to the business firm is analyzed using excel and Weka software. On the
basis of analysis of data lots of facts are identified and on that basis recommendations are made.
At end of the report, conclusion is formed.
TASK 1
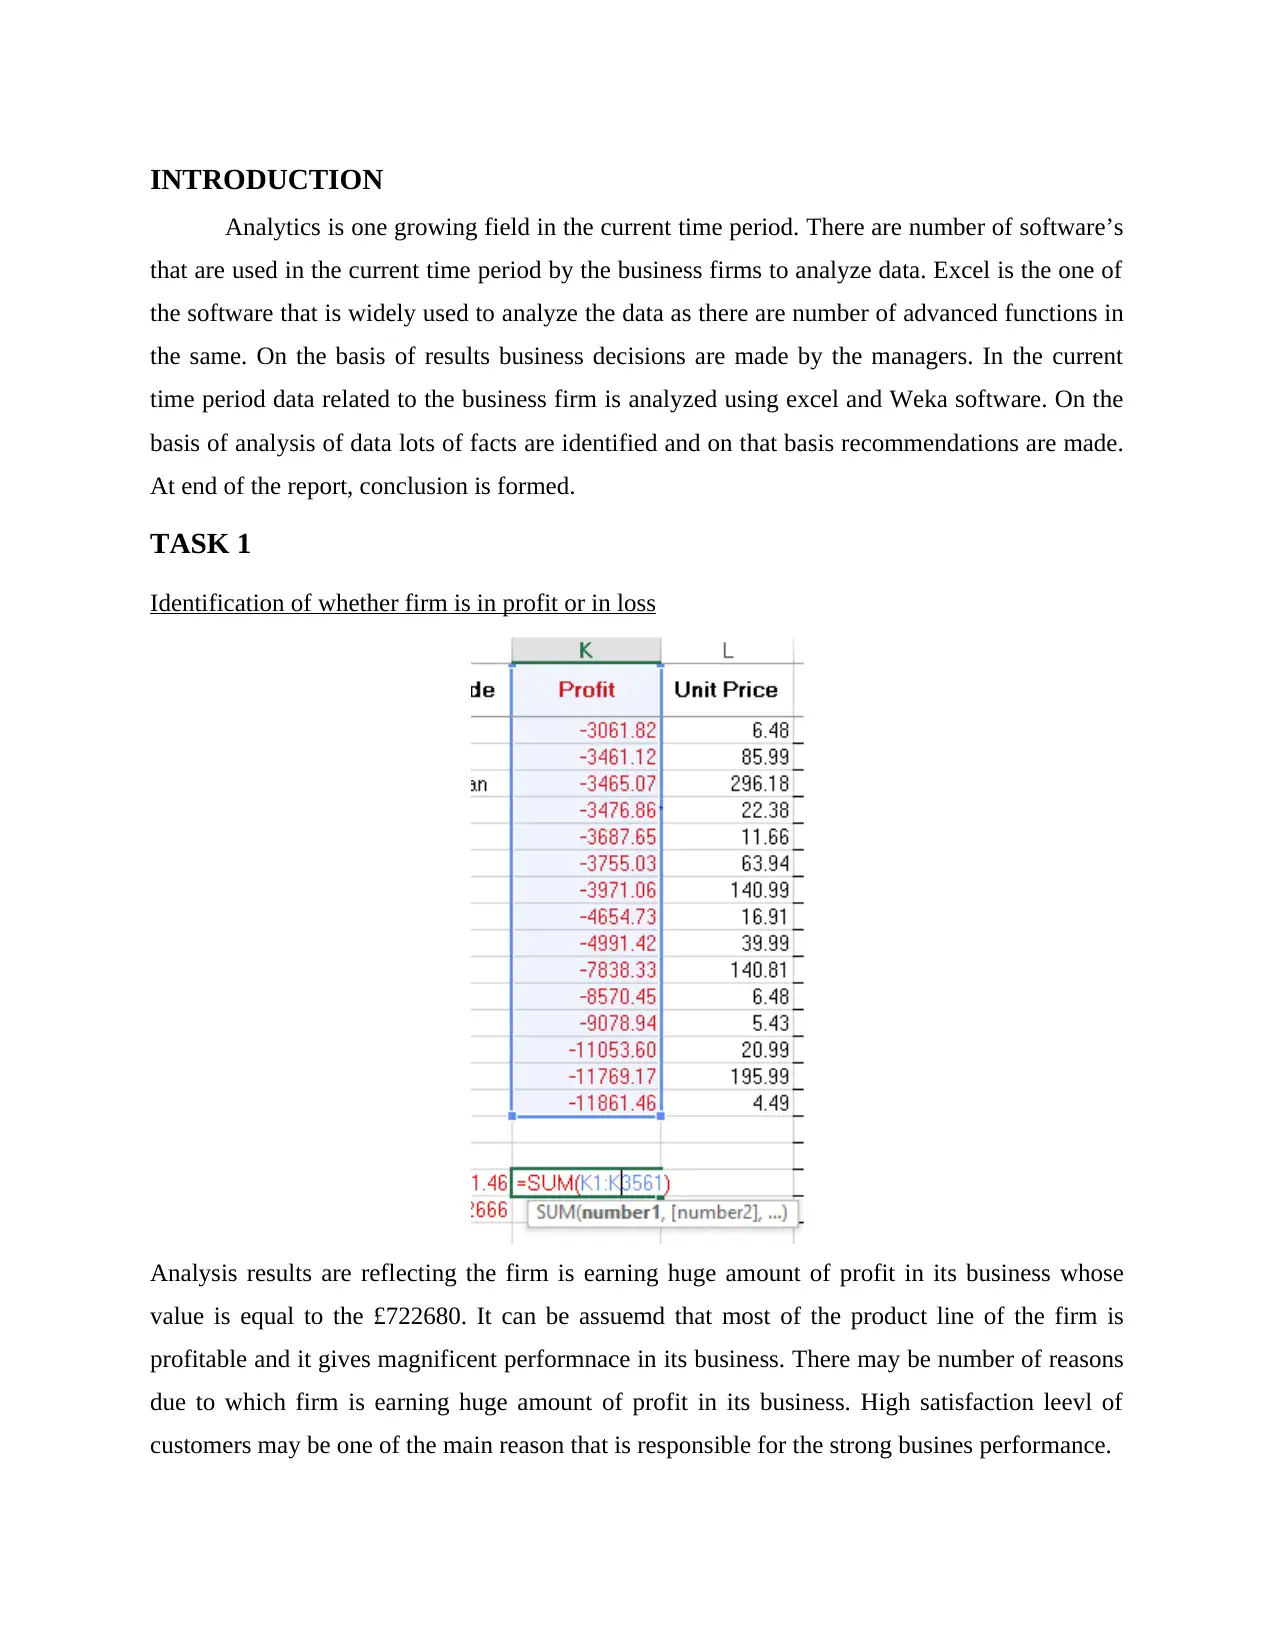
Identification of whether firm is in profit or in loss
Analysis results are reflecting the firm is earning huge amount of profit in its business whose
value is equal to the £722680. It can be assuemd that most of the product line of the firm is
profitable and it gives magnificent performnace in its business. There may be number of reasons
due to which firm is earning huge amount of profit in its business. High satisfaction leevl of
customers may be one of the main reason that is responsible for the strong busines performance.
Analytics is one growing field in the current time period. There are number of software’s
that are used in the current time period by the business firms to analyze data. Excel is the one of
the software that is widely used to analyze the data as there are number of advanced functions in
the same. On the basis of results business decisions are made by the managers. In the current
time period data related to the business firm is analyzed using excel and Weka software. On the
basis of analysis of data lots of facts are identified and on that basis recommendations are made.
At end of the report, conclusion is formed.
TASK 1
Identification of whether firm is in profit or in loss
Analysis results are reflecting the firm is earning huge amount of profit in its business whose
value is equal to the £722680. It can be assuemd that most of the product line of the firm is
profitable and it gives magnificent performnace in its business. There may be number of reasons
due to which firm is earning huge amount of profit in its business. High satisfaction leevl of
customers may be one of the main reason that is responsible for the strong busines performance.
⊘ This is a preview!⊘
Do you want full access?
Subscribe today to unlock all pages.
Trusted by 1+ million students worldwide
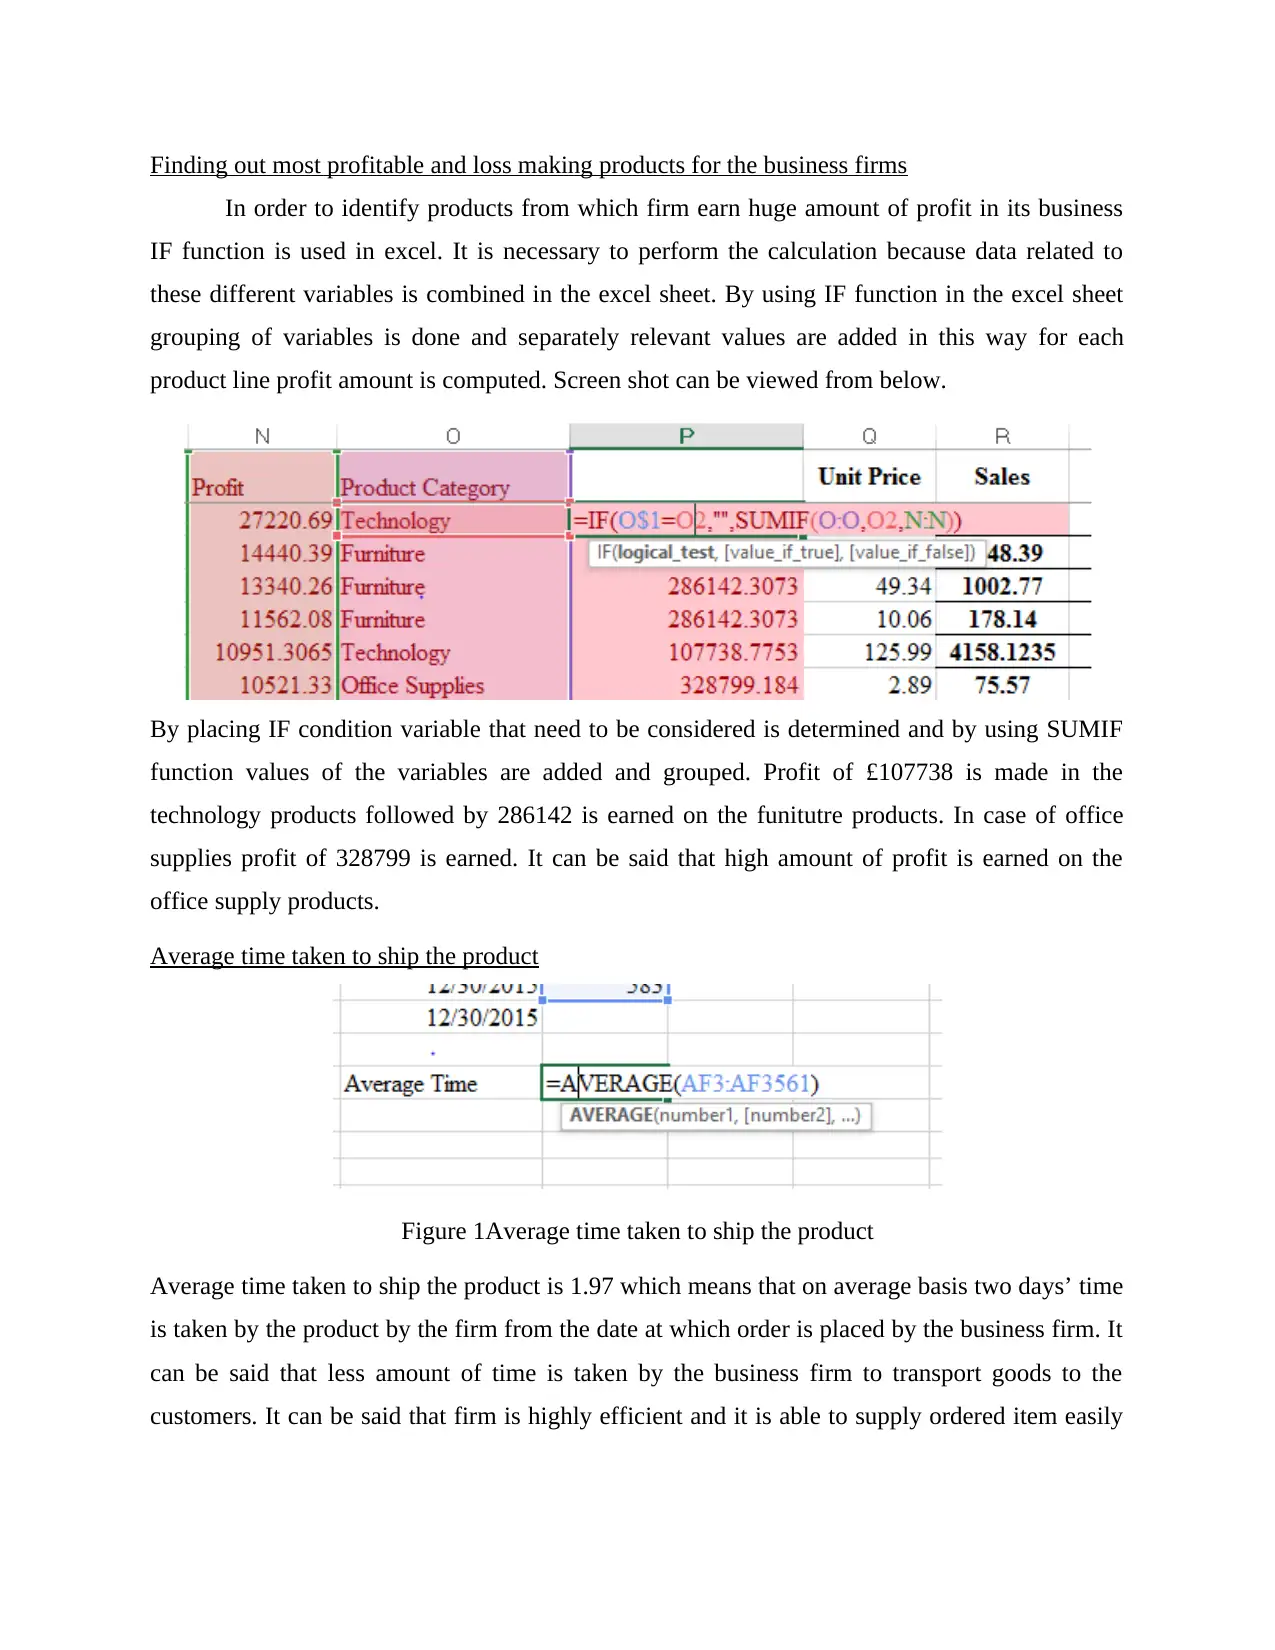
Finding out most profitable and loss making products for the business firms
In order to identify products from which firm earn huge amount of profit in its business
IF function is used in excel. It is necessary to perform the calculation because data related to
these different variables is combined in the excel sheet. By using IF function in the excel sheet
grouping of variables is done and separately relevant values are added in this way for each
product line profit amount is computed. Screen shot can be viewed from below.
By placing IF condition variable that need to be considered is determined and by using SUMIF
function values of the variables are added and grouped. Profit of £107738 is made in the
technology products followed by 286142 is earned on the funitutre products. In case of office
supplies profit of 328799 is earned. It can be said that high amount of profit is earned on the
office supply products.
Average time taken to ship the product
Figure 1Average time taken to ship the product
Average time taken to ship the product is 1.97 which means that on average basis two days’ time
is taken by the product by the firm from the date at which order is placed by the business firm. It
can be said that less amount of time is taken by the business firm to transport goods to the
customers. It can be said that firm is highly efficient and it is able to supply ordered item easily
Paraphrase This Document
Need a fresh take? Get an instant paraphrase of this document with our AI Paraphraser
to the customers. It can be said that on average basis less amount of time is taken by the firm to
ship its product.
Areas from which most of orders are returned
It can be said on the basis of analysis of data that West Mid glamorgan is the geographic
area from which most of the products are returned by the customers. This happened because firm
failed to provide services to the customers up to the expected level. It can be said that it is very
important for the firm to improve level of its services quality because if same will not be done
then in that case firm may lose its customers in the business. Negative perception may be created
about the business firm among the customers. Thus, it can be said that this is the time when it
became important for the firm to focus on its business. It can be said that firm needs to improve
its performance and in this regard it need to take number of steps. There are some steps that can
be taken by the firm and in this regard number of steps can be taken to improve the business
performance and under this cost controls strategy must be formulated by the business firm. In
this regard, business operations can be analyzed or reviewed and activities that are wasteful or
lead to more time consumption can be identified and removed from the business operations and
by doing so cost can be reduced for the business firms. It can be said that by reducing cost sales
return can be reduced from the mentioned geographic area.
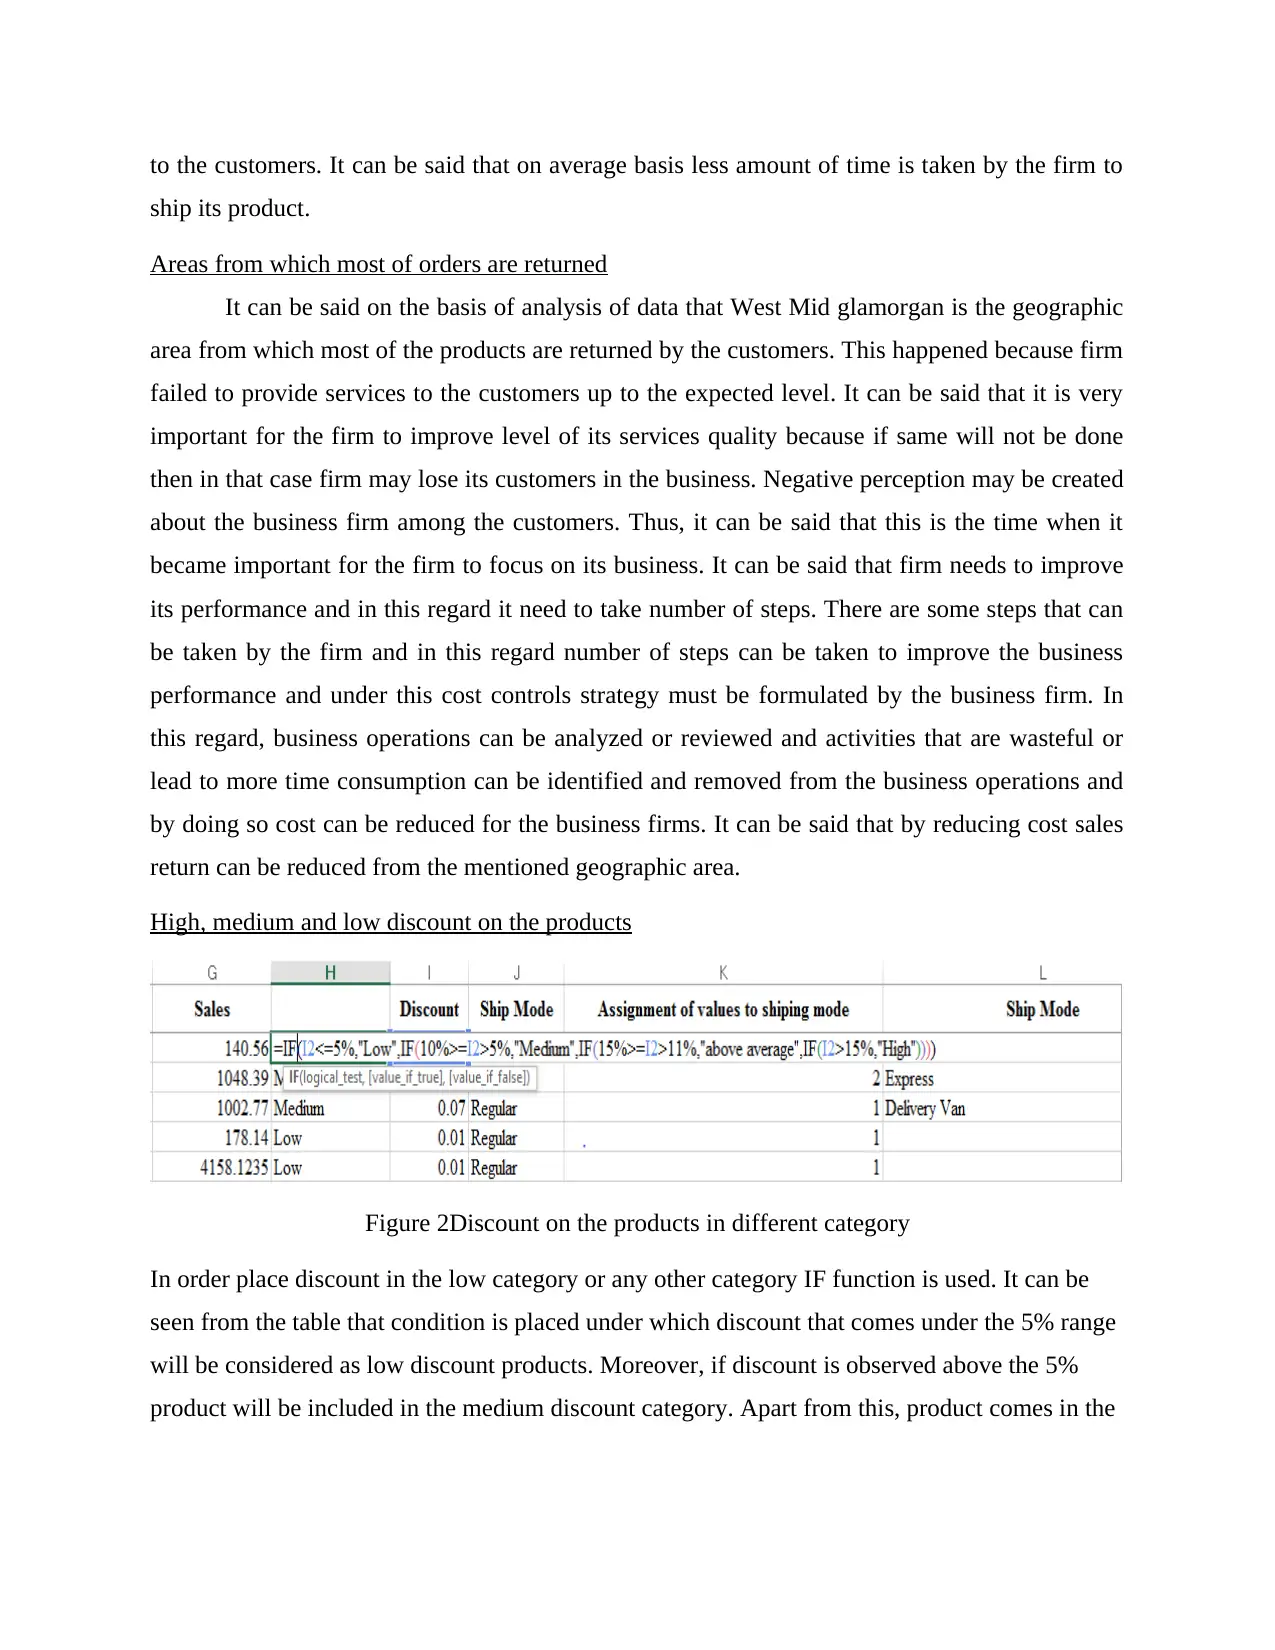
High, medium and low discount on the products
Figure 2Discount on the products in different category
In order place discount in the low category or any other category IF function is used. It can be
seen from the table that condition is placed under which discount that comes under the 5% range
will be considered as low discount products. Moreover, if discount is observed above the 5%
product will be included in the medium discount category. Apart from this, product comes in the
ship its product.
Areas from which most of orders are returned
It can be said on the basis of analysis of data that West Mid glamorgan is the geographic
area from which most of the products are returned by the customers. This happened because firm
failed to provide services to the customers up to the expected level. It can be said that it is very
important for the firm to improve level of its services quality because if same will not be done
then in that case firm may lose its customers in the business. Negative perception may be created
about the business firm among the customers. Thus, it can be said that this is the time when it
became important for the firm to focus on its business. It can be said that firm needs to improve
its performance and in this regard it need to take number of steps. There are some steps that can
be taken by the firm and in this regard number of steps can be taken to improve the business
performance and under this cost controls strategy must be formulated by the business firm. In
this regard, business operations can be analyzed or reviewed and activities that are wasteful or
lead to more time consumption can be identified and removed from the business operations and
by doing so cost can be reduced for the business firms. It can be said that by reducing cost sales
return can be reduced from the mentioned geographic area.
High, medium and low discount on the products
Figure 2Discount on the products in different category
In order place discount in the low category or any other category IF function is used. It can be
seen from the table that condition is placed under which discount that comes under the 5% range
will be considered as low discount products. Moreover, if discount is observed above the 5%
product will be included in the medium discount category. Apart from this, product comes in the
category of high discount when it is identified that discount on same is above 15%. By doing so
it is identified that which product comes in the low, medium and high discount category.
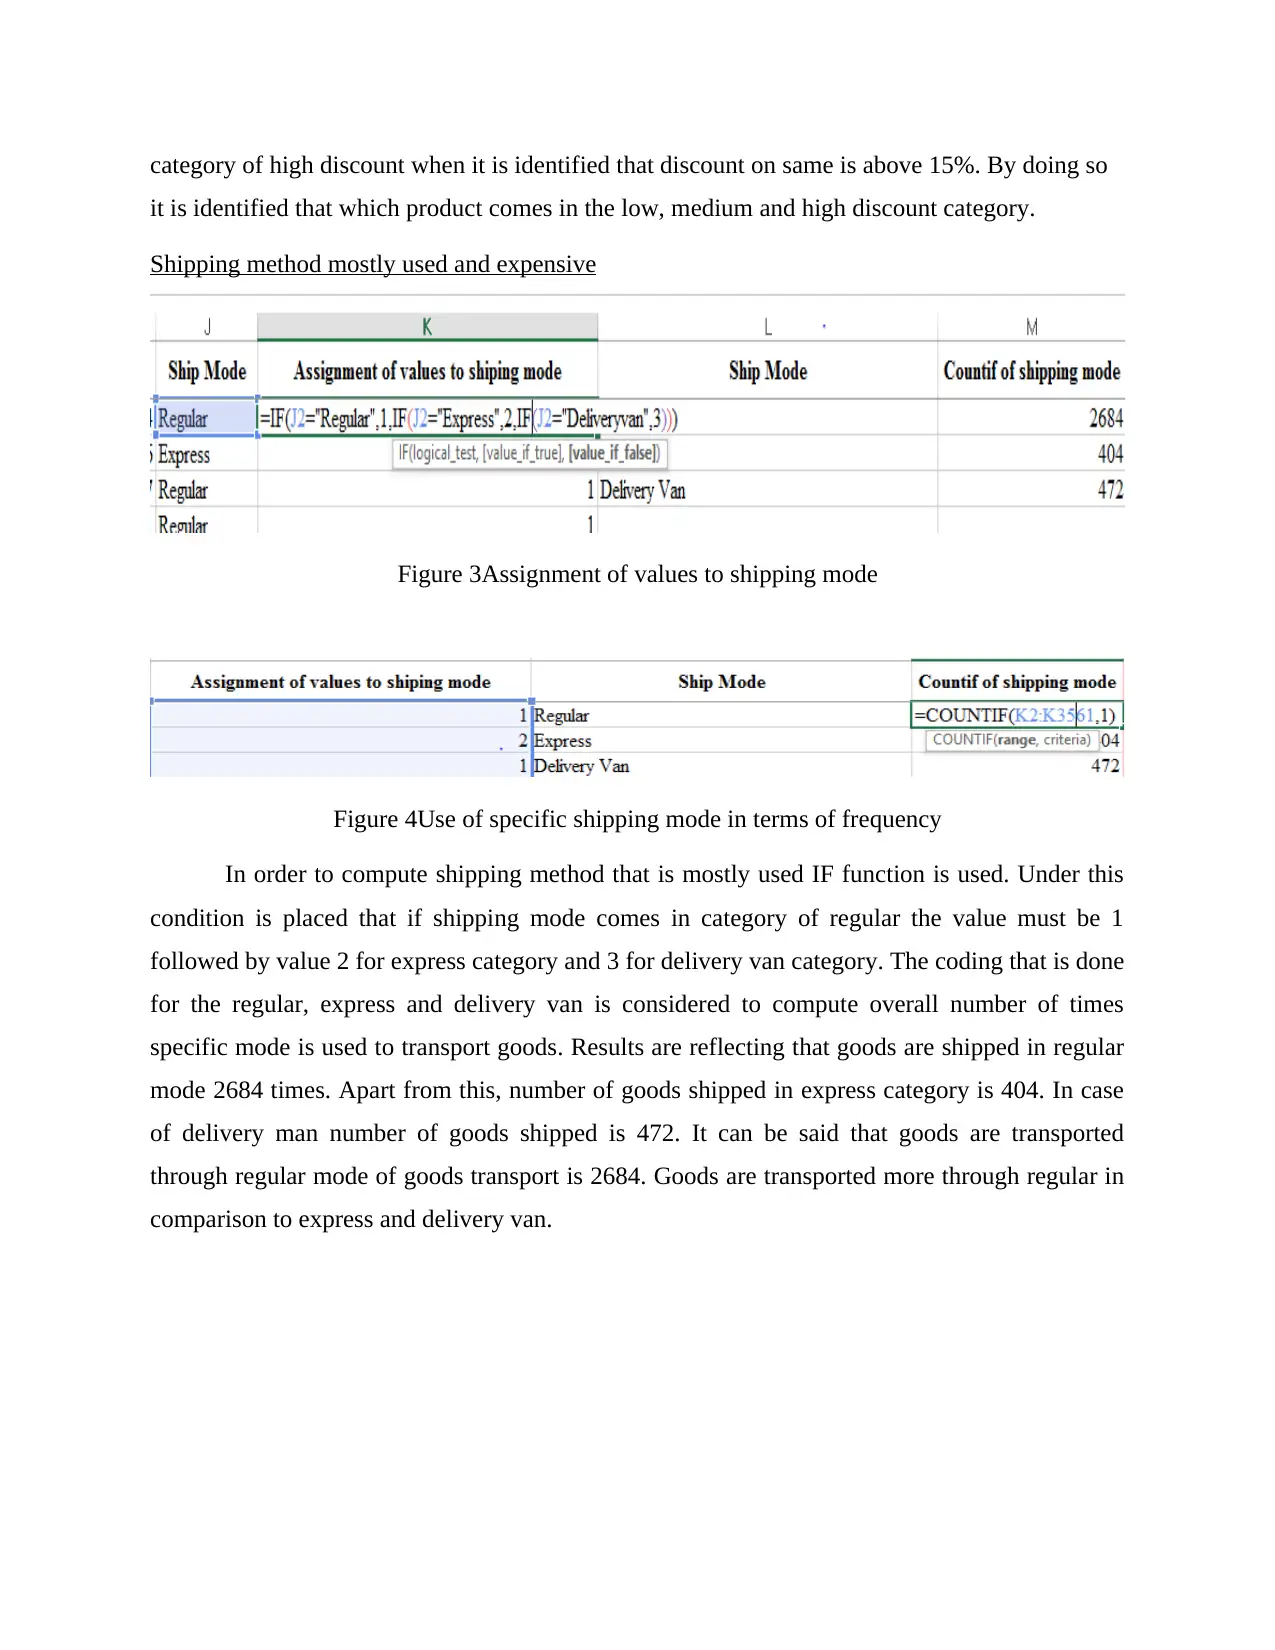
Shipping method mostly used and expensive
Figure 3Assignment of values to shipping mode
Figure 4Use of specific shipping mode in terms of frequency
In order to compute shipping method that is mostly used IF function is used. Under this
condition is placed that if shipping mode comes in category of regular the value must be 1
followed by value 2 for express category and 3 for delivery van category. The coding that is done
for the regular, express and delivery van is considered to compute overall number of times
specific mode is used to transport goods. Results are reflecting that goods are shipped in regular
mode 2684 times. Apart from this, number of goods shipped in express category is 404. In case
of delivery man number of goods shipped is 472. It can be said that goods are transported
through regular mode of goods transport is 2684. Goods are transported more through regular in
comparison to express and delivery van.
it is identified that which product comes in the low, medium and high discount category.
Shipping method mostly used and expensive
Figure 3Assignment of values to shipping mode
Figure 4Use of specific shipping mode in terms of frequency
In order to compute shipping method that is mostly used IF function is used. Under this
condition is placed that if shipping mode comes in category of regular the value must be 1
followed by value 2 for express category and 3 for delivery van category. The coding that is done
for the regular, express and delivery van is considered to compute overall number of times
specific mode is used to transport goods. Results are reflecting that goods are shipped in regular
mode 2684 times. Apart from this, number of goods shipped in express category is 404. In case
of delivery man number of goods shipped is 472. It can be said that goods are transported
through regular mode of goods transport is 2684. Goods are transported more through regular in
comparison to express and delivery van.
⊘ This is a preview!⊘
Do you want full access?
Subscribe today to unlock all pages.
Trusted by 1+ million students worldwide
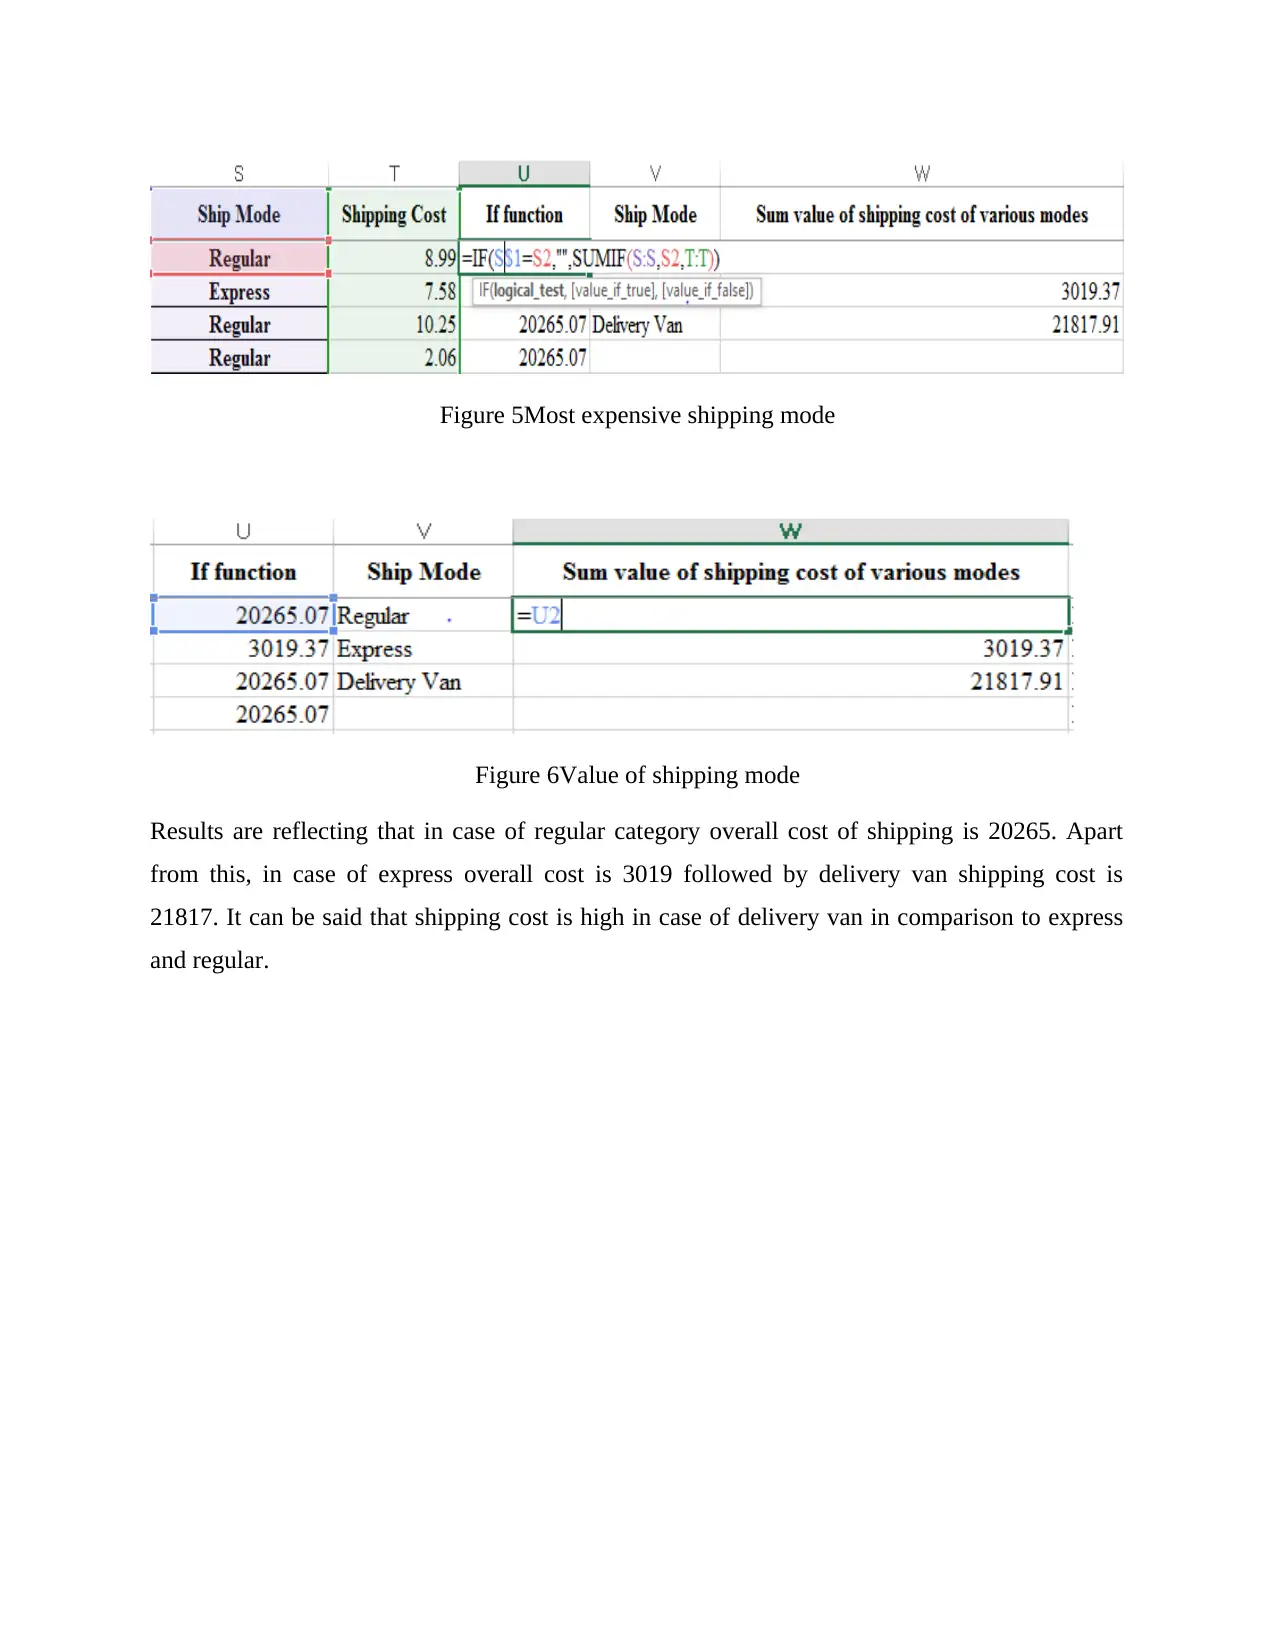
Figure 5Most expensive shipping mode
Figure 6Value of shipping mode
Results are reflecting that in case of regular category overall cost of shipping is 20265. Apart
from this, in case of express overall cost is 3019 followed by delivery van shipping cost is
21817. It can be said that shipping cost is high in case of delivery van in comparison to express
and regular.
Paraphrase This Document
Need a fresh take? Get an instant paraphrase of this document with our AI Paraphraser
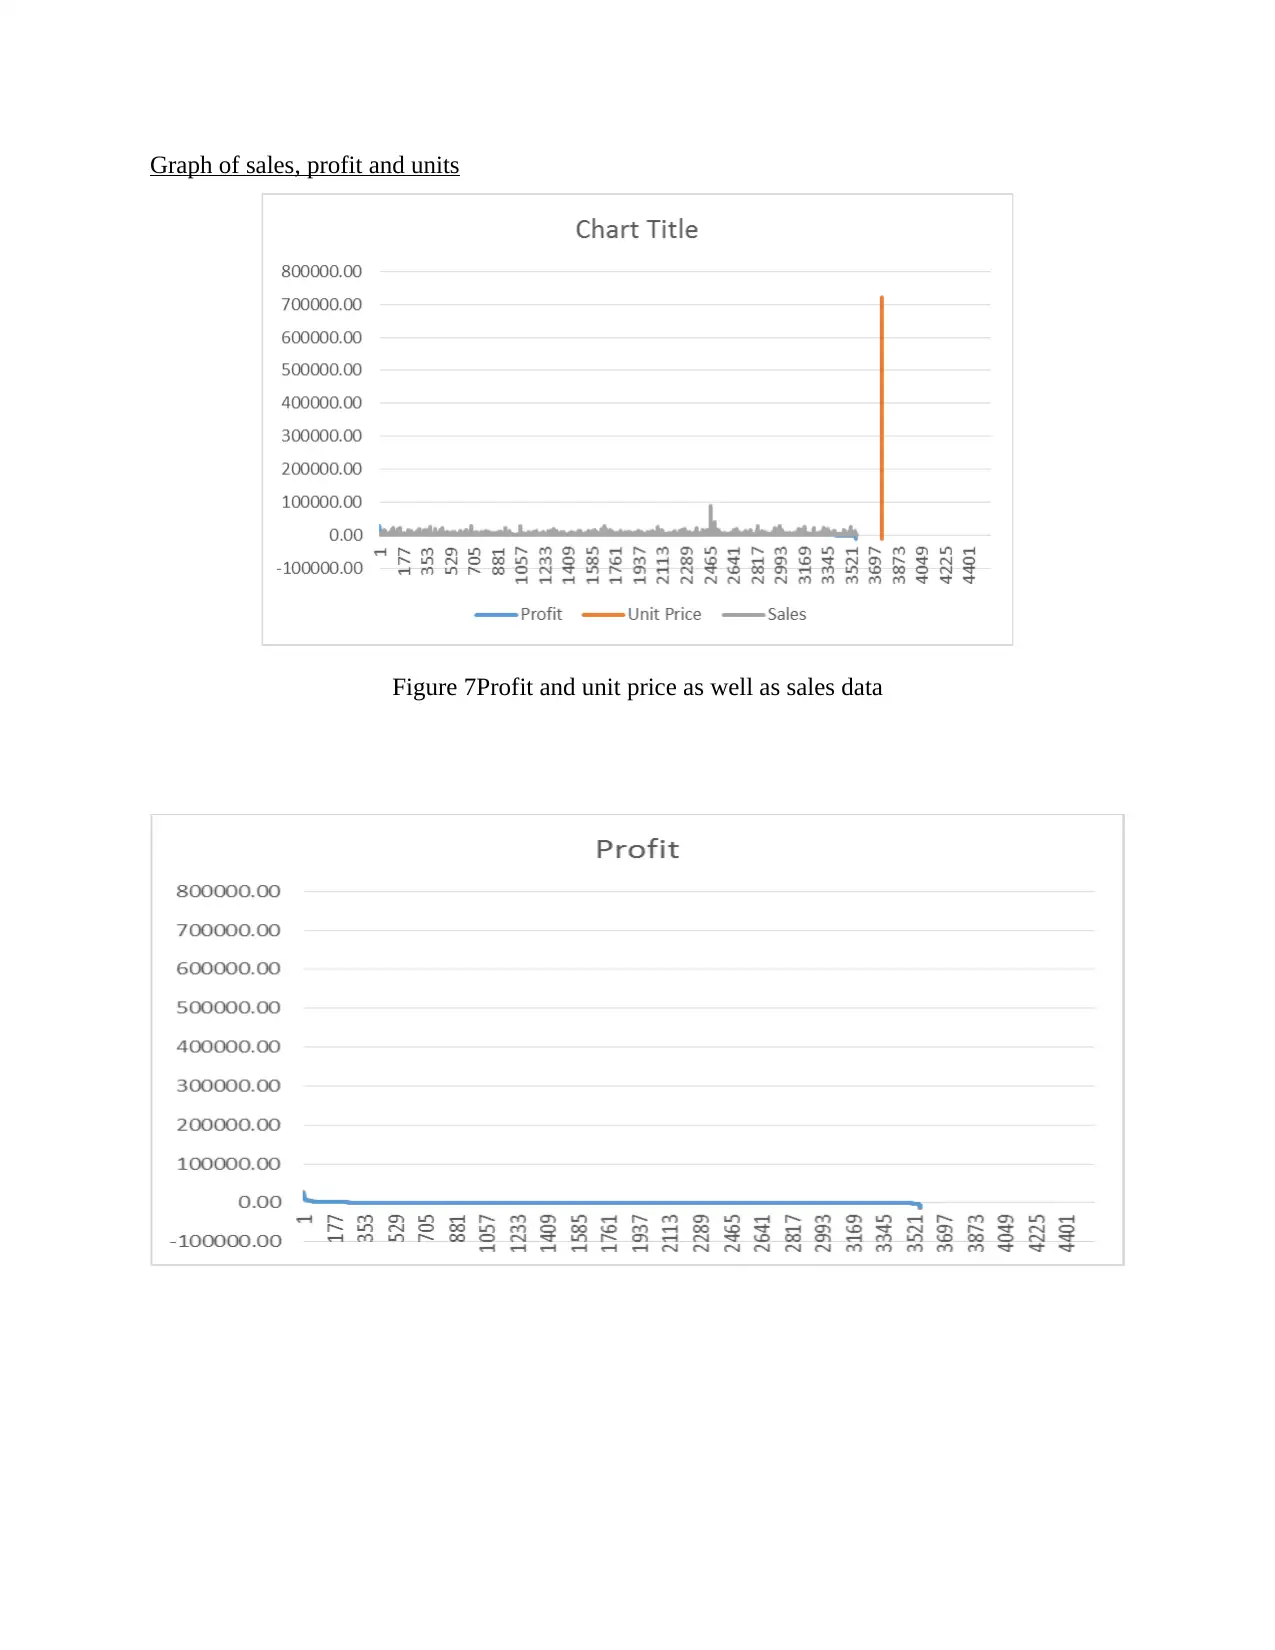
Graph of sales, profit and units
Figure 7Profit and unit price as well as sales data
Figure 7Profit and unit price as well as sales data
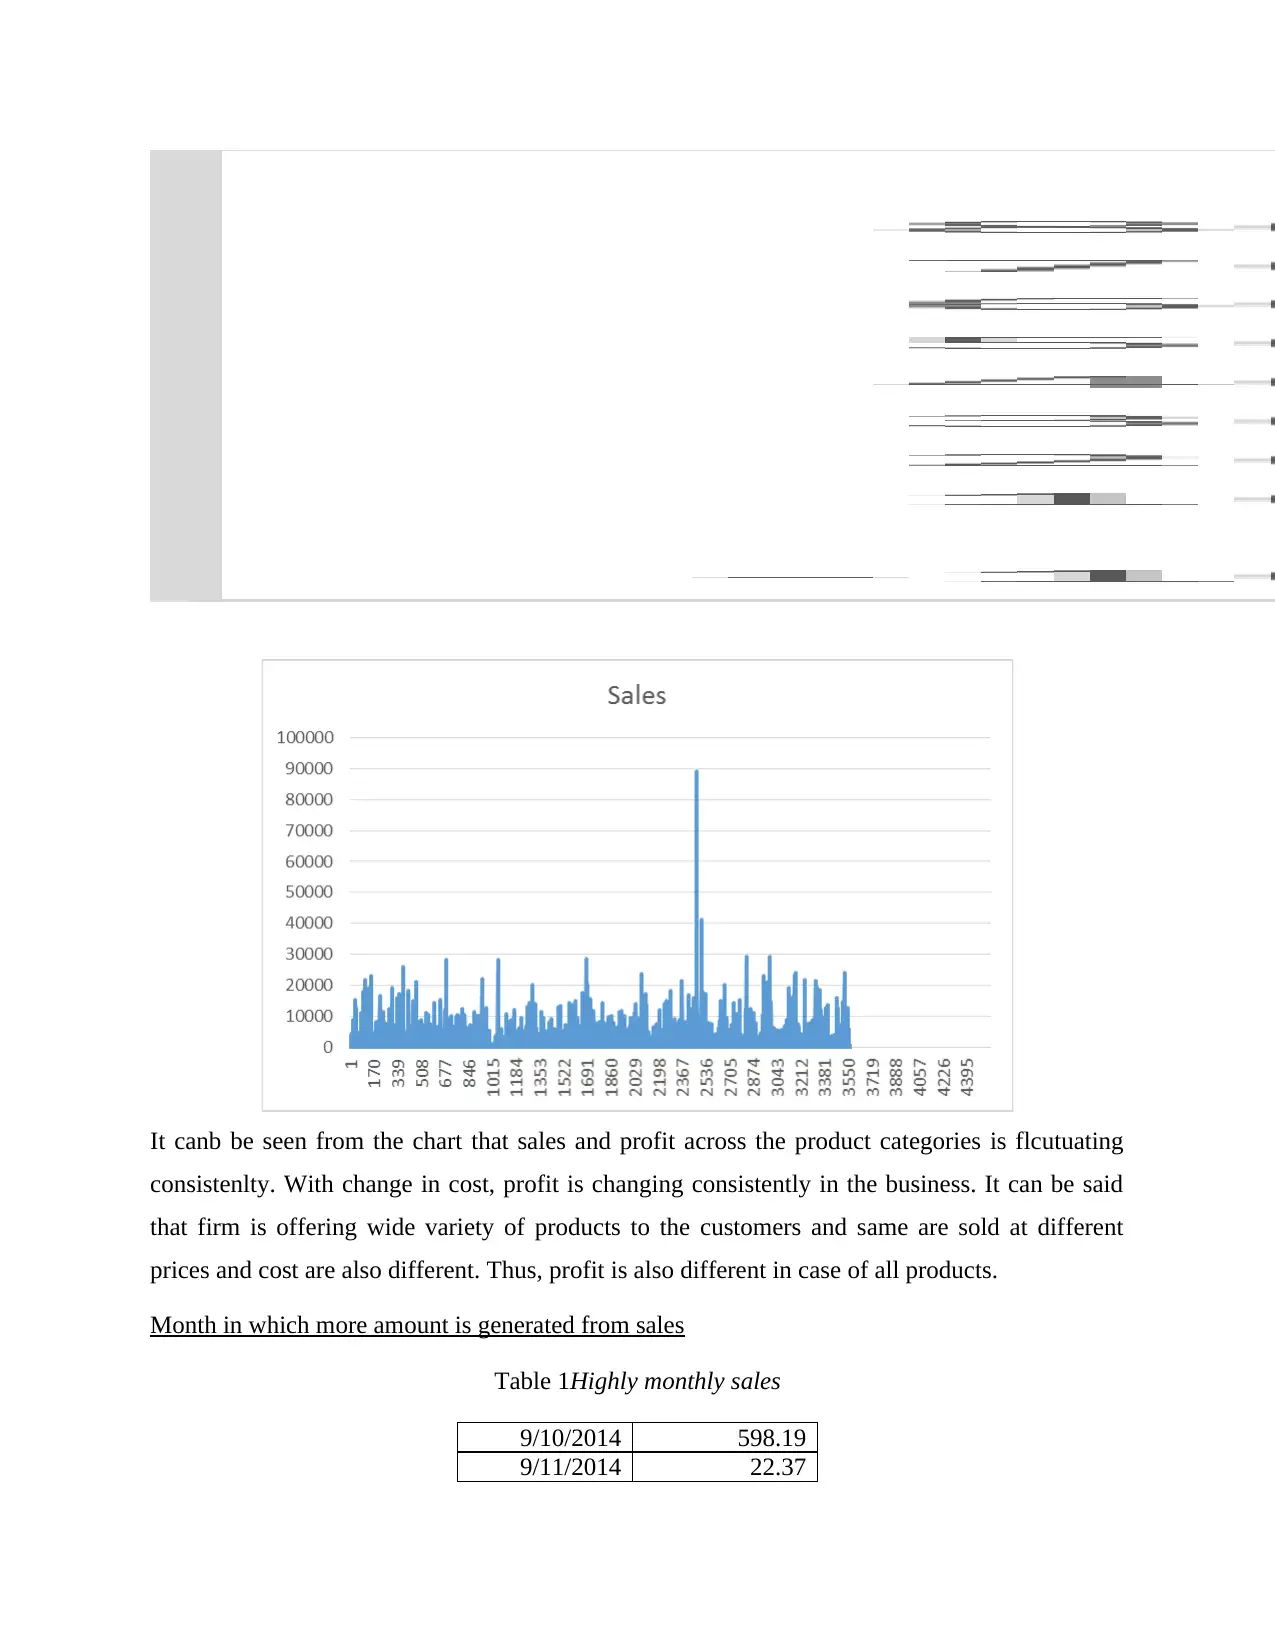
It canb be seen from the chart that sales and profit across the product categories is flcutuating
consistenlty. With change in cost, profit is changing consistently in the business. It can be said
that firm is offering wide variety of products to the customers and same are sold at different
prices and cost are also different. Thus, profit is also different in case of all products.
Month in which more amount is generated from sales
Table 1Highly monthly sales
9/10/2014 598.19
9/11/2014 22.37
⊘ This is a preview!⊘
Do you want full access?
Subscribe today to unlock all pages.
Trusted by 1+ million students worldwide
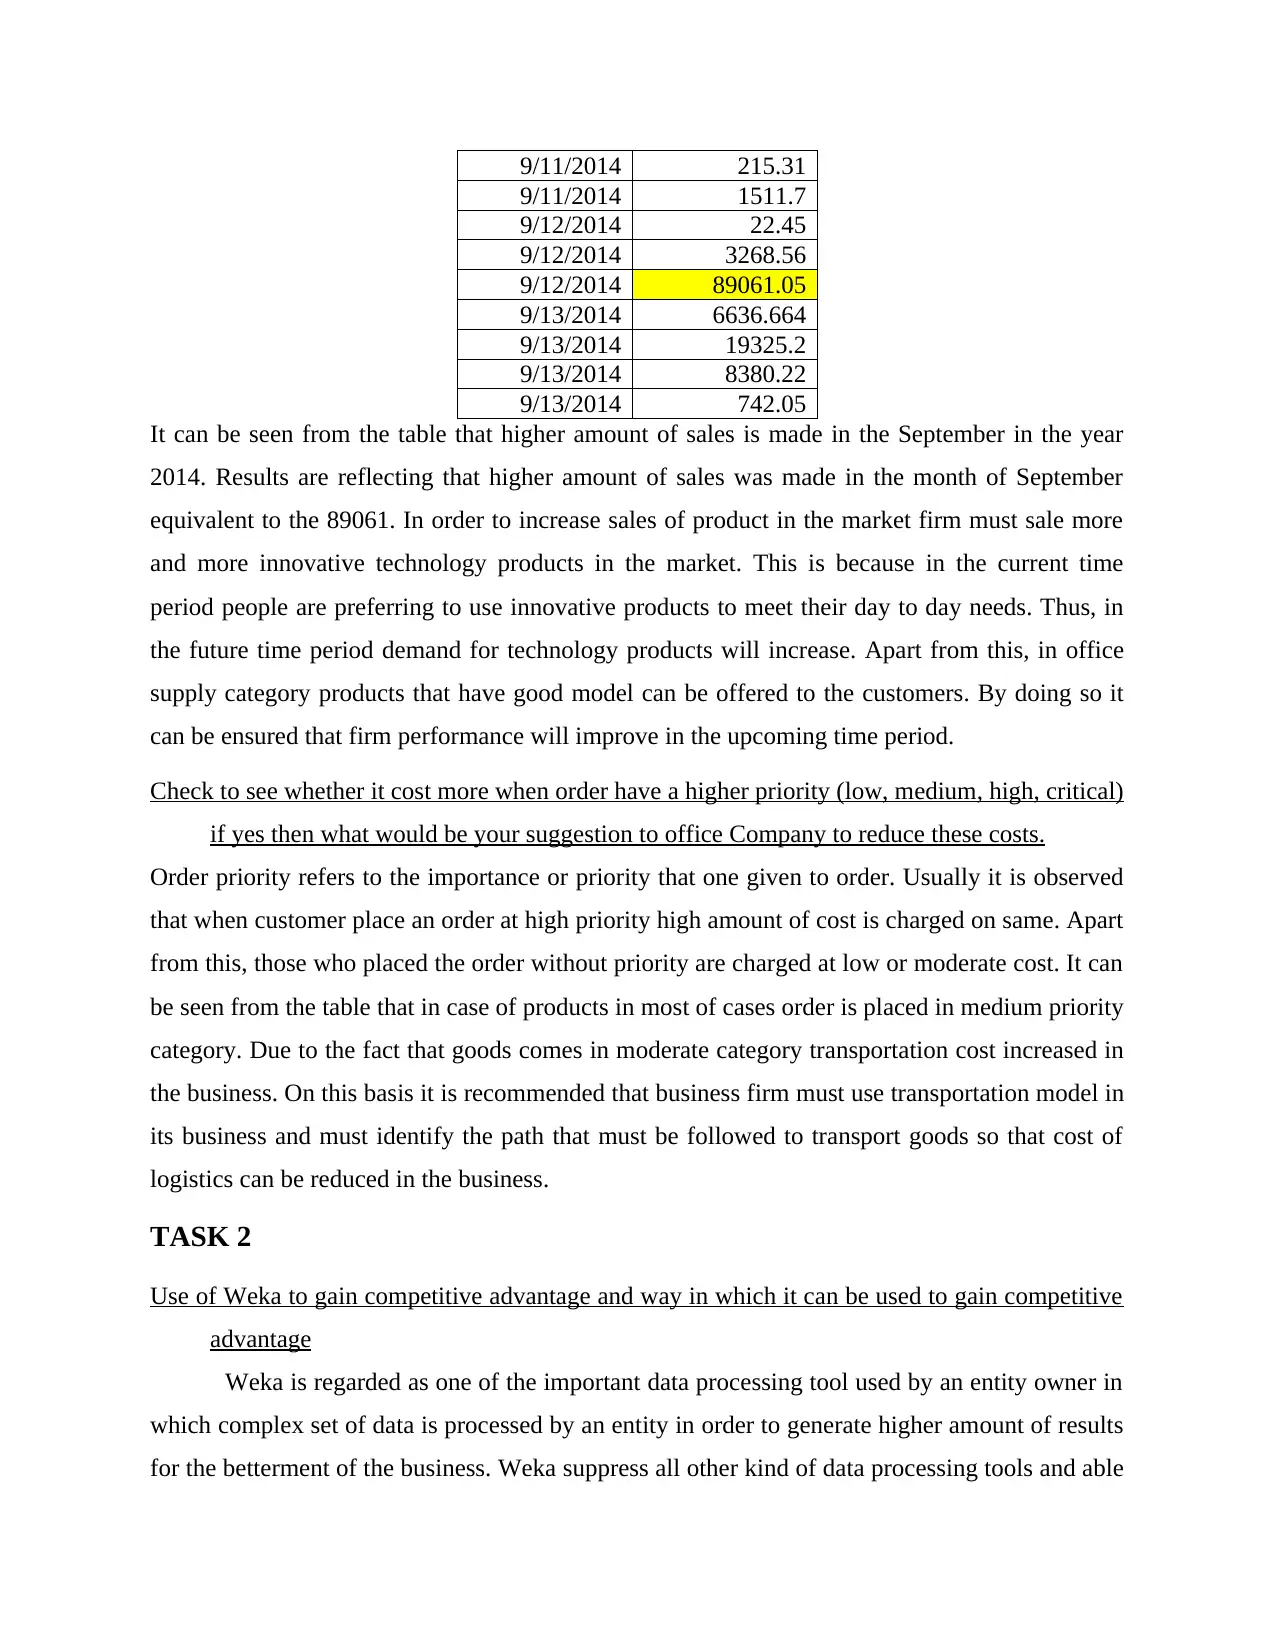
9/11/2014 215.31
9/11/2014 1511.7
9/12/2014 22.45
9/12/2014 3268.56
9/12/2014 89061.05
9/13/2014 6636.664
9/13/2014 19325.2
9/13/2014 8380.22
9/13/2014 742.05
It can be seen from the table that higher amount of sales is made in the September in the year
2014. Results are reflecting that higher amount of sales was made in the month of September
equivalent to the 89061. In order to increase sales of product in the market firm must sale more
and more innovative technology products in the market. This is because in the current time
period people are preferring to use innovative products to meet their day to day needs. Thus, in
the future time period demand for technology products will increase. Apart from this, in office
supply category products that have good model can be offered to the customers. By doing so it
can be ensured that firm performance will improve in the upcoming time period.
Check to see whether it cost more when order have a higher priority (low, medium, high, critical)
if yes then what would be your suggestion to office Company to reduce these costs.
Order priority refers to the importance or priority that one given to order. Usually it is observed
that when customer place an order at high priority high amount of cost is charged on same. Apart
from this, those who placed the order without priority are charged at low or moderate cost. It can
be seen from the table that in case of products in most of cases order is placed in medium priority
category. Due to the fact that goods comes in moderate category transportation cost increased in
the business. On this basis it is recommended that business firm must use transportation model in
its business and must identify the path that must be followed to transport goods so that cost of
logistics can be reduced in the business.
TASK 2
Use of Weka to gain competitive advantage and way in which it can be used to gain competitive
advantage
Weka is regarded as one of the important data processing tool used by an entity owner in
which complex set of data is processed by an entity in order to generate higher amount of results
for the betterment of the business. Weka suppress all other kind of data processing tools and able
Paraphrase This Document
Need a fresh take? Get an instant paraphrase of this document with our AI Paraphraser
to get higher competitive advantage over all the competitors on a clear reason that this particular
approach utilizes large set of data in order to process in simplifying the complexity lies in the
overall data collected by an entity in their business. The current data programming language used
by an entity is to evaluate the efficiency of overall data as it is important for an entity in order to
resolve all their doubts and queries in managing complete set of data in order to produce reliable
output in order to generate higher outcomes in the business (Navas, Parra and Molano, 2016).
Audi is reputable d branded organization which offers expensive cars according to the
tastes and preferences of all kinds of customers who have visited the showroom. There are many
customers visited the showrooms for Audi needs to be manage ll of their records that helps an
entity owner in order to take their consent about purchasing cars or any customized feature want
by a customers in particular cars. An entity earns higher amount of profit every day that shows
the seriousness of an entity in attracting wide number of customers towards all kinds of products
or services offered by an entity to steal the attention of most of customers. Retaining all kinds of
consumers in the current business is the basic objective of the business firm that needs to be
accomplished within the passage of time. All kinds of complex data can be simplified with the
help of Weka software which is used by an entity in order to find out the actual result by
inputting the data into the system (Xie and Enck 2016). Various kinds of facts and figures used
by an entity will be inputted into the system in order to ascertain the final outcome as this will in
turn accomplishes all the goals and the objectives of the business in order to create good brand
image of an entity among all kinds of customers located in the external business environment.
Results obtained with the help of Weka which simplifies large set of data in order to help
an entity owner in order to accomplish all kinds of goals and the objectives framed by an entity
owner within a particular time period. Concealed and hidden facts about Audi will get revealed
with the help of Weka which considers each and every facts and figures in order to accomplish
desire aims and the objectives of an entity in improving financial performance of an entity within
a particular financial year (Navas, Parra and Molano, 2016). The data of Audi will be analyses
with the help of Weka helps an entity owner in order to ascertain the amount of profit generated
by an entity as his would help an entity owner in order to ascertain all the reasons behind
decreasing or increasing amount of profit.
Weka can be used by variety of firm’s especially small entity who will feed all their data
into the system in order to take important decisions about the current financial condition of an
entity tat needs to be improved with the passage of time. Role of an entity gets increases with the
time in which all kinds of facts and figures will be used by an entity in identifying the core
strengths of an entity in order to cover up all their weaknesses in order to get market advantages
in the external business environment. It is less expensive for all the organization as it is open
source software just like android which can be used by any entity in less costs that can be
upgraded by the business according to their needs and higher expectations.
Algorithms used in the Weka such as J 48 algorithms shows the overall working as this
depicts the actual performance of an entity in handling complex set of data in order to
accomplish the desired results for the beneficial of an entity as their desired motive is to
accomplish all the goals and the objectives within less period of time which also depicts the
transparent working conditions of an entity in front of all the external market users (Russom,
2011). This kind of software accomplishes desired aims and the objectives o an entity owner as
this taken into consideration all the facts and figures by setting various parameters in order to test
the overall accuracy of data feed y an individual in the system in order to generate final outcome
for the business.
Merits and dermis of Weka in comparison to excel
Advantages
Data complexity- Weka is always better choice for an individual who deals with large and
complex set of data in their daily routine business which needs to be managed by an individual in
order to generate higher amount of results for the betterment of the business. Excel fails to
consider large set of data as it easily crashes down while handling large and complex data set
which results into no achievement of any kinds of goals and the objectives by an individual in
their business. Audi store requires Weka as one of the problem solver ho will considered large
data set as this is also renamed as data handler in order to facilitate varies of users in handling
complexities lies in the existing data set in order to generate higher amount if results in the near
future.
Statistical functions- Excel used to differentiate variety of data sets using different statistical
functions such as V Lookup and IF statements in order to improve the overall data set according
to the desired aims and targets of the business (Ferguson, 2012). On the other hand, in Weka
algorithms and cluster are used in order of classify the overall feed data into various branches n
facilitating variety users working for the betterment of the business.
⊘ This is a preview!⊘
Do you want full access?
Subscribe today to unlock all pages.
Trusted by 1+ million students worldwide
1 out of 21
Related Documents


Your All-in-One AI-Powered Toolkit for Academic Success.
+13062052269
info@desklib.com
Available 24*7 on WhatsApp / Email
![[object Object]](/_next/static/media/star-bottom.7253800d.svg)
Unlock your academic potential
Copyright © 2020–2026 A2Z Services. All Rights Reserved. Developed and managed by ZUCOL.