Business Data Analysis for Restaurant Expansion: A Detailed Report
VerifiedAdded on 2020/02/03
|17
|4205
|126
Report
AI Summary
This report details a business development project focused on a restaurant's expansion plans. It begins with an introduction highlighting the importance of data-driven decisions in the restaurant industry. The project outlines a data collection plan, encompassing both primary and secondary data sources, emphasizing the significance of customer satisfaction. It then describes the preparation of a survey methodology, including sampling techniques and questionnaire design. The second part of the report focuses on summarizing collected data, calculating statistical measures such as mean, median, mode, interquartile range, standard deviation, quartiles, percentiles, and correlation coefficients. The report includes a questionnaire designed to gather customer preferences and purchasing habits, and provides sales and profit data for analysis. The ultimate goal of this project is to provide insights and recommendations for the restaurant's expansion strategy based on thorough data analysis.

BDM
Paraphrase This Document
Need a fresh take? Get an instant paraphrase of this document with our AI Paraphraser
Table of Contents
INTRODUCTION...........................................................................................................................4
1.1 Prepare data collection...........................................................................................................4
1.2 Prepare survey methodology.................................................................................................5
1.3 Design questionnaire..............................................................................................................7
TASK 2..........................................................................................................................................11
2.1 Summarizing data which are collected................................................................................11
2.2 Calculation of mean, median as well as mode value...........................................................11
2.3 Computation of Inter quartile range and standard deviation...............................................12
2.4 Calculating quartile, percentile as well as correlation of coefficient...................................13
CONCLUSION..............................................................................................................................14
REFERENCES..............................................................................................................................16
INTRODUCTION
Decisions are regarded as one of the important aspects in an organization which is
essential in order to enhance overall performance of an entity. It plays an important role in the
business in which all hidden aspects of the business will be covered in order to grab higher
market opportunities in the external business environment. The analytic ability of an individual
will get increase with the passage of time which helps in achieving desired market aims and
targets in order to grab higher market opportunities located in the external business environment.
This project is all about restaurants who intend to expand its existing restaurants by considered
all the tastes and preferences in order to satisfy all the customers exist in the external business
environment. This particular industry is regarded as the dynamic industry which is full of
uncertainties in which the current business performance will get improved with the passage of
time in order to achieve desired aims and target accomplishes by an entity Basic pillar for the
restaurant is to get higher level of customers satisfaction which is essential aspects in order to
grab higher market opportunities to improve the current skills and the capabilities of an entity.
This report is all about creating a data collection plan which will includes both primary and
secondary collection of data that helps an individual in order to taken into considerations all the
hidden facts about a particular product or services. This report also stresses on select the best
suitable data in order to achieve desired market facts and figures by suing the best suitable
sampling methods such as random sampling and stratified sampling. The questionnaires designed
y an entity will help in knowing about the facts and figures of all the customers in order to know
their reaction towards the products or services of an entity.
1.1 Prepare data collection
Research is regarded as one of the important process for an entity who intends to expand
their process which needs to focus on all the aspects relevant for their business (Andersen,
2016). This is regarded as the voyage of discovery in which all important facts and figures will
be revealed by an entity. The desired aim of the business is to accomplish desired aim and the
objectives within a given period as collecting all the data about the current study will help an
entity in accomplishing all the tasks and duties in comparison with the competitors located in the
external business environment. There are two important methods of collecting data which
⊘ This is a preview!⊘
Do you want full access?
Subscribe today to unlock all pages.
Trusted by 1+ million students worldwide
includes primary as well as secondary collection of data in order to collect important fact and
figures in achieving desired aims and the objectives.
Primary collection- Primary collection of data is used by an entity which helps in collecting
important data for the beneficial of an entity in which an entity owner determines the financial
performance of the business in order to collect important information for the betterment of an
entity. In this particular source the data will be personally collected y an individuals by searching
all the data in order to consider all the data from its original source in order to enhance the
overall quality of all the collected data (Bresnen, 2016).Bresnen, M., 2016 The facts and figures
collected to this particular source will help an individual in order to accomplish desired aims and
the objectives of an entity. It is time consuming process and highly expensive process which will
collect relevant information for the betterment of the project in taken into considerations all the
tastes and preferences of variety of customers located in the external business environment in
order to achieve the desired aims and targets. Questionnaires are used by an individual in which
consent of all individuals will be take into consideration which helps an entity in order to design
all the products or services that helps in expanding their business by extending overall market
share by providing additional advantage to an entity in the external business environment in
order to achieve desired aims and targets within a less period. Questionnaires is that particular
approach in which specific information will be collected by an individual for he beneficial of an
entity in order to achieve desired aims and the targets.
Secondary collection- It is that kid of collection of data in which external source will be used by
an entity owner in order to collect important facts and figures in accomplish desired aims and the
objectives of an entity in less period (Papke-Shields and Boyer-Wright, 2017). Books and
journals will be used by an entity in considering all the tastes and preferences of variety of
customers by taking into considerations all the tastes and preferences while designing all the
products or services of the business entity in order to grab highs market advantage in the overall
business environment as desired aim of the business is to accomplish the desired aims and the
objectives of the business within a given period.
1.2 Prepare survey methodology
Sampling is regarded as one of the important technique in collecting important facts and
figures in order to accomplish the desired aims and targets. Random sampling will be used by an
Paraphrase This Document
Need a fresh take? Get an instant paraphrase of this document with our AI Paraphraser
individual in which data will be collected randomly in which the probability of all the samples in
the total population in accomplishing al the desired aims and the objectives in less period. The
collection of data will be used by an entity in order to collect samples out of the total population
used for the purpose of analysis (Wang and et.al., 2016). The total sample of this particular
research study is 50 in which various society members and several business groups will be
selected by an individual in order to collect important business information for the betterment of
the business. Desired aim of the business is to consider various aims and targets in order to
achieve desired market goals and the objectives within a less period. Desired aim of the business
is to accomplish the higher level of customer’s satisfaction in the best possible manner in
relieving all the aims and targets in the best possible manner.

1.3 Design questionnaire
⊘ This is a preview!⊘
Do you want full access?
Subscribe today to unlock all pages.
Trusted by 1+ million students worldwide
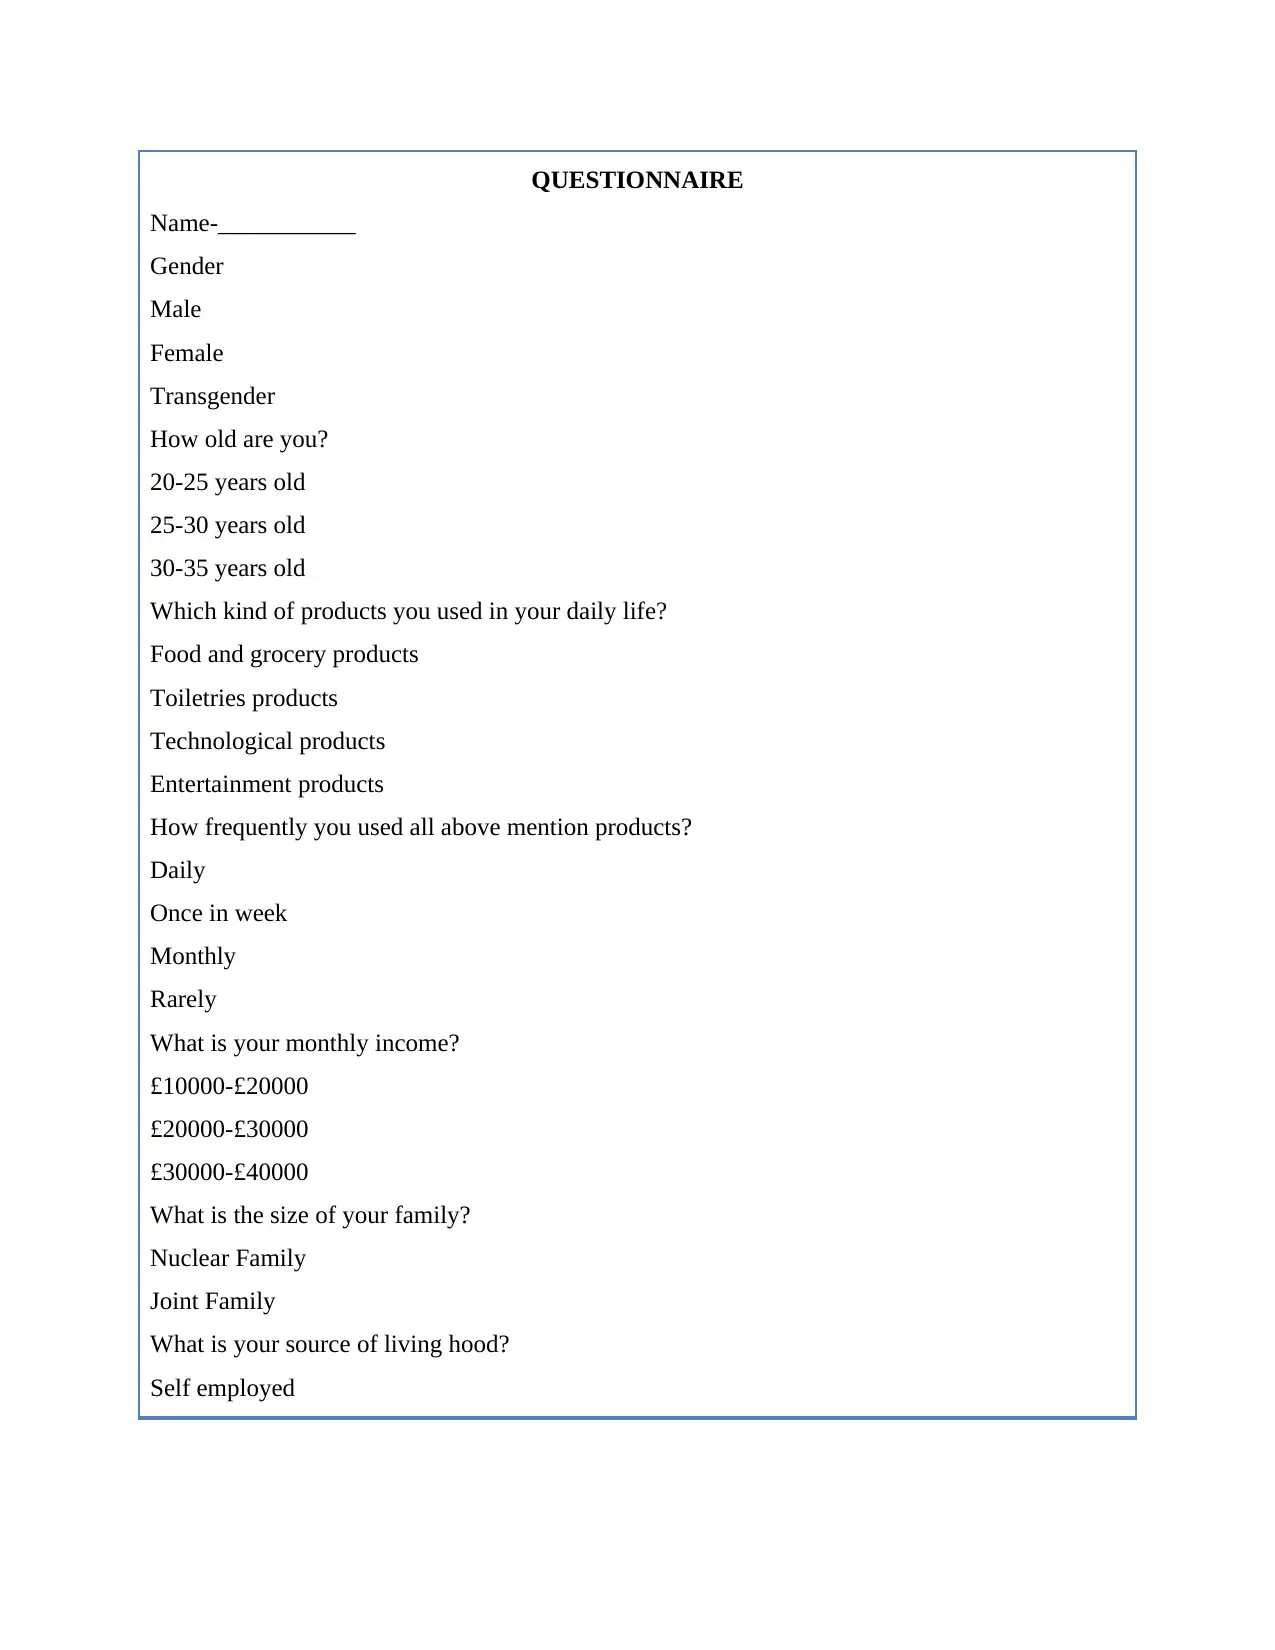
QUESTIONNAIRE
Name-___________
Gender
Male
Female
Transgender
How old are you?
20-25 years old
25-30 years old
30-35 years old
Which kind of products you used in your daily life?
Food and grocery products
Toiletries products
Technological products
Entertainment products
How frequently you used all above mention products?
Daily
Once in week
Monthly
Rarely
What is your monthly income?
£10000-£20000
£20000-£30000
£30000-£40000
What is the size of your family?
Nuclear Family
Joint Family
What is your source of living hood?
Self employed
Paraphrase This Document
Need a fresh take? Get an instant paraphrase of this document with our AI Paraphraser
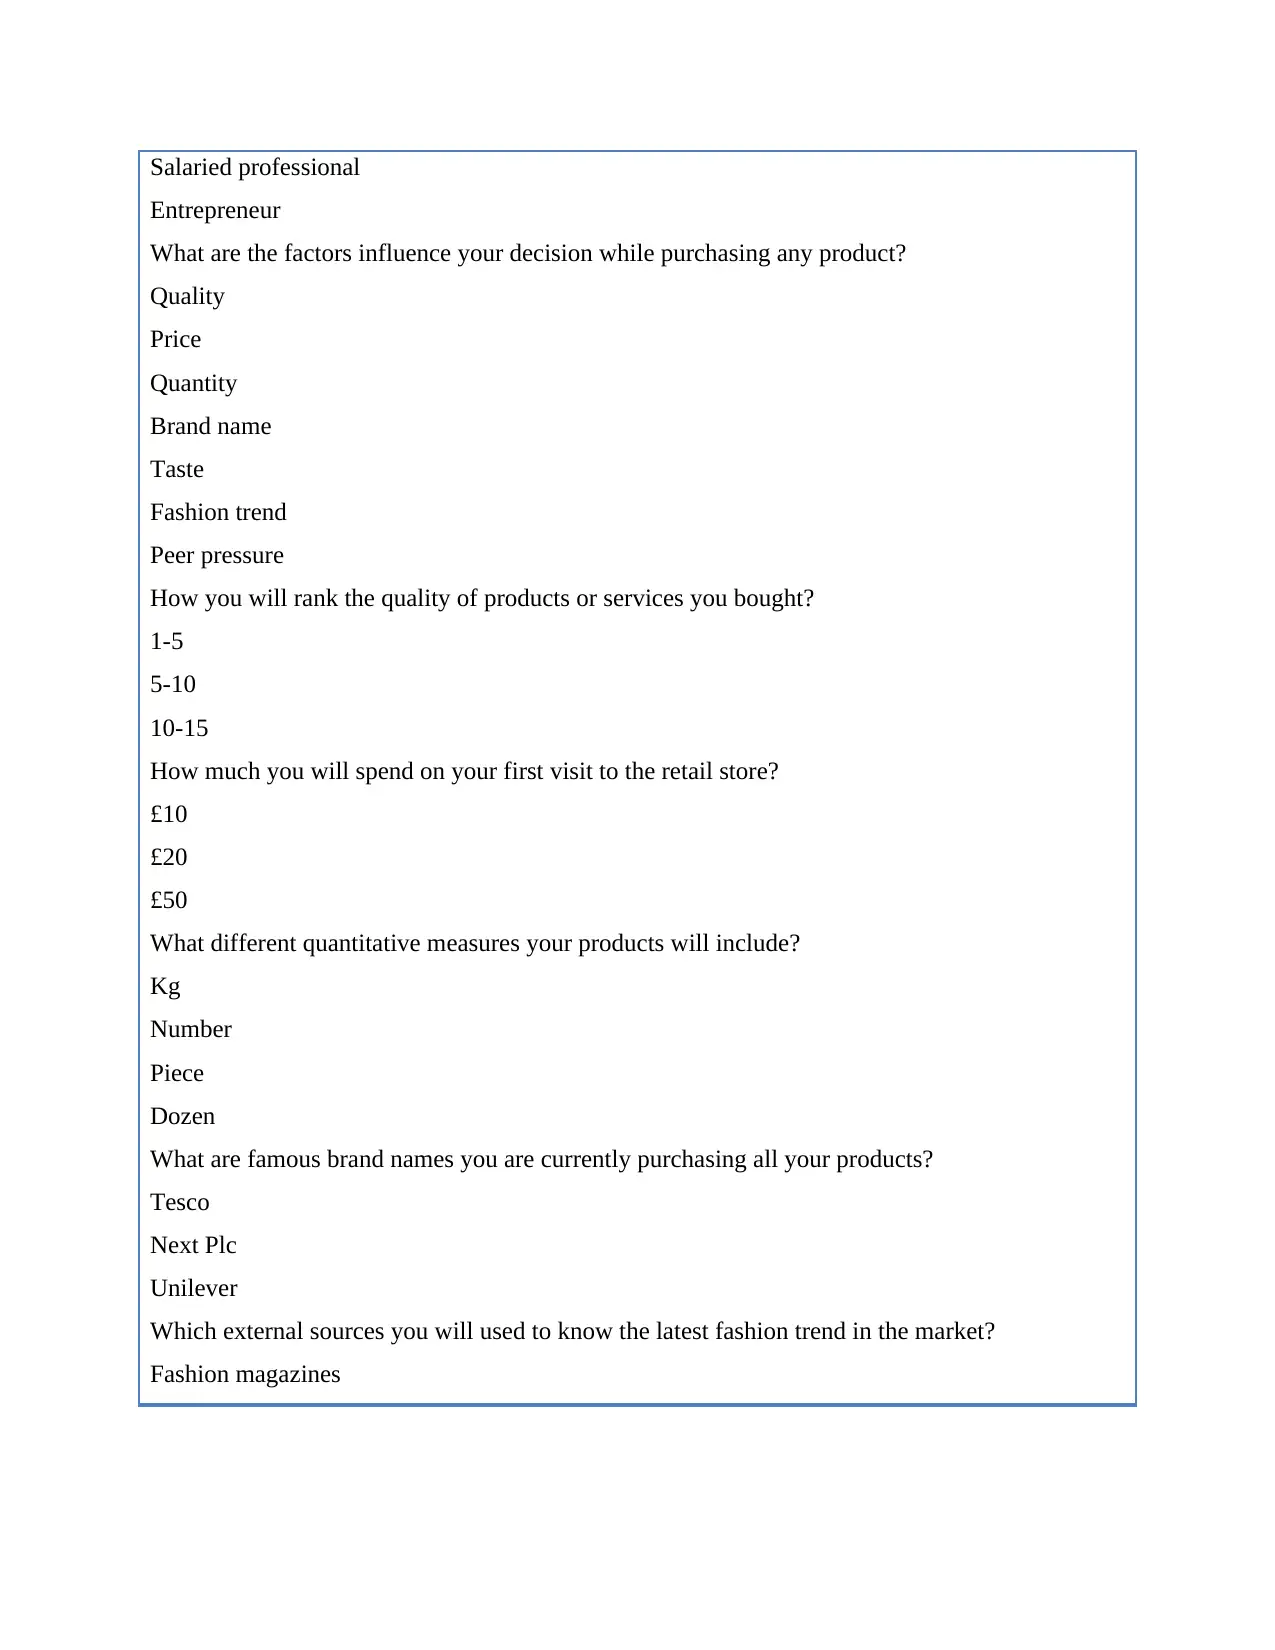
Salaried professional
Entrepreneur
What are the factors influence your decision while purchasing any product?
Quality
Price
Quantity
Brand name
Taste
Fashion trend
Peer pressure
How you will rank the quality of products or services you bought?
1-5
5-10
10-15
How much you will spend on your first visit to the retail store?
£10
£20
£50
What different quantitative measures your products will include?
Kg
Number
Piece
Dozen
What are famous brand names you are currently purchasing all your products?
Tesco
Next Plc
Unilever
Which external sources you will used to know the latest fashion trend in the market?
Fashion magazines
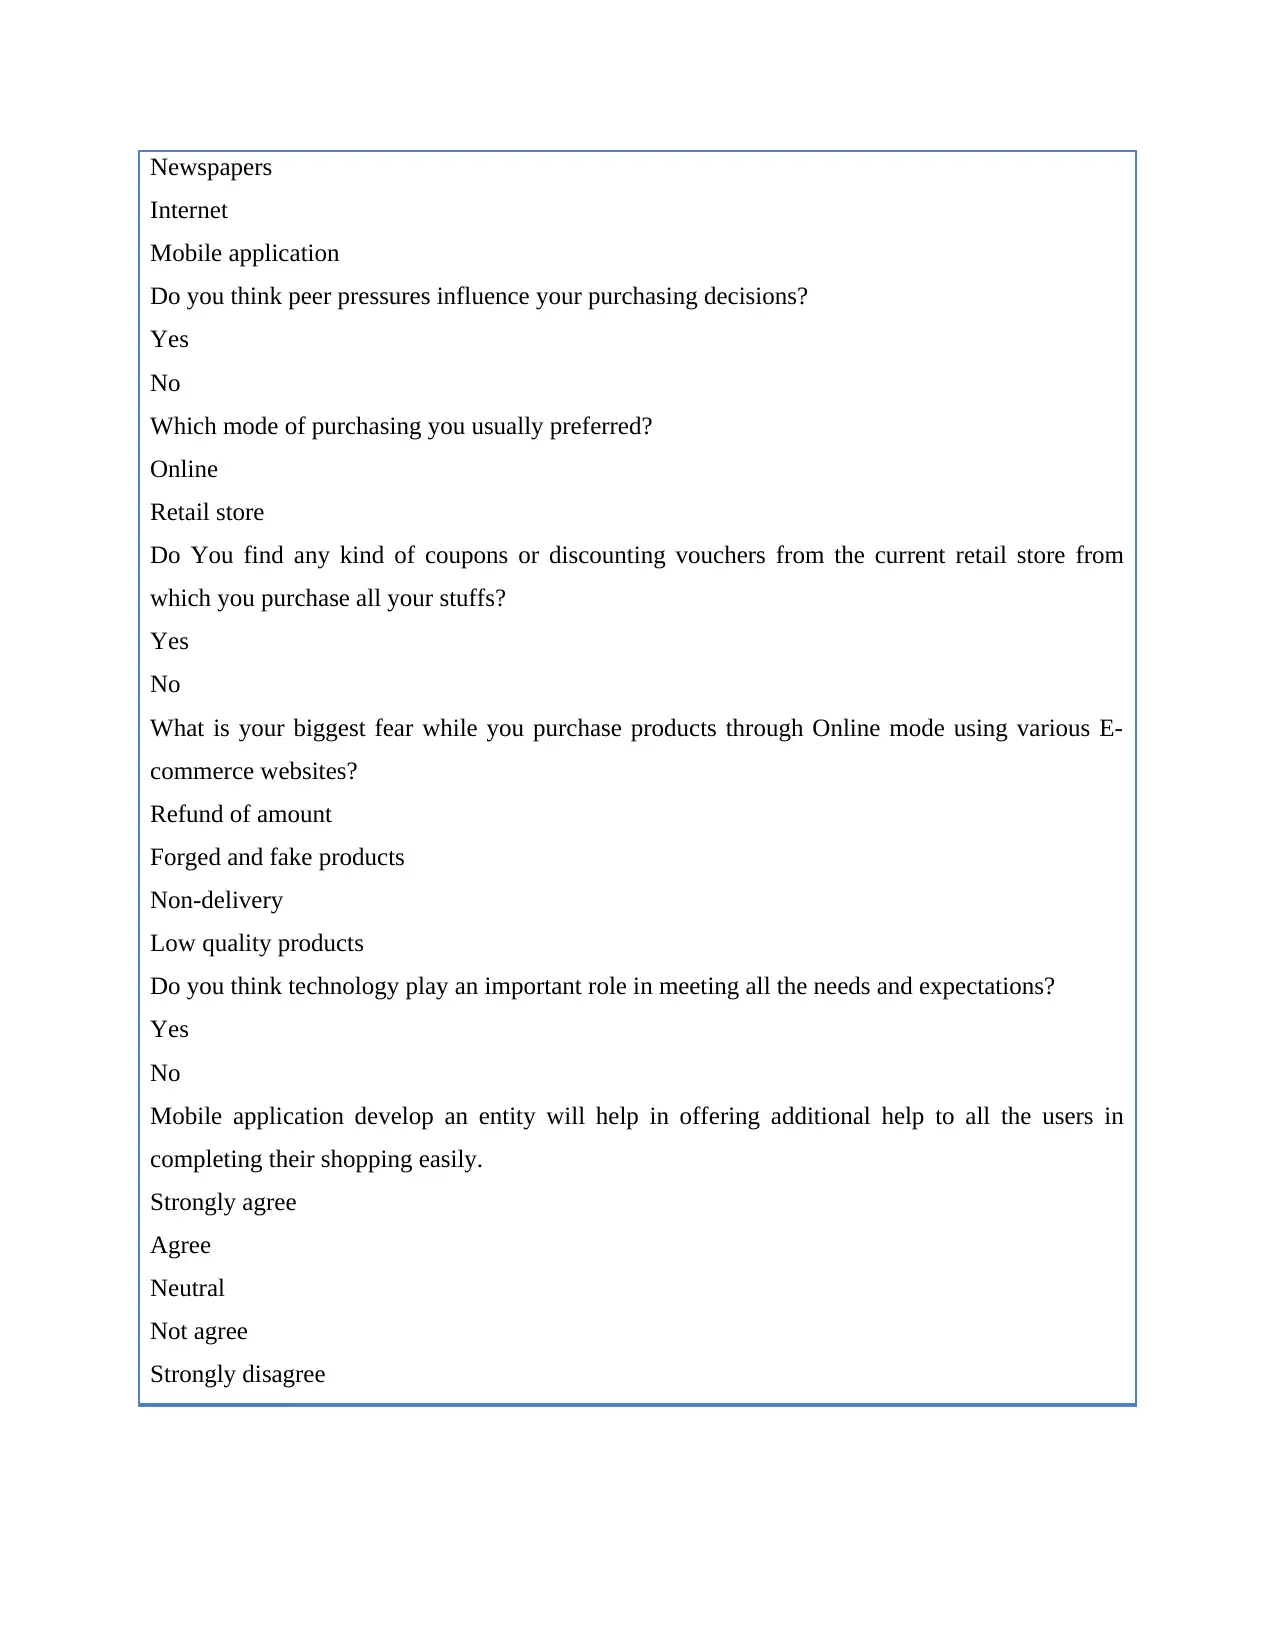
Newspapers
Internet
Mobile application
Do you think peer pressures influence your purchasing decisions?
Yes
No
Which mode of purchasing you usually preferred?
Online
Retail store
Do You find any kind of coupons or discounting vouchers from the current retail store from
which you purchase all your stuffs?
Yes
No
What is your biggest fear while you purchase products through Online mode using various E-
commerce websites?
Refund of amount
Forged and fake products
Non-delivery
Low quality products
Do you think technology play an important role in meeting all the needs and expectations?
Yes
No
Mobile application develop an entity will help in offering additional help to all the users in
completing their shopping easily.
Strongly agree
Agree
Neutral
Not agree
Strongly disagree
⊘ This is a preview!⊘
Do you want full access?
Subscribe today to unlock all pages.
Trusted by 1+ million students worldwide
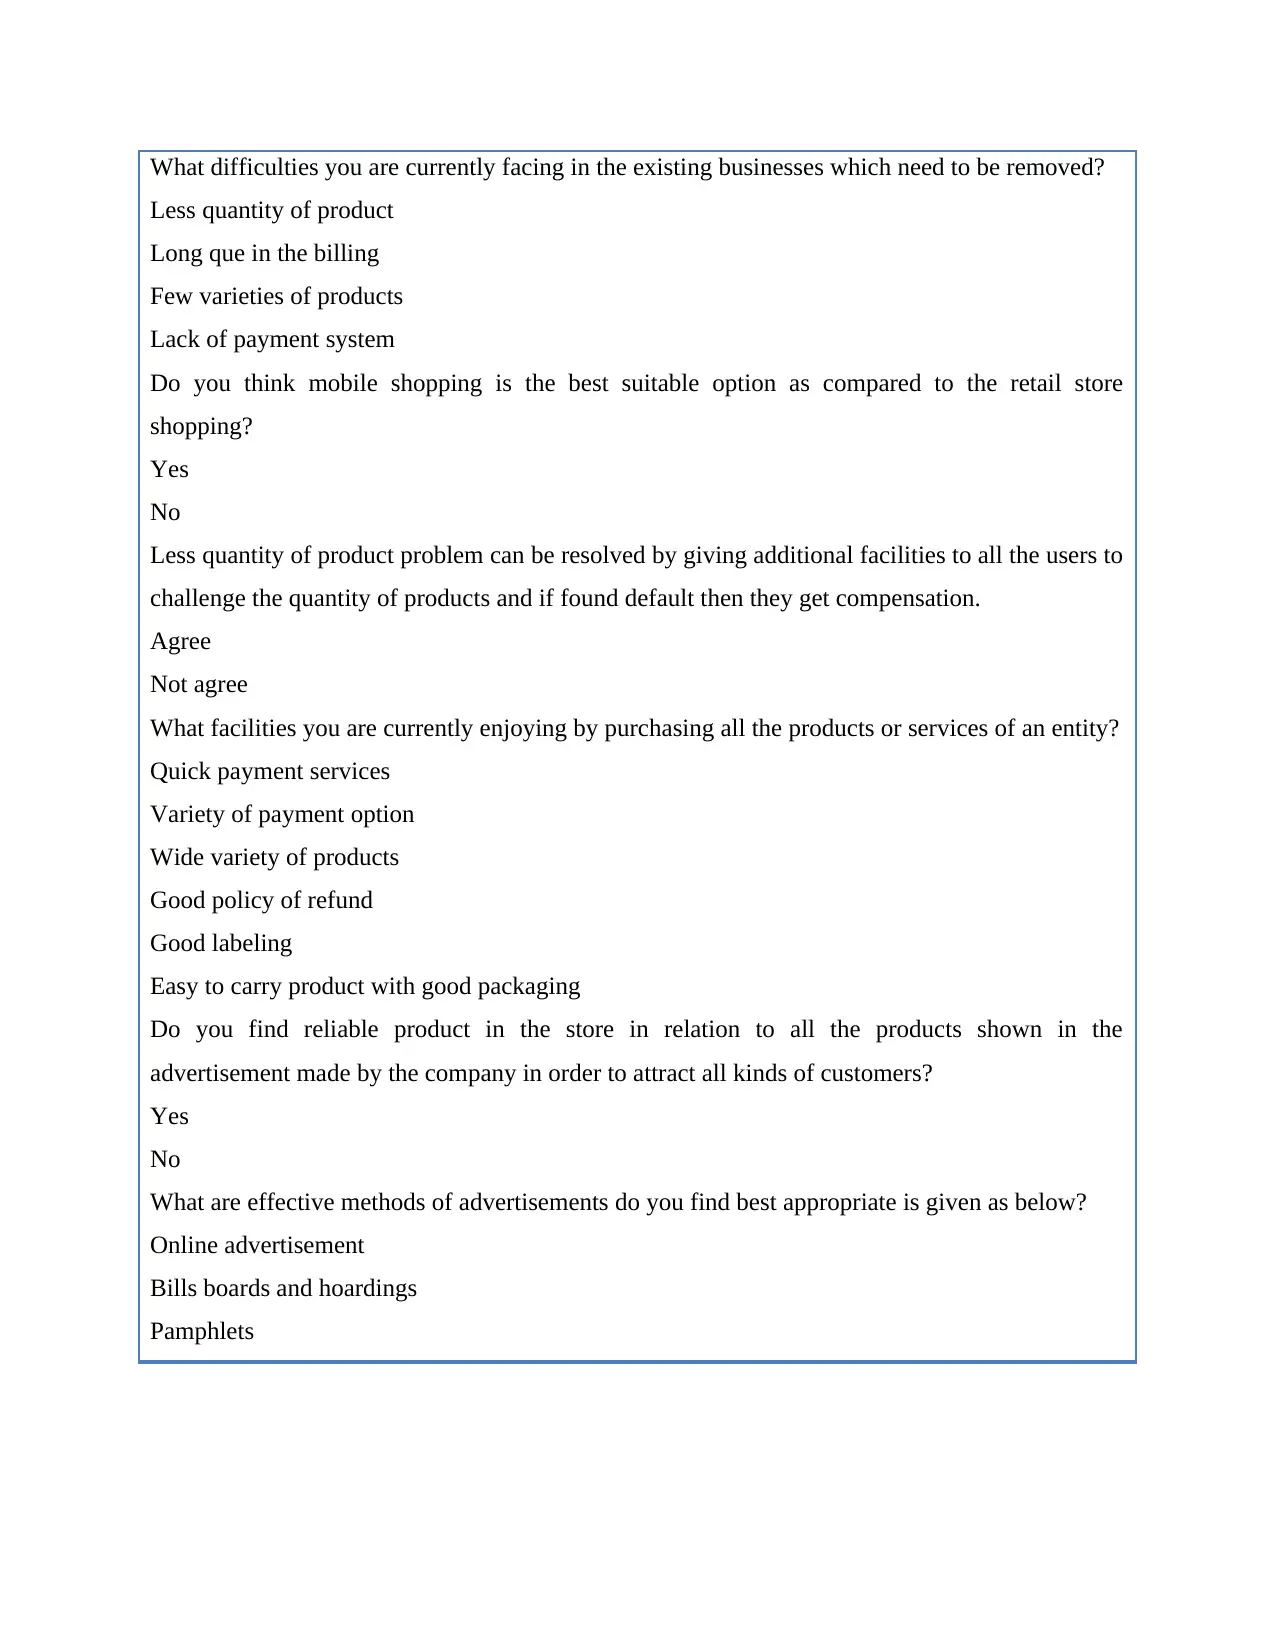
What difficulties you are currently facing in the existing businesses which need to be removed?
Less quantity of product
Long que in the billing
Few varieties of products
Lack of payment system
Do you think mobile shopping is the best suitable option as compared to the retail store
shopping?
Yes
No
Less quantity of product problem can be resolved by giving additional facilities to all the users to
challenge the quantity of products and if found default then they get compensation.
Agree
Not agree
What facilities you are currently enjoying by purchasing all the products or services of an entity?
Quick payment services
Variety of payment option
Wide variety of products
Good policy of refund
Good labeling
Easy to carry product with good packaging
Do you find reliable product in the store in relation to all the products shown in the
advertisement made by the company in order to attract all kinds of customers?
Yes
No
What are effective methods of advertisements do you find best appropriate is given as below?
Online advertisement
Bills boards and hoardings
Pamphlets
Paraphrase This Document
Need a fresh take? Get an instant paraphrase of this document with our AI Paraphraser
TASK 2
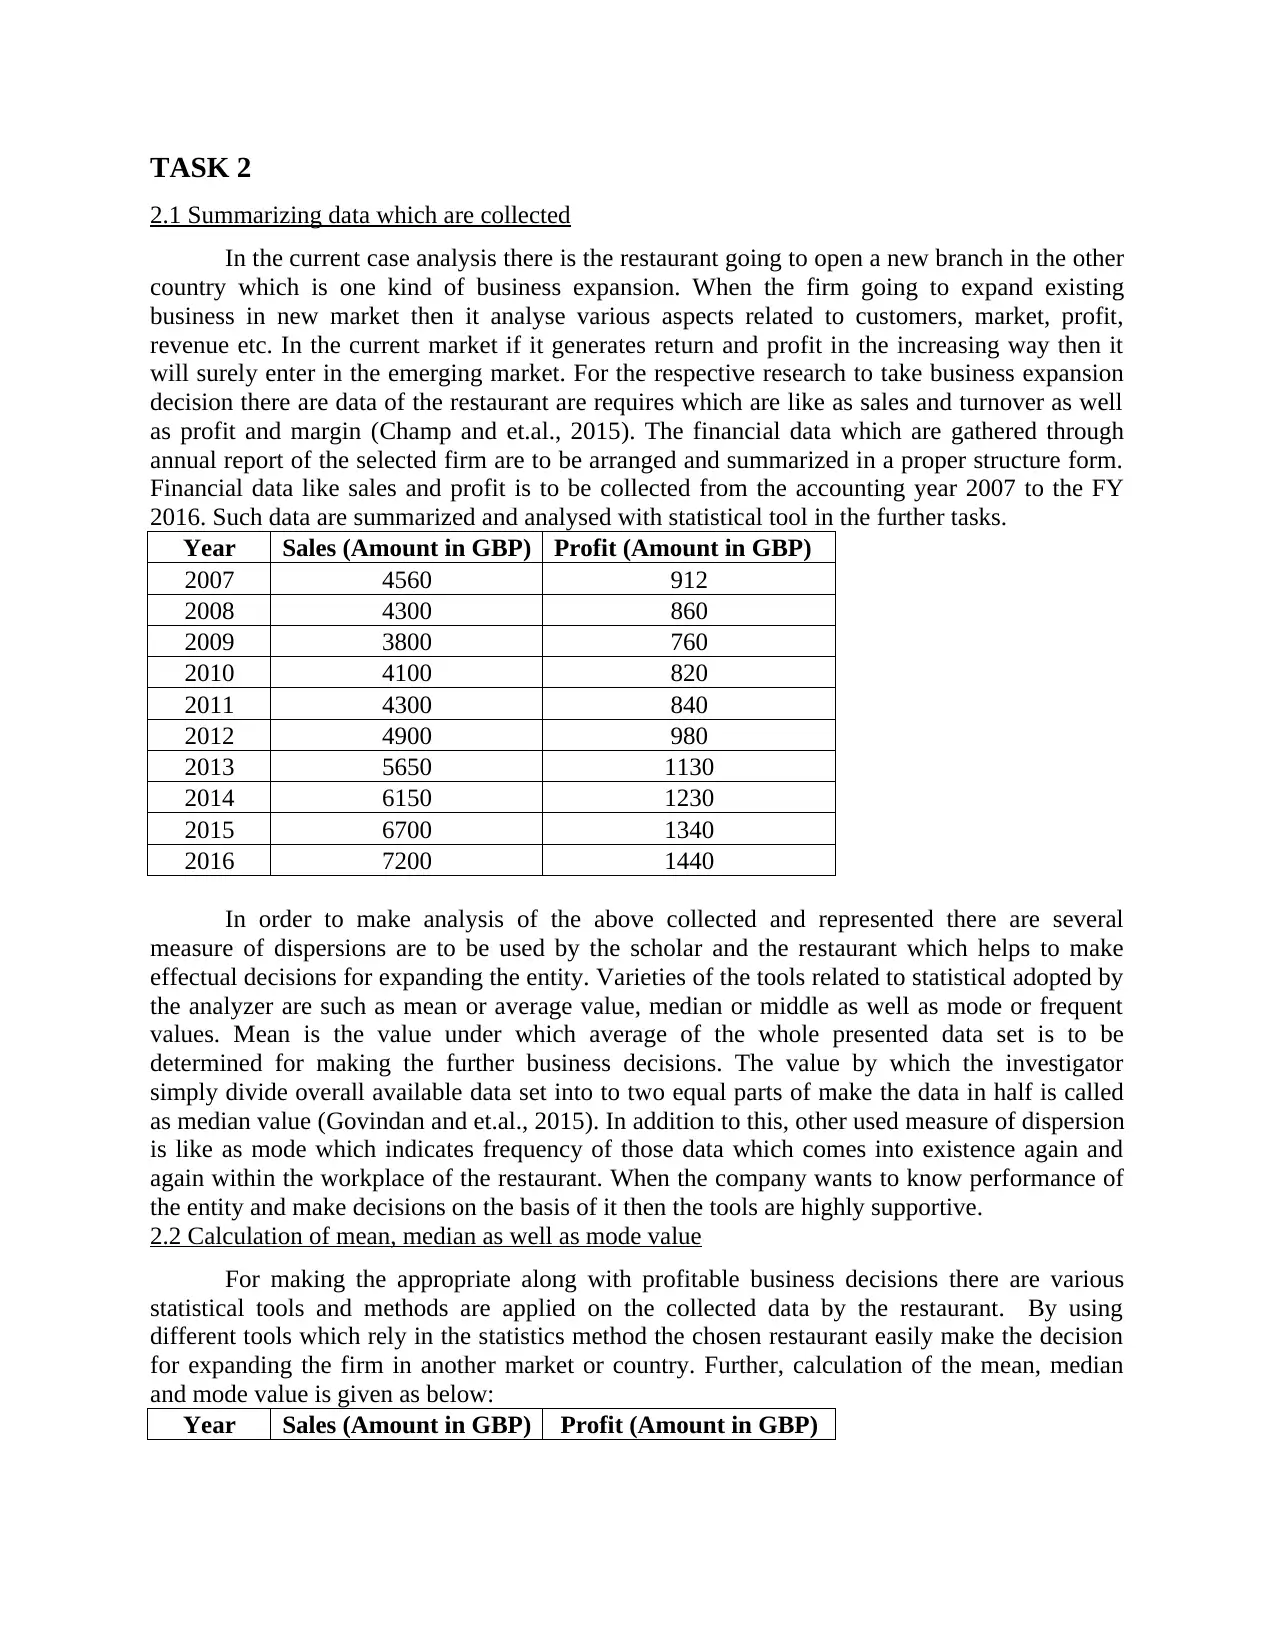
2.1 Summarizing data which are collected
In the current case analysis there is the restaurant going to open a new branch in the other
country which is one kind of business expansion. When the firm going to expand existing
business in new market then it analyse various aspects related to customers, market, profit,
revenue etc. In the current market if it generates return and profit in the increasing way then it
will surely enter in the emerging market. For the respective research to take business expansion
decision there are data of the restaurant are requires which are like as sales and turnover as well
as profit and margin (Champ and et.al., 2015). The financial data which are gathered through
annual report of the selected firm are to be arranged and summarized in a proper structure form.
Financial data like sales and profit is to be collected from the accounting year 2007 to the FY
2016. Such data are summarized and analysed with statistical tool in the further tasks.
Year Sales (Amount in GBP) Profit (Amount in GBP)
2007 4560 912
2008 4300 860
2009 3800 760
2010 4100 820
2011 4300 840
2012 4900 980
2013 5650 1130
2014 6150 1230
2015 6700 1340
2016 7200 1440
In order to make analysis of the above collected and represented there are several
measure of dispersions are to be used by the scholar and the restaurant which helps to make
effectual decisions for expanding the entity. Varieties of the tools related to statistical adopted by
the analyzer are such as mean or average value, median or middle as well as mode or frequent
values. Mean is the value under which average of the whole presented data set is to be
determined for making the further business decisions. The value by which the investigator
simply divide overall available data set into to two equal parts of make the data in half is called
as median value (Govindan and et.al., 2015). In addition to this, other used measure of dispersion
is like as mode which indicates frequency of those data which comes into existence again and
again within the workplace of the restaurant. When the company wants to know performance of
the entity and make decisions on the basis of it then the tools are highly supportive.
2.2 Calculation of mean, median as well as mode value
For making the appropriate along with profitable business decisions there are various
statistical tools and methods are applied on the collected data by the restaurant. By using
different tools which rely in the statistics method the chosen restaurant easily make the decision
for expanding the firm in another market or country. Further, calculation of the mean, median
and mode value is given as below:
Year Sales (Amount in GBP) Profit (Amount in GBP)
2007 4560 912
2008 4300 860
2009 3800 760
2010 4100 820
2011 4300 840
2012 4900 980
2013 5650 1130
2014 6150 1230
2015 6700 1340
2016 7200 1440
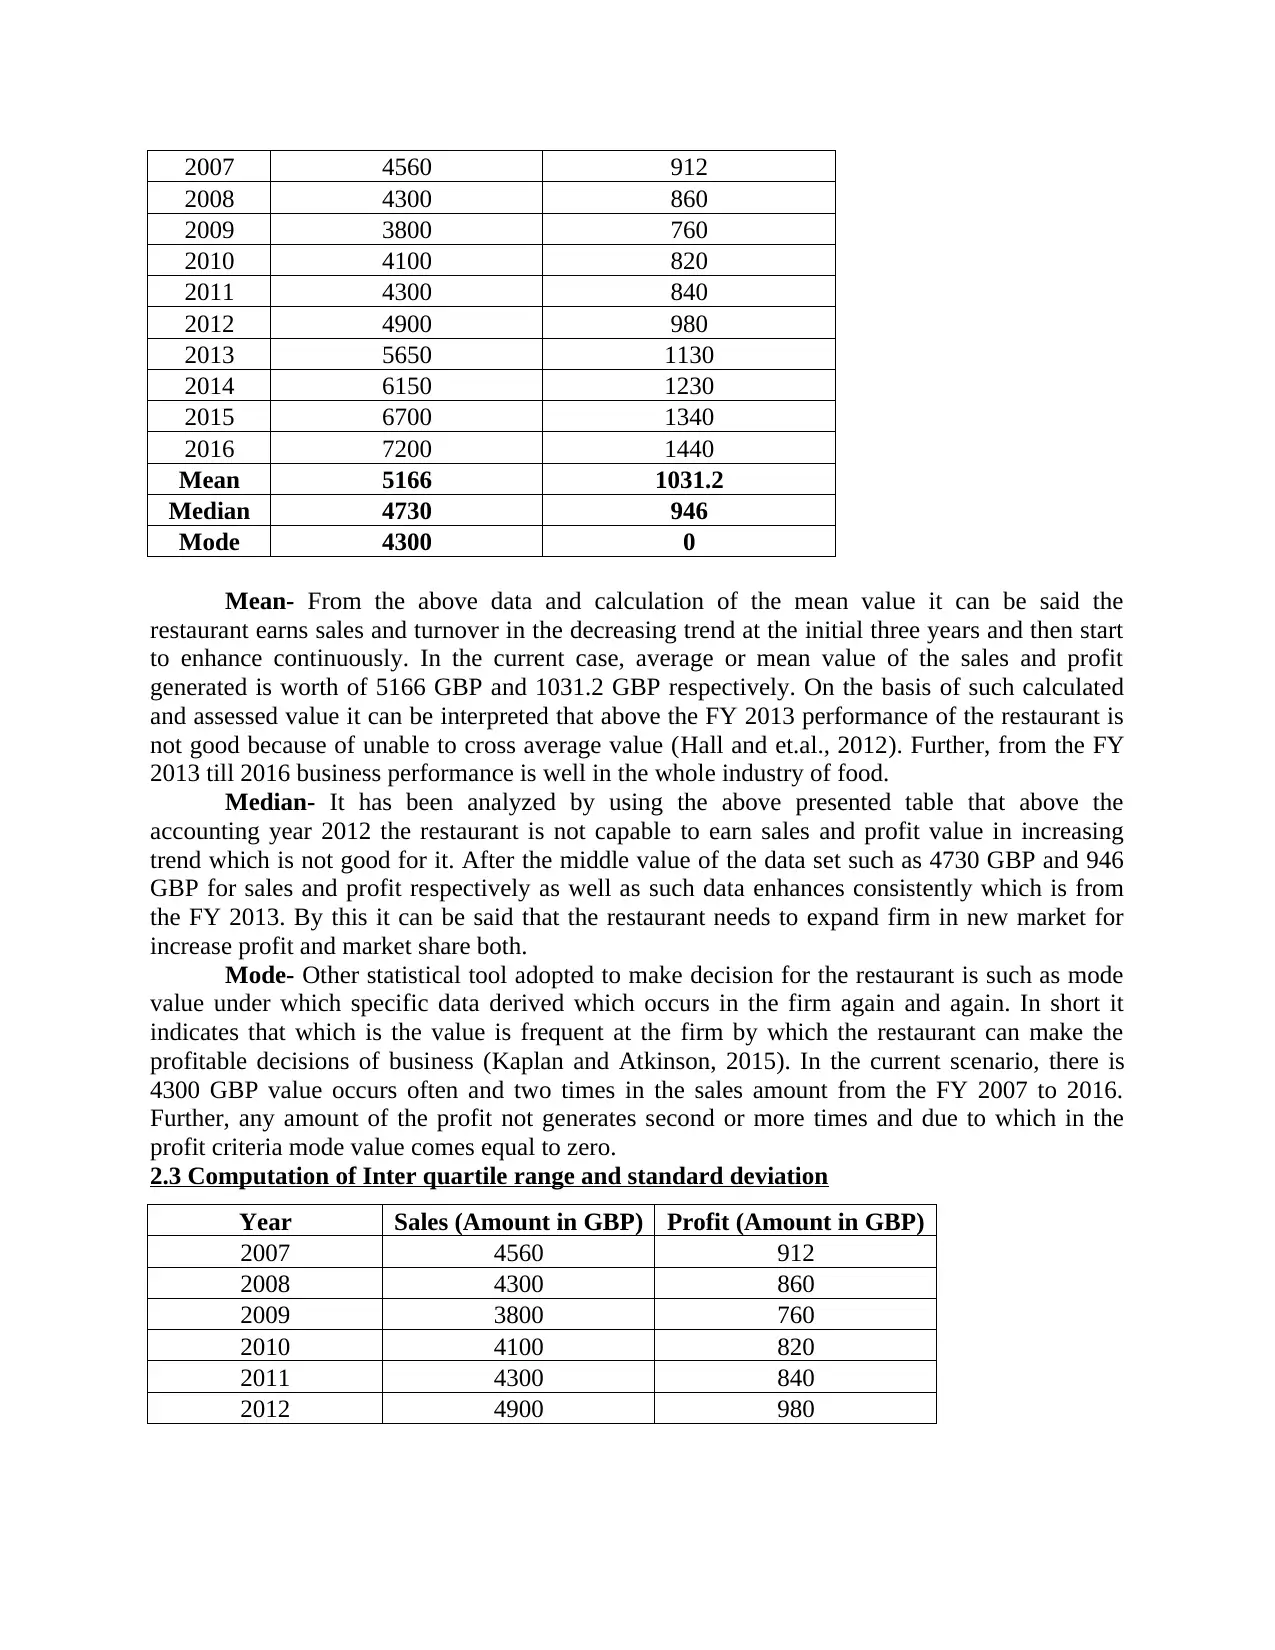
Mean 5166 1031.2
Median 4730 946
Mode 4300 0
Mean- From the above data and calculation of the mean value it can be said the
restaurant earns sales and turnover in the decreasing trend at the initial three years and then start
to enhance continuously. In the current case, average or mean value of the sales and profit
generated is worth of 5166 GBP and 1031.2 GBP respectively. On the basis of such calculated
and assessed value it can be interpreted that above the FY 2013 performance of the restaurant is
not good because of unable to cross average value (Hall and et.al., 2012). Further, from the FY
2013 till 2016 business performance is well in the whole industry of food.
Median- It has been analyzed by using the above presented table that above the
accounting year 2012 the restaurant is not capable to earn sales and profit value in increasing
trend which is not good for it. After the middle value of the data set such as 4730 GBP and 946
GBP for sales and profit respectively as well as such data enhances consistently which is from
the FY 2013. By this it can be said that the restaurant needs to expand firm in new market for
increase profit and market share both.
Mode- Other statistical tool adopted to make decision for the restaurant is such as mode
value under which specific data derived which occurs in the firm again and again. In short it
indicates that which is the value is frequent at the firm by which the restaurant can make the
profitable decisions of business (Kaplan and Atkinson, 2015). In the current scenario, there is
4300 GBP value occurs often and two times in the sales amount from the FY 2007 to 2016.
Further, any amount of the profit not generates second or more times and due to which in the
profit criteria mode value comes equal to zero.
2.3 Computation of Inter quartile range and standard deviation
Year Sales (Amount in GBP) Profit (Amount in GBP)
2007 4560 912
2008 4300 860
2009 3800 760
2010 4100 820
2011 4300 840
2012 4900 980
2008 4300 860
2009 3800 760
2010 4100 820
2011 4300 840
2012 4900 980
2013 5650 1130
2014 6150 1230
2015 6700 1340
2016 7200 1440
Mean 5166 1031.2
Median 4730 946
Mode 4300 0
Mean- From the above data and calculation of the mean value it can be said the
restaurant earns sales and turnover in the decreasing trend at the initial three years and then start
to enhance continuously. In the current case, average or mean value of the sales and profit
generated is worth of 5166 GBP and 1031.2 GBP respectively. On the basis of such calculated
and assessed value it can be interpreted that above the FY 2013 performance of the restaurant is
not good because of unable to cross average value (Hall and et.al., 2012). Further, from the FY
2013 till 2016 business performance is well in the whole industry of food.
Median- It has been analyzed by using the above presented table that above the
accounting year 2012 the restaurant is not capable to earn sales and profit value in increasing
trend which is not good for it. After the middle value of the data set such as 4730 GBP and 946
GBP for sales and profit respectively as well as such data enhances consistently which is from
the FY 2013. By this it can be said that the restaurant needs to expand firm in new market for
increase profit and market share both.
Mode- Other statistical tool adopted to make decision for the restaurant is such as mode
value under which specific data derived which occurs in the firm again and again. In short it
indicates that which is the value is frequent at the firm by which the restaurant can make the
profitable decisions of business (Kaplan and Atkinson, 2015). In the current scenario, there is
4300 GBP value occurs often and two times in the sales amount from the FY 2007 to 2016.
Further, any amount of the profit not generates second or more times and due to which in the
profit criteria mode value comes equal to zero.
2.3 Computation of Inter quartile range and standard deviation
Year Sales (Amount in GBP) Profit (Amount in GBP)
2007 4560 912
2008 4300 860
2009 3800 760
2010 4100 820
2011 4300 840
2012 4900 980
⊘ This is a preview!⊘
Do you want full access?
Subscribe today to unlock all pages.
Trusted by 1+ million students worldwide
1 out of 17
Related Documents


Your All-in-One AI-Powered Toolkit for Academic Success.
+13062052269
info@desklib.com
Available 24*7 on WhatsApp / Email
![[object Object]](/_next/static/media/star-bottom.7253800d.svg)
Unlock your academic potential
Copyright © 2020–2026 A2Z Services. All Rights Reserved. Developed and managed by ZUCOL.