Statistical Data Analysis and Decision Making: Assessment Report
VerifiedAdded on 2023/03/17
|18
|4668
|28
Report
AI Summary
This report analyzes customer data from a mall using statistical methods to provide insights for decision-making. The study utilizes secondary data from Kaggle, focusing on customer demographics, income, spending scores, and satisfaction levels. The analysis includes frequency analysis to understand the distribution of variables like gender and satisfaction levels, descriptive statistics to summarize key features of the data, and graphical analysis to visualize trends. Furthermore, statistical validation is conducted to assess data reliability using Cronbach’s alpha. Correlation and regression analyses are employed to explore relationships between variables, such as age, income, and spending scores. The report discusses the findings, highlighting the importance of customer satisfaction and providing actionable insights for business improvement. The methodology includes frequency analysis, descriptive statistics, statistical validation, correlation analysis, and regression analysis to gain a comprehensive understanding of the customer data and derive meaningful conclusions.
DECISION MAKING USING STATISTICAL DATA
1
ASSESSMENT ITEM THREE: DECISION MAKING USING STATISTICAL DATA
Name of the Student:
Name of the Institution:
1
ASSESSMENT ITEM THREE: DECISION MAKING USING STATISTICAL DATA
Name of the Student:
Name of the Institution:
Paraphrase This Document
Need a fresh take? Get an instant paraphrase of this document with our AI Paraphraser
DECISION MAKING USING STATISTICAL DATA
2
Contents
Introduction......................................................................................................................................3
Parameters and the sample population............................................................................................3
Collected data..................................................................................................................................3
Results..............................................................................................................................................3
Frequency Analysis......................................................................................................................3
Descriptive Statistics....................................................................................................................4
Graphical Analysis.......................................................................................................................4
Statistical Validation- Reliability Test.........................................................................................5
Correlation Analysis....................................................................................................................5
Regression Analysis.....................................................................................................................6
Results discussion............................................................................................................................7
Conclusions......................................................................................................................................7
References........................................................................................................................................7
Introduction
DECISION MAKING USING STATISTICAL DATA
3
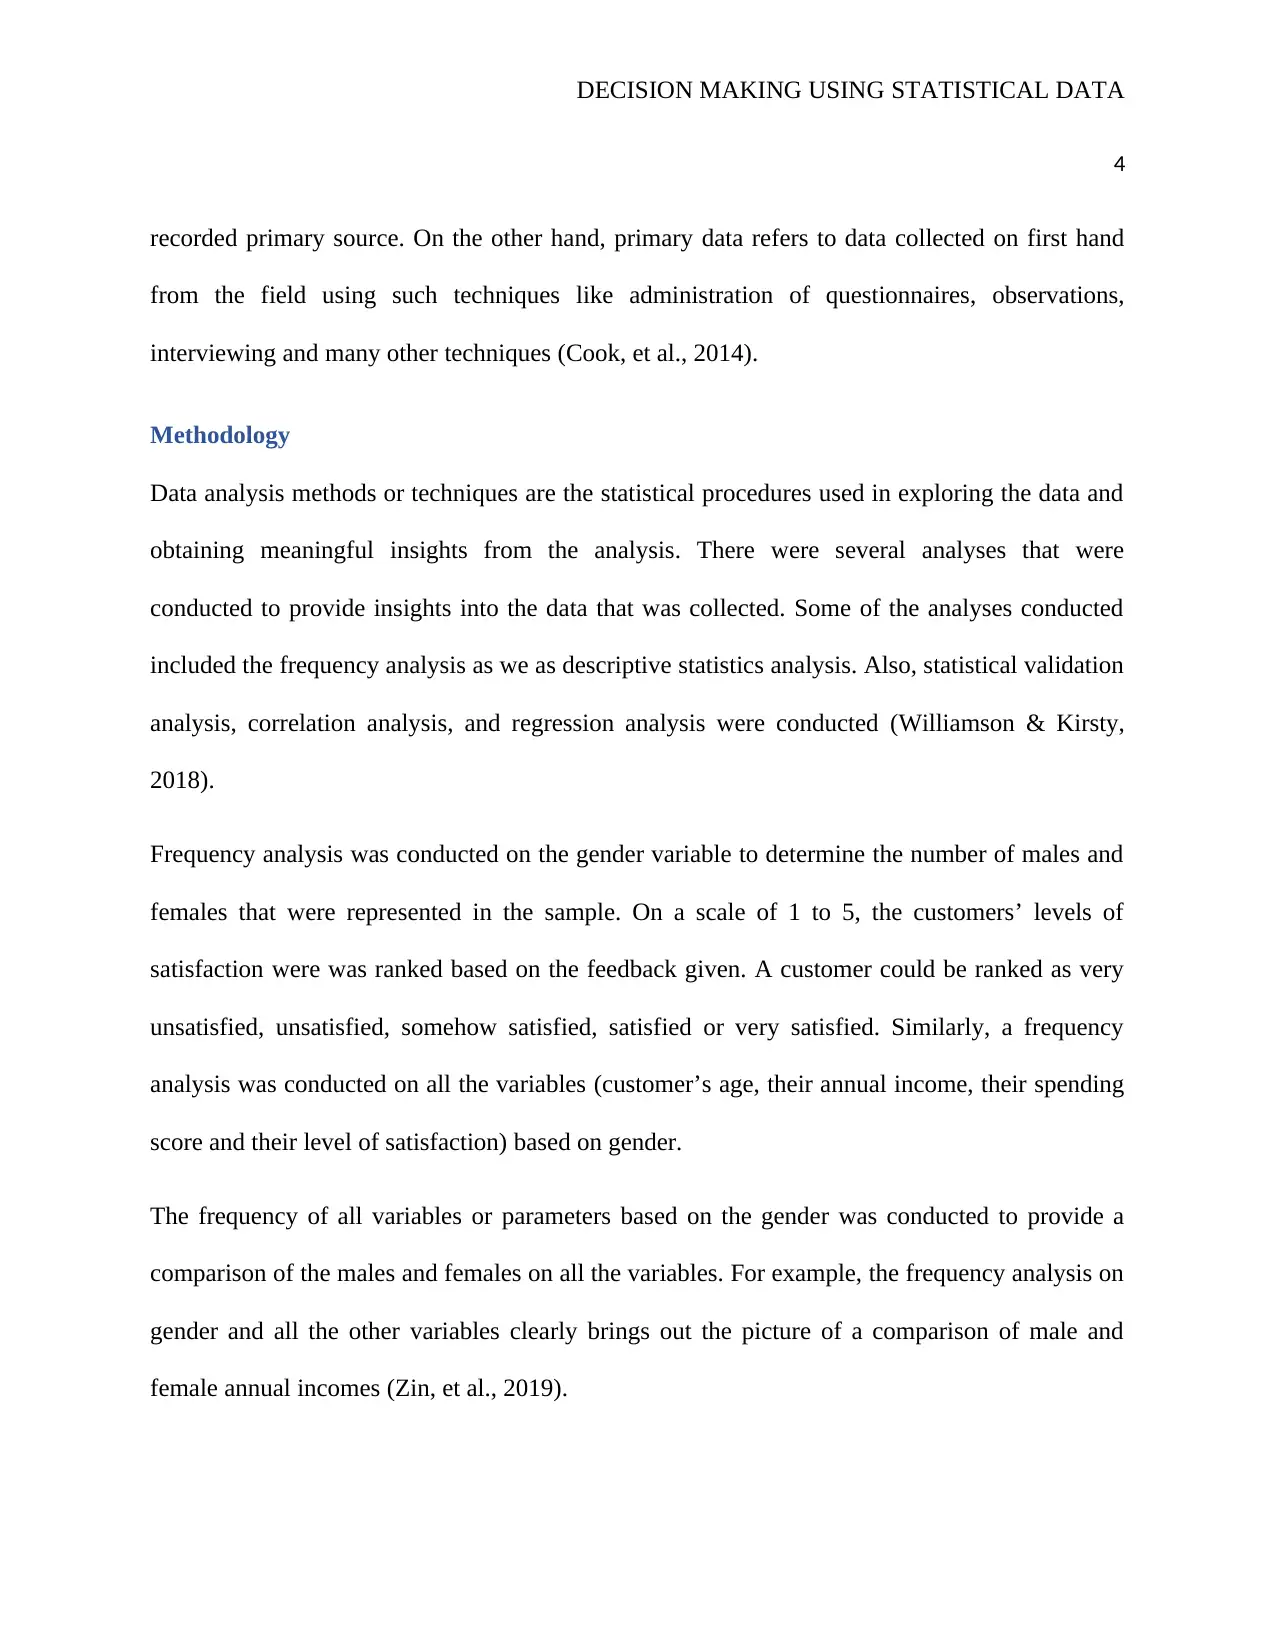
Customer satisfaction is an essential element in the sustainability of a business. The performance
of any business is dependent on the level of satisfaction of its customers. Depending on the
degree of satisfaction enjoyed by a customer, a number of factors are determined. These factors
include the level of spending of the customer, the loyalty of the customer, the possibility of the
customer recommending the products or services and the nature of review that the customer
gives (whether positive or negative) (Agung, et al., 2014).
The level of satisfaction of a customer can be measured by several factors. The report
investigates the degree of satisfaction of customers in a mall. Variables under consideration
include customer’s age, their gender, their annual income, the spending score and how satisfied
they are. Spending score refers to the value of money that the customers received for the goods
and or services in the mall. The level of satisfaction represents the level of contentment of the
customers with the service delivery and customer handling. The levels of satisfaction that the
customers were to choose from were divided into five possibilities. They include 1-Very
unsatisfied, 2- unsatisfied, 3- somehow satisfied, 4- satisfied and 5- very satisfied.
The primary objective of this report is to analyze data collected from a mall and to provide
insights into this data. To achieve this, a number of analyses were conducted on the data
collected. These analyses include The frequency analysis, descriptive statistics analysis,
statistical validation analysis, analysis of the correlation between data sets, and regression
analysis (Kyosuke & Takashi, 2011).
Secondary data collection technique was applied. This technique was used because the data
collected was secondary in nature. Secondary data refers to data that is collected from a pre-
3
Customer satisfaction is an essential element in the sustainability of a business. The performance
of any business is dependent on the level of satisfaction of its customers. Depending on the
degree of satisfaction enjoyed by a customer, a number of factors are determined. These factors
include the level of spending of the customer, the loyalty of the customer, the possibility of the
customer recommending the products or services and the nature of review that the customer
gives (whether positive or negative) (Agung, et al., 2014).
The level of satisfaction of a customer can be measured by several factors. The report
investigates the degree of satisfaction of customers in a mall. Variables under consideration
include customer’s age, their gender, their annual income, the spending score and how satisfied
they are. Spending score refers to the value of money that the customers received for the goods
and or services in the mall. The level of satisfaction represents the level of contentment of the
customers with the service delivery and customer handling. The levels of satisfaction that the
customers were to choose from were divided into five possibilities. They include 1-Very
unsatisfied, 2- unsatisfied, 3- somehow satisfied, 4- satisfied and 5- very satisfied.
The primary objective of this report is to analyze data collected from a mall and to provide
insights into this data. To achieve this, a number of analyses were conducted on the data
collected. These analyses include The frequency analysis, descriptive statistics analysis,
statistical validation analysis, analysis of the correlation between data sets, and regression
analysis (Kyosuke & Takashi, 2011).
Secondary data collection technique was applied. This technique was used because the data
collected was secondary in nature. Secondary data refers to data that is collected from a pre-
⊘ This is a preview!⊘
Do you want full access?
Subscribe today to unlock all pages.
Trusted by 1+ million students worldwide
DECISION MAKING USING STATISTICAL DATA
4
recorded primary source. On the other hand, primary data refers to data collected on first hand
from the field using such techniques like administration of questionnaires, observations,
interviewing and many other techniques (Cook, et al., 2014).
Methodology
Data analysis methods or techniques are the statistical procedures used in exploring the data and
obtaining meaningful insights from the analysis. There were several analyses that were
conducted to provide insights into the data that was collected. Some of the analyses conducted
included the frequency analysis as we as descriptive statistics analysis. Also, statistical validation
analysis, correlation analysis, and regression analysis were conducted (Williamson & Kirsty,
2018).
Frequency analysis was conducted on the gender variable to determine the number of males and
females that were represented in the sample. On a scale of 1 to 5, the customers’ levels of
satisfaction were was ranked based on the feedback given. A customer could be ranked as very
unsatisfied, unsatisfied, somehow satisfied, satisfied or very satisfied. Similarly, a frequency
analysis was conducted on all the variables (customer’s age, their annual income, their spending
score and their level of satisfaction) based on gender.
The frequency of all variables or parameters based on the gender was conducted to provide a
comparison of the males and females on all the variables. For example, the frequency analysis on
gender and all the other variables clearly brings out the picture of a comparison of male and
female annual incomes (Zin, et al., 2019).
Paraphrase This Document
Need a fresh take? Get an instant paraphrase of this document with our AI Paraphraser
DECISION MAKING USING STATISTICAL DATA
5
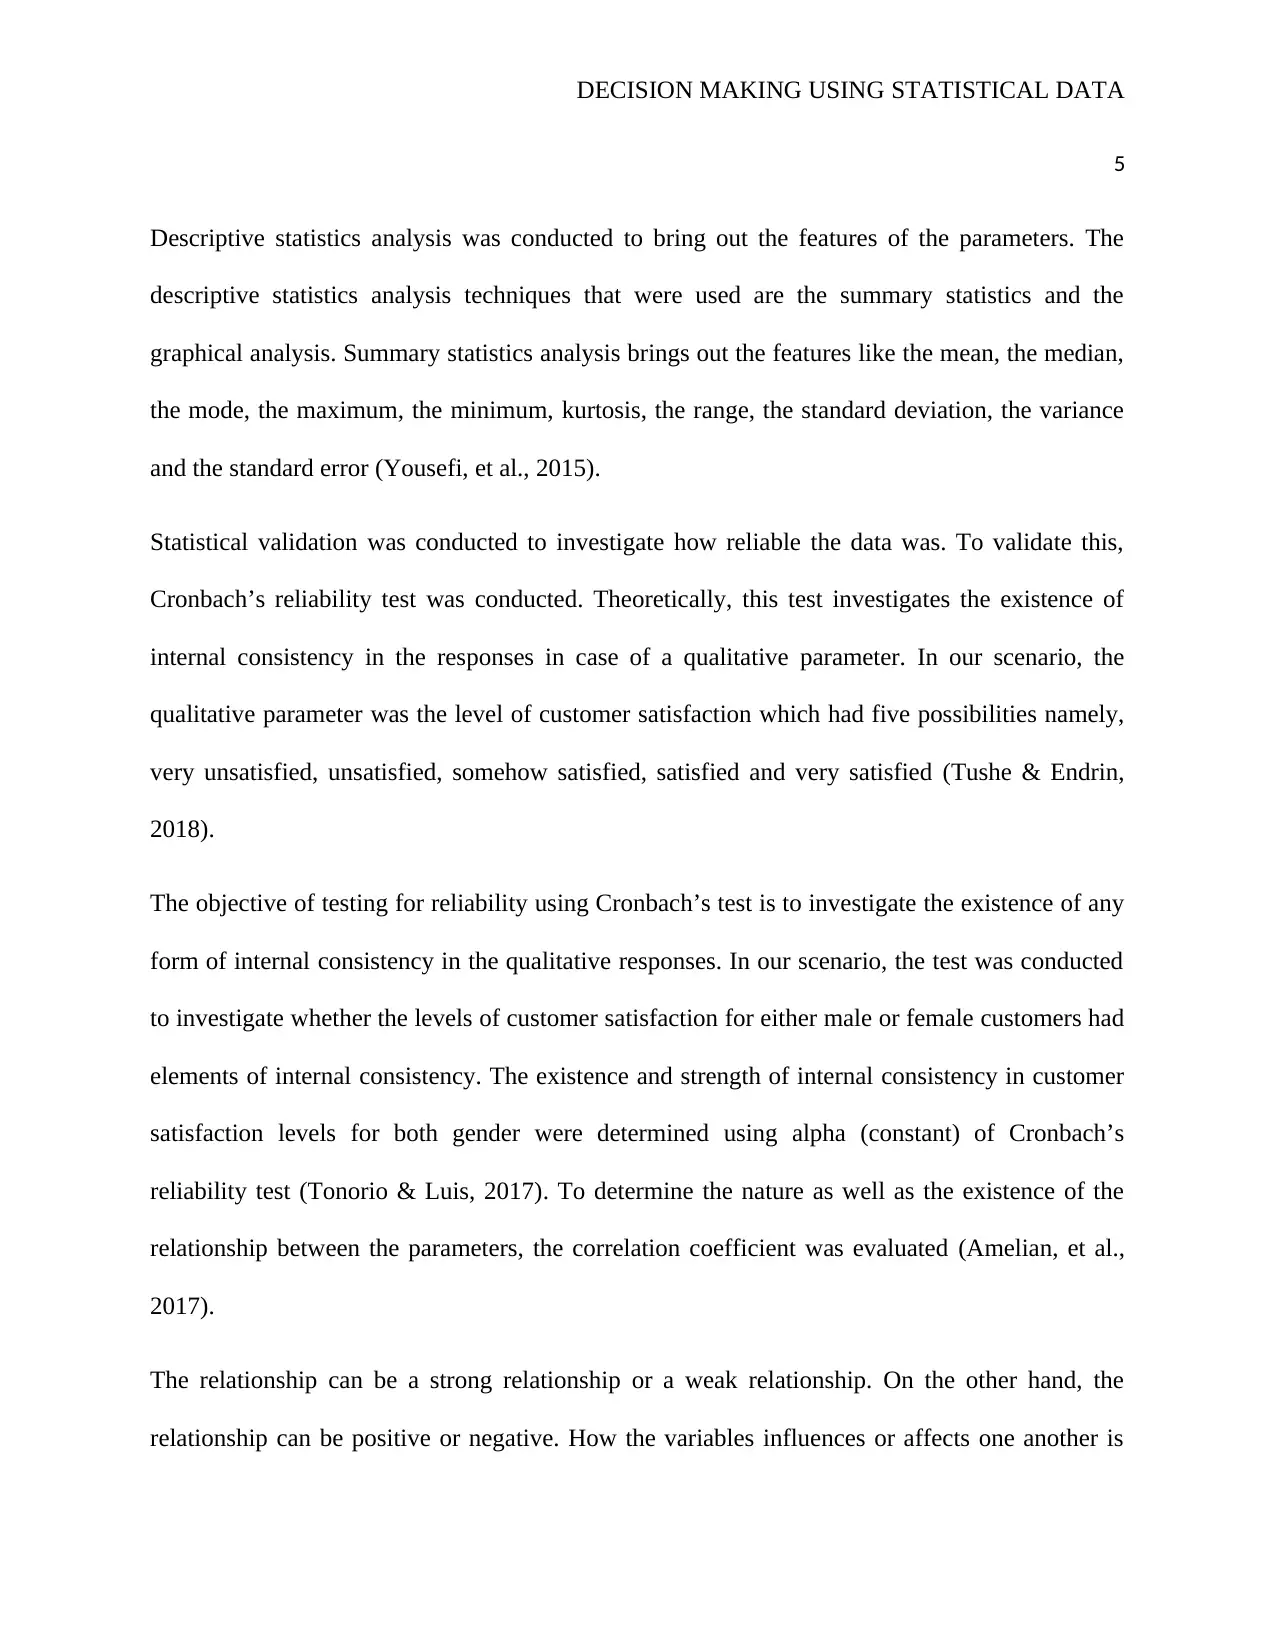
Descriptive statistics analysis was conducted to bring out the features of the parameters. The
descriptive statistics analysis techniques that were used are the summary statistics and the
graphical analysis. Summary statistics analysis brings out the features like the mean, the median,
the mode, the maximum, the minimum, kurtosis, the range, the standard deviation, the variance
and the standard error (Yousefi, et al., 2015).
Statistical validation was conducted to investigate how reliable the data was. To validate this,
Cronbach’s reliability test was conducted. Theoretically, this test investigates the existence of
internal consistency in the responses in case of a qualitative parameter. In our scenario, the
qualitative parameter was the level of customer satisfaction which had five possibilities namely,
very unsatisfied, unsatisfied, somehow satisfied, satisfied and very satisfied (Tushe & Endrin,
2018).
The objective of testing for reliability using Cronbach’s test is to investigate the existence of any
form of internal consistency in the qualitative responses. In our scenario, the test was conducted
to investigate whether the levels of customer satisfaction for either male or female customers had
elements of internal consistency. The existence and strength of internal consistency in customer
satisfaction levels for both gender were determined using alpha (constant) of Cronbach’s
reliability test (Tonorio & Luis, 2017). To determine the nature as well as the existence of the
relationship between the parameters, the correlation coefficient was evaluated (Amelian, et al.,
2017).
The relationship can be a strong relationship or a weak relationship. On the other hand, the
relationship can be positive or negative. How the variables influences or affects one another is
5
Descriptive statistics analysis was conducted to bring out the features of the parameters. The
descriptive statistics analysis techniques that were used are the summary statistics and the
graphical analysis. Summary statistics analysis brings out the features like the mean, the median,
the mode, the maximum, the minimum, kurtosis, the range, the standard deviation, the variance
and the standard error (Yousefi, et al., 2015).
Statistical validation was conducted to investigate how reliable the data was. To validate this,
Cronbach’s reliability test was conducted. Theoretically, this test investigates the existence of
internal consistency in the responses in case of a qualitative parameter. In our scenario, the
qualitative parameter was the level of customer satisfaction which had five possibilities namely,
very unsatisfied, unsatisfied, somehow satisfied, satisfied and very satisfied (Tushe & Endrin,
2018).
The objective of testing for reliability using Cronbach’s test is to investigate the existence of any
form of internal consistency in the qualitative responses. In our scenario, the test was conducted
to investigate whether the levels of customer satisfaction for either male or female customers had
elements of internal consistency. The existence and strength of internal consistency in customer
satisfaction levels for both gender were determined using alpha (constant) of Cronbach’s
reliability test (Tonorio & Luis, 2017). To determine the nature as well as the existence of the
relationship between the parameters, the correlation coefficient was evaluated (Amelian, et al.,
2017).
The relationship can be a strong relationship or a weak relationship. On the other hand, the
relationship can be positive or negative. How the variables influences or affects one another is
DECISION MAKING USING STATISTICAL DATA
6
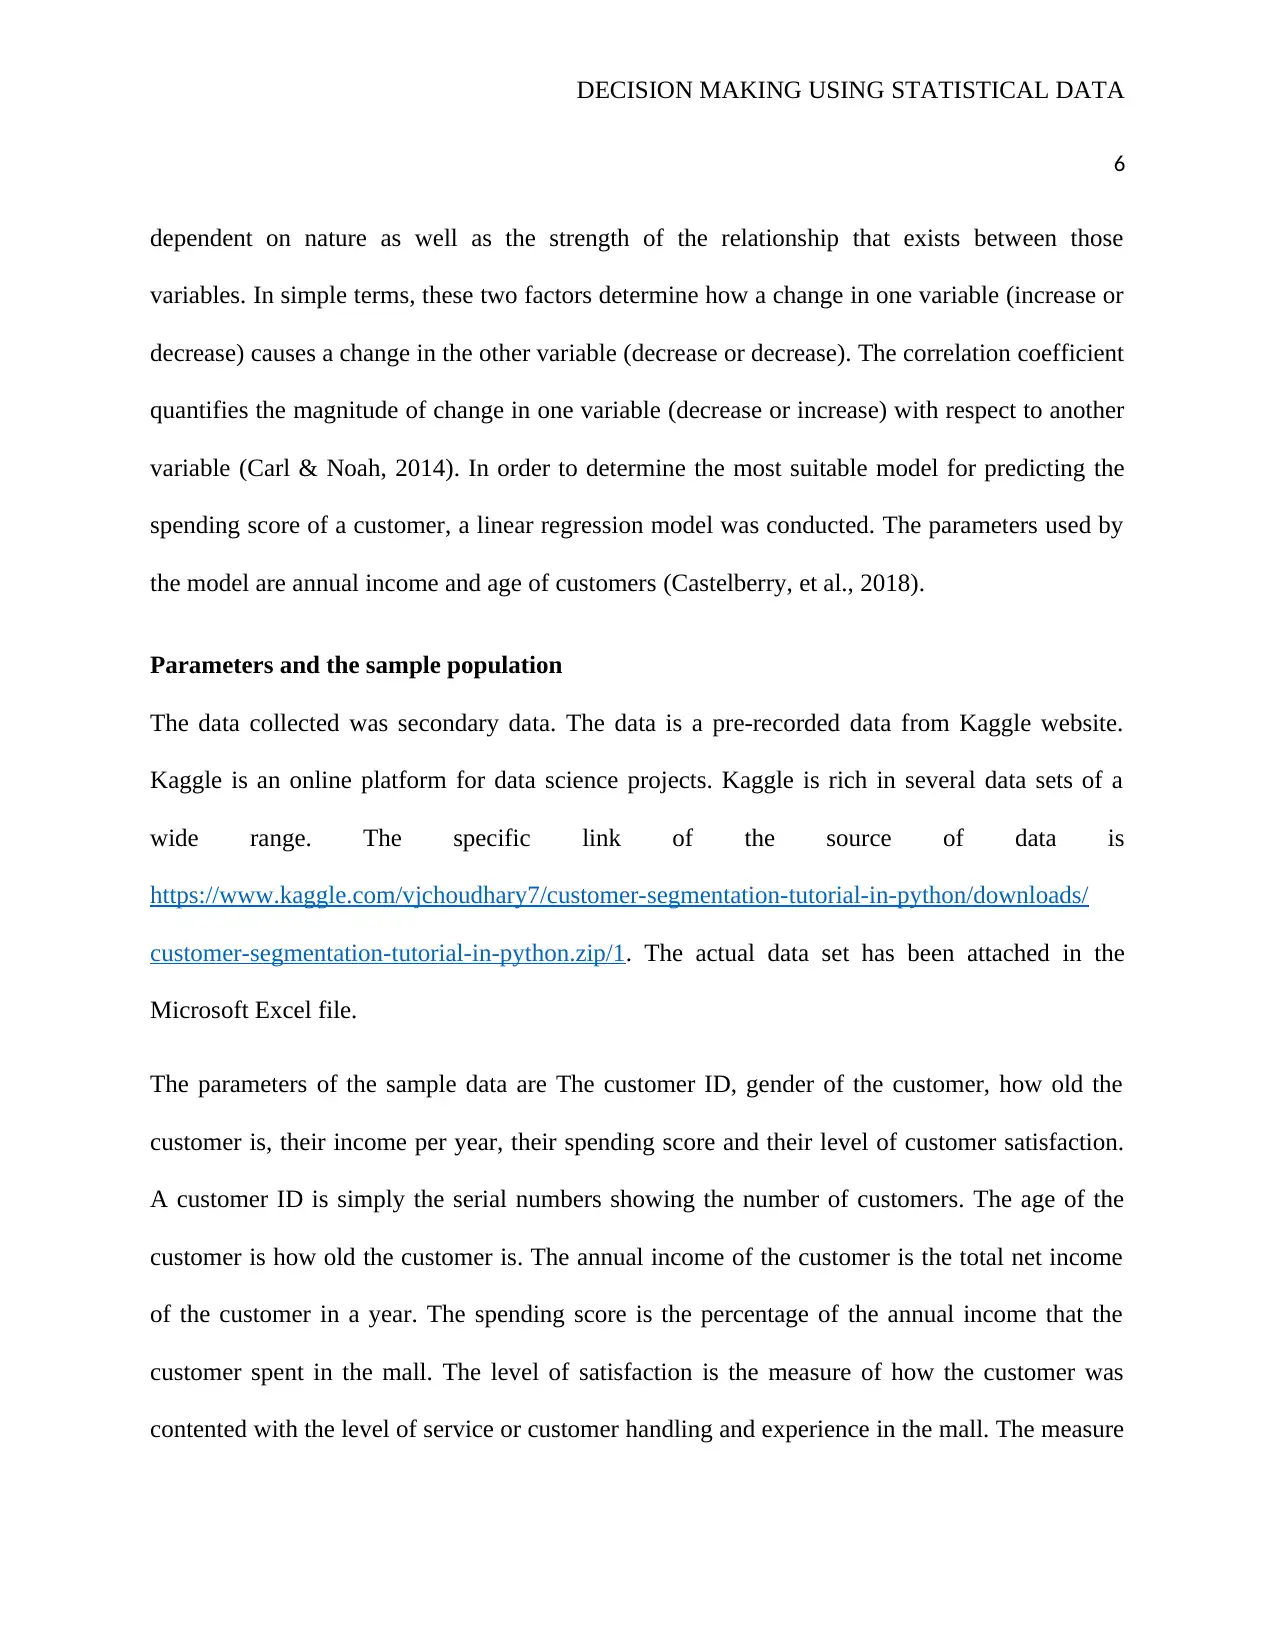
dependent on nature as well as the strength of the relationship that exists between those
variables. In simple terms, these two factors determine how a change in one variable (increase or
decrease) causes a change in the other variable (decrease or decrease). The correlation coefficient
quantifies the magnitude of change in one variable (decrease or increase) with respect to another
variable (Carl & Noah, 2014). In order to determine the most suitable model for predicting the
spending score of a customer, a linear regression model was conducted. The parameters used by
the model are annual income and age of customers (Castelberry, et al., 2018).
Parameters and the sample population
The data collected was secondary data. The data is a pre-recorded data from Kaggle website.
Kaggle is an online platform for data science projects. Kaggle is rich in several data sets of a
wide range. The specific link of the source of data is
https://www.kaggle.com/vjchoudhary7/customer-segmentation-tutorial-in-python/downloads/
customer-segmentation-tutorial-in-python.zip/1. The actual data set has been attached in the
Microsoft Excel file.
The parameters of the sample data are The customer ID, gender of the customer, how old the
customer is, their income per year, their spending score and their level of customer satisfaction.
A customer ID is simply the serial numbers showing the number of customers. The age of the
customer is how old the customer is. The annual income of the customer is the total net income
of the customer in a year. The spending score is the percentage of the annual income that the
customer spent in the mall. The level of satisfaction is the measure of how the customer was
contented with the level of service or customer handling and experience in the mall. The measure
6
dependent on nature as well as the strength of the relationship that exists between those
variables. In simple terms, these two factors determine how a change in one variable (increase or
decrease) causes a change in the other variable (decrease or decrease). The correlation coefficient
quantifies the magnitude of change in one variable (decrease or increase) with respect to another
variable (Carl & Noah, 2014). In order to determine the most suitable model for predicting the
spending score of a customer, a linear regression model was conducted. The parameters used by
the model are annual income and age of customers (Castelberry, et al., 2018).
Parameters and the sample population
The data collected was secondary data. The data is a pre-recorded data from Kaggle website.
Kaggle is an online platform for data science projects. Kaggle is rich in several data sets of a
wide range. The specific link of the source of data is
https://www.kaggle.com/vjchoudhary7/customer-segmentation-tutorial-in-python/downloads/
customer-segmentation-tutorial-in-python.zip/1. The actual data set has been attached in the
Microsoft Excel file.
The parameters of the sample data are The customer ID, gender of the customer, how old the
customer is, their income per year, their spending score and their level of customer satisfaction.
A customer ID is simply the serial numbers showing the number of customers. The age of the
customer is how old the customer is. The annual income of the customer is the total net income
of the customer in a year. The spending score is the percentage of the annual income that the
customer spent in the mall. The level of satisfaction is the measure of how the customer was
contented with the level of service or customer handling and experience in the mall. The measure
⊘ This is a preview!⊘
Do you want full access?
Subscribe today to unlock all pages.
Trusted by 1+ million students worldwide
DECISION MAKING USING STATISTICAL DATA
7
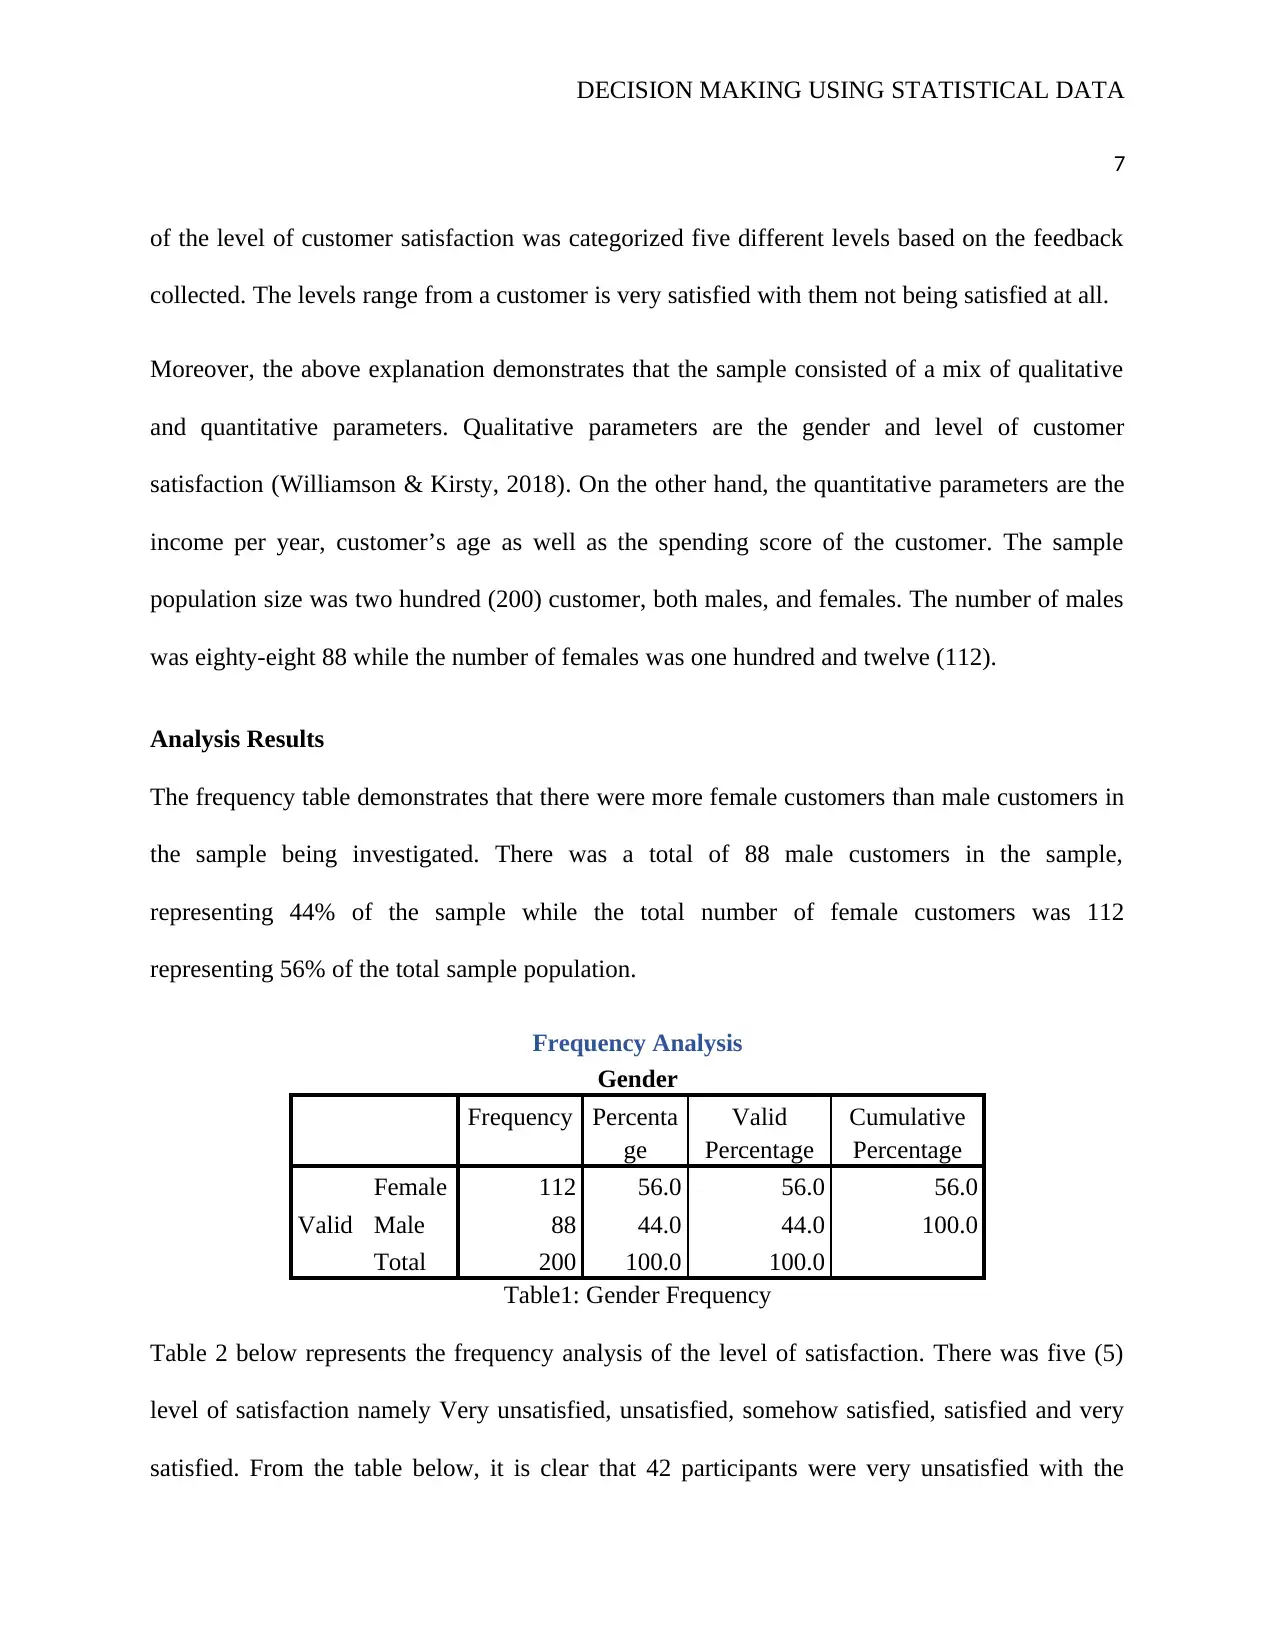
of the level of customer satisfaction was categorized five different levels based on the feedback
collected. The levels range from a customer is very satisfied with them not being satisfied at all.
Moreover, the above explanation demonstrates that the sample consisted of a mix of qualitative
and quantitative parameters. Qualitative parameters are the gender and level of customer
satisfaction (Williamson & Kirsty, 2018). On the other hand, the quantitative parameters are the
income per year, customer’s age as well as the spending score of the customer. The sample
population size was two hundred (200) customer, both males, and females. The number of males
was eighty-eight 88 while the number of females was one hundred and twelve (112).
Analysis Results
The frequency table demonstrates that there were more female customers than male customers in
the sample being investigated. There was a total of 88 male customers in the sample,
representing 44% of the sample while the total number of female customers was 112
representing 56% of the total sample population.
Frequency Analysis
Gender
Frequency Percenta
ge
Valid
Percentage
Cumulative
Percentage
Valid
Female 112 56.0 56.0 56.0
Male 88 44.0 44.0 100.0
Total 200 100.0 100.0
Table1: Gender Frequency
Table 2 below represents the frequency analysis of the level of satisfaction. There was five (5)
level of satisfaction namely Very unsatisfied, unsatisfied, somehow satisfied, satisfied and very
satisfied. From the table below, it is clear that 42 participants were very unsatisfied with the
7
of the level of customer satisfaction was categorized five different levels based on the feedback
collected. The levels range from a customer is very satisfied with them not being satisfied at all.
Moreover, the above explanation demonstrates that the sample consisted of a mix of qualitative
and quantitative parameters. Qualitative parameters are the gender and level of customer
satisfaction (Williamson & Kirsty, 2018). On the other hand, the quantitative parameters are the
income per year, customer’s age as well as the spending score of the customer. The sample
population size was two hundred (200) customer, both males, and females. The number of males
was eighty-eight 88 while the number of females was one hundred and twelve (112).
Analysis Results
The frequency table demonstrates that there were more female customers than male customers in
the sample being investigated. There was a total of 88 male customers in the sample,
representing 44% of the sample while the total number of female customers was 112
representing 56% of the total sample population.
Frequency Analysis
Gender
Frequency Percenta
ge
Valid
Percentage
Cumulative
Percentage
Valid
Female 112 56.0 56.0 56.0
Male 88 44.0 44.0 100.0
Total 200 100.0 100.0
Table1: Gender Frequency
Table 2 below represents the frequency analysis of the level of satisfaction. There was five (5)
level of satisfaction namely Very unsatisfied, unsatisfied, somehow satisfied, satisfied and very
satisfied. From the table below, it is clear that 42 participants were very unsatisfied with the
Paraphrase This Document
Need a fresh take? Get an instant paraphrase of this document with our AI Paraphraser
DECISION MAKING USING STATISTICAL DATA
8
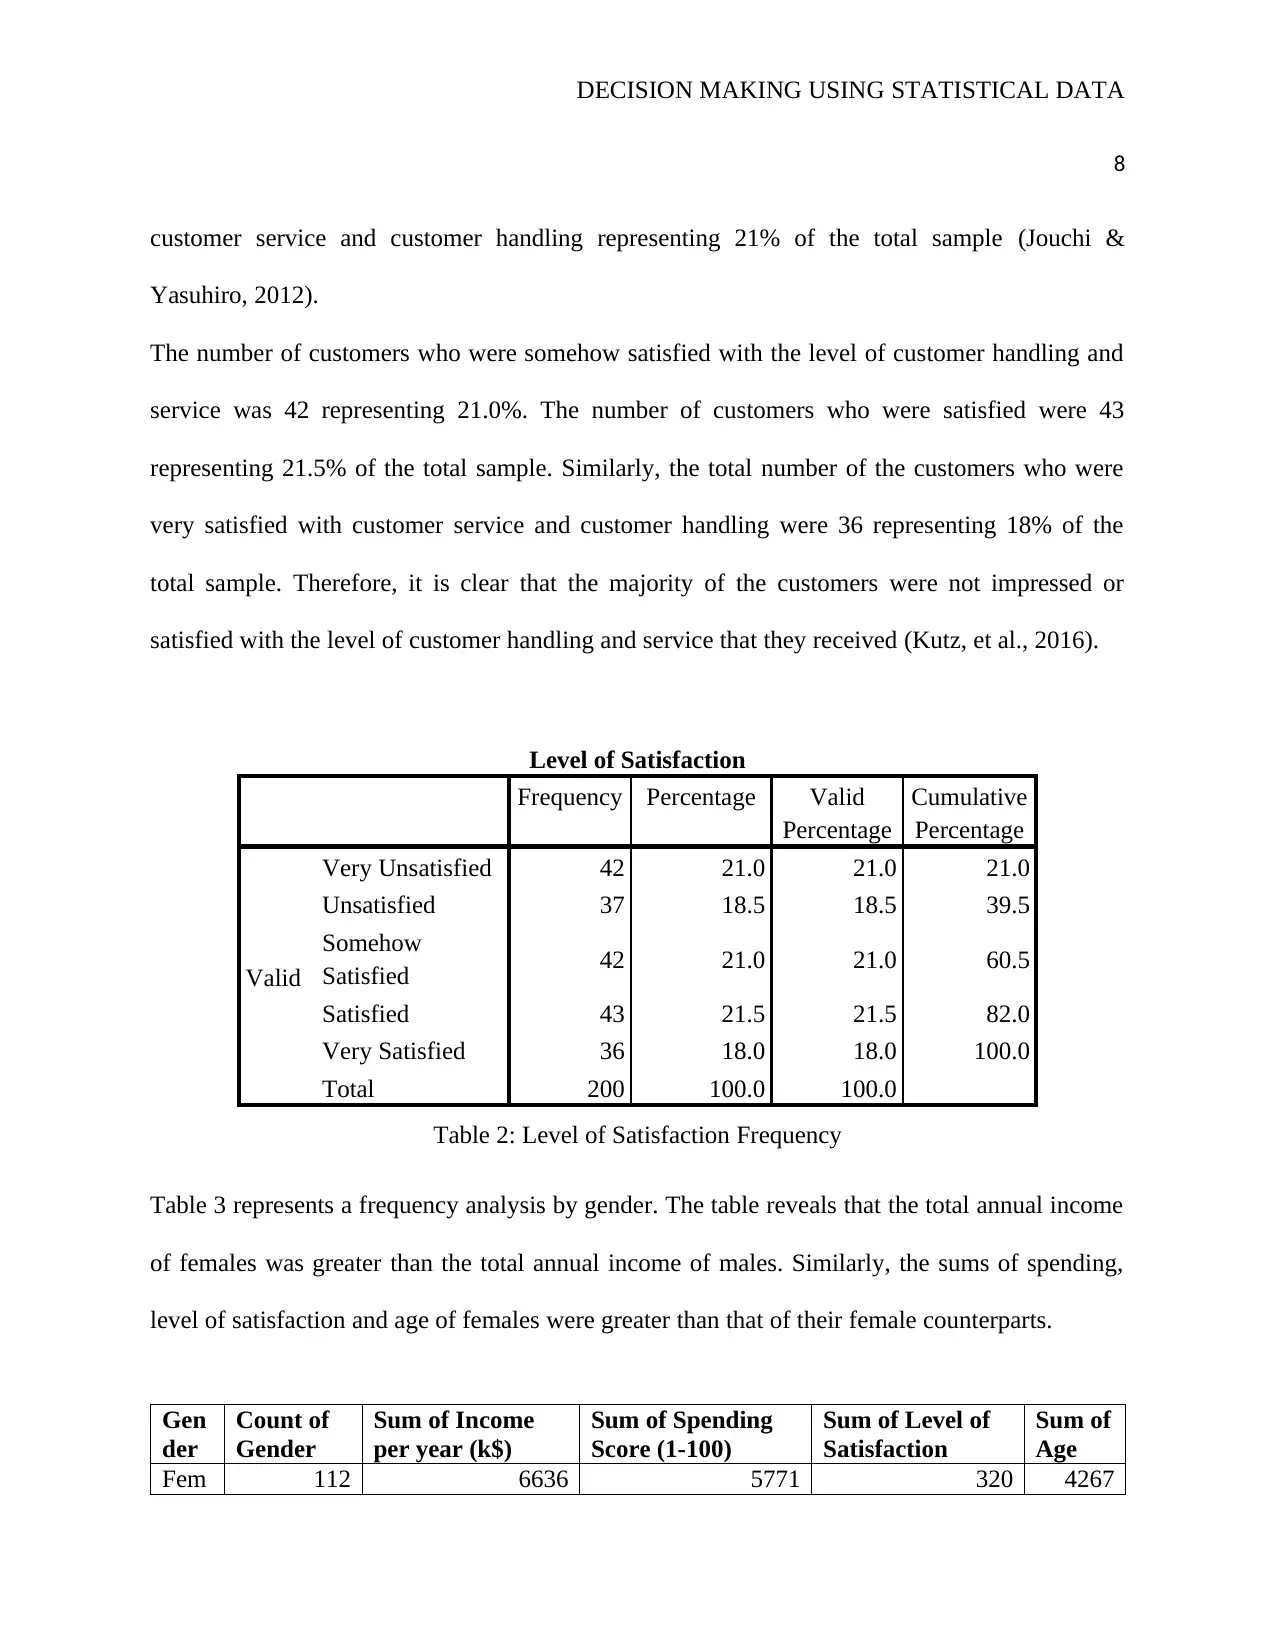
customer service and customer handling representing 21% of the total sample (Jouchi &
Yasuhiro, 2012).
The number of customers who were somehow satisfied with the level of customer handling and
service was 42 representing 21.0%. The number of customers who were satisfied were 43
representing 21.5% of the total sample. Similarly, the total number of the customers who were
very satisfied with customer service and customer handling were 36 representing 18% of the
total sample. Therefore, it is clear that the majority of the customers were not impressed or
satisfied with the level of customer handling and service that they received (Kutz, et al., 2016).
Level of Satisfaction
Frequency Percentage Valid
Percentage
Cumulative
Percentage
Valid
Very Unsatisfied 42 21.0 21.0 21.0
Unsatisfied 37 18.5 18.5 39.5
Somehow
Satisfied 42 21.0 21.0 60.5
Satisfied 43 21.5 21.5 82.0
Very Satisfied 36 18.0 18.0 100.0
Total 200 100.0 100.0
Table 2: Level of Satisfaction Frequency
Table 3 represents a frequency analysis by gender. The table reveals that the total annual income
of females was greater than the total annual income of males. Similarly, the sums of spending,
level of satisfaction and age of females were greater than that of their female counterparts.
Gen
der
Count of
Gender
Sum of Income
per year (k$)
Sum of Spending
Score (1-100)
Sum of Level of
Satisfaction
Sum of
Age
Fem 112 6636 5771 320 4267
8
customer service and customer handling representing 21% of the total sample (Jouchi &
Yasuhiro, 2012).
The number of customers who were somehow satisfied with the level of customer handling and
service was 42 representing 21.0%. The number of customers who were satisfied were 43
representing 21.5% of the total sample. Similarly, the total number of the customers who were
very satisfied with customer service and customer handling were 36 representing 18% of the
total sample. Therefore, it is clear that the majority of the customers were not impressed or
satisfied with the level of customer handling and service that they received (Kutz, et al., 2016).
Level of Satisfaction
Frequency Percentage Valid
Percentage
Cumulative
Percentage
Valid
Very Unsatisfied 42 21.0 21.0 21.0
Unsatisfied 37 18.5 18.5 39.5
Somehow
Satisfied 42 21.0 21.0 60.5
Satisfied 43 21.5 21.5 82.0
Very Satisfied 36 18.0 18.0 100.0
Total 200 100.0 100.0
Table 2: Level of Satisfaction Frequency
Table 3 represents a frequency analysis by gender. The table reveals that the total annual income
of females was greater than the total annual income of males. Similarly, the sums of spending,
level of satisfaction and age of females were greater than that of their female counterparts.
Gen
der
Count of
Gender
Sum of Income
per year (k$)
Sum of Spending
Score (1-100)
Sum of Level of
Satisfaction
Sum of
Age
Fem 112 6636 5771 320 4267
DECISION MAKING USING STATISTICAL DATA
9
ale
Male 88 5476 4269 274 3503
Table 3: Frequency analysis by Gender
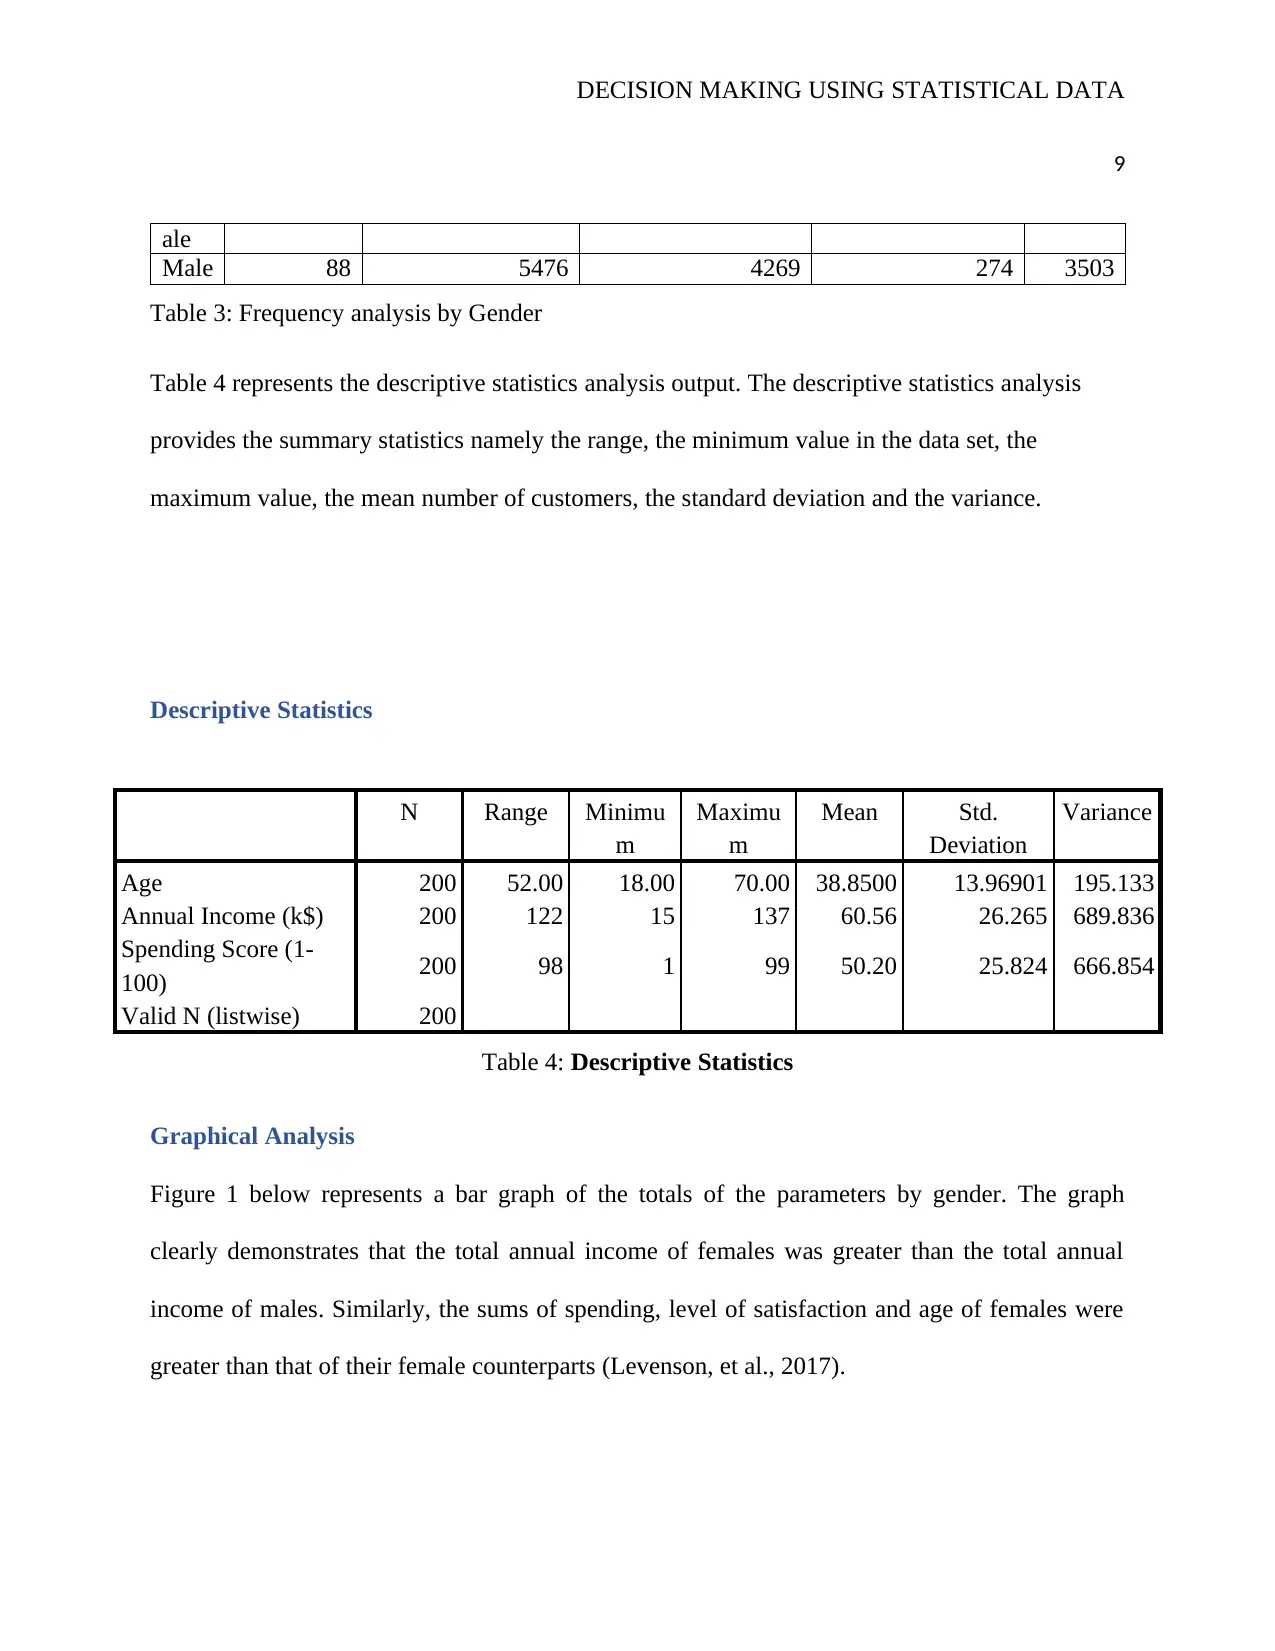
Table 4 represents the descriptive statistics analysis output. The descriptive statistics analysis
provides the summary statistics namely the range, the minimum value in the data set, the
maximum value, the mean number of customers, the standard deviation and the variance.
Descriptive Statistics
N Range Minimu
m
Maximu
m
Mean Std.
Deviation
Variance
Age 200 52.00 18.00 70.00 38.8500 13.96901 195.133
Annual Income (k$) 200 122 15 137 60.56 26.265 689.836
Spending Score (1-
100) 200 98 1 99 50.20 25.824 666.854
Valid N (listwise) 200
Table 4: Descriptive Statistics
Graphical Analysis
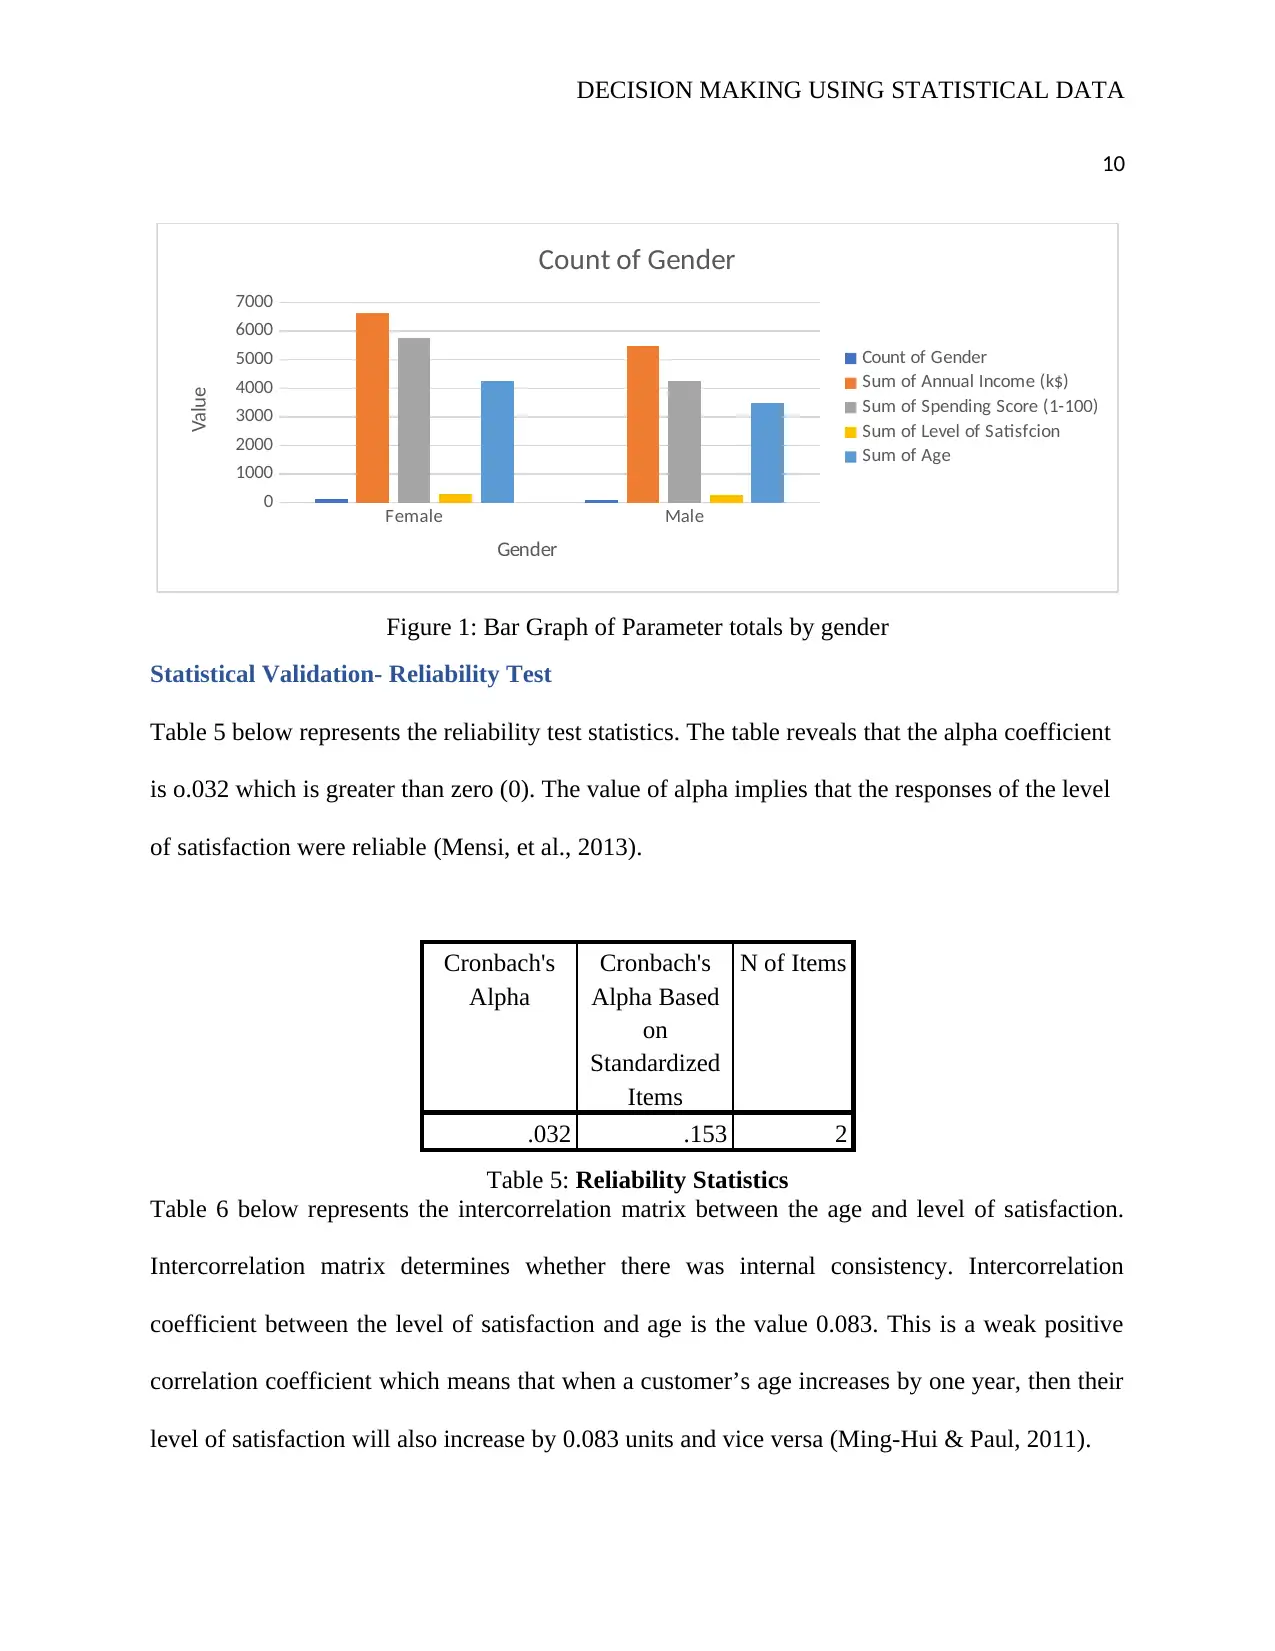
Figure 1 below represents a bar graph of the totals of the parameters by gender. The graph
clearly demonstrates that the total annual income of females was greater than the total annual
income of males. Similarly, the sums of spending, level of satisfaction and age of females were
greater than that of their female counterparts (Levenson, et al., 2017).
9
ale
Male 88 5476 4269 274 3503
Table 3: Frequency analysis by Gender
Table 4 represents the descriptive statistics analysis output. The descriptive statistics analysis
provides the summary statistics namely the range, the minimum value in the data set, the
maximum value, the mean number of customers, the standard deviation and the variance.
Descriptive Statistics
N Range Minimu
m
Maximu
m
Mean Std.
Deviation
Variance
Age 200 52.00 18.00 70.00 38.8500 13.96901 195.133
Annual Income (k$) 200 122 15 137 60.56 26.265 689.836
Spending Score (1-
100) 200 98 1 99 50.20 25.824 666.854
Valid N (listwise) 200
Table 4: Descriptive Statistics
Graphical Analysis
Figure 1 below represents a bar graph of the totals of the parameters by gender. The graph
clearly demonstrates that the total annual income of females was greater than the total annual
income of males. Similarly, the sums of spending, level of satisfaction and age of females were
greater than that of their female counterparts (Levenson, et al., 2017).
⊘ This is a preview!⊘
Do you want full access?
Subscribe today to unlock all pages.
Trusted by 1+ million students worldwide
DECISION MAKING USING STATISTICAL DATA
10
Female Male
0
1000
2000
3000
4000
5000
6000
7000
Count of Gender
Count of Gender
Sum of Annual Income (k$)
Sum of Spending Score (1-100)
Sum of Level of Satisfcion
Sum of Age
Gender
Value
Figure 1: Bar Graph of Parameter totals by gender
Statistical Validation- Reliability Test
Table 5 below represents the reliability test statistics. The table reveals that the alpha coefficient
is o.032 which is greater than zero (0). The value of alpha implies that the responses of the level
of satisfaction were reliable (Mensi, et al., 2013).
Cronbach's
Alpha
Cronbach's
Alpha Based
on
Standardized
Items
N of Items
.032 .153 2
Table 5: Reliability Statistics
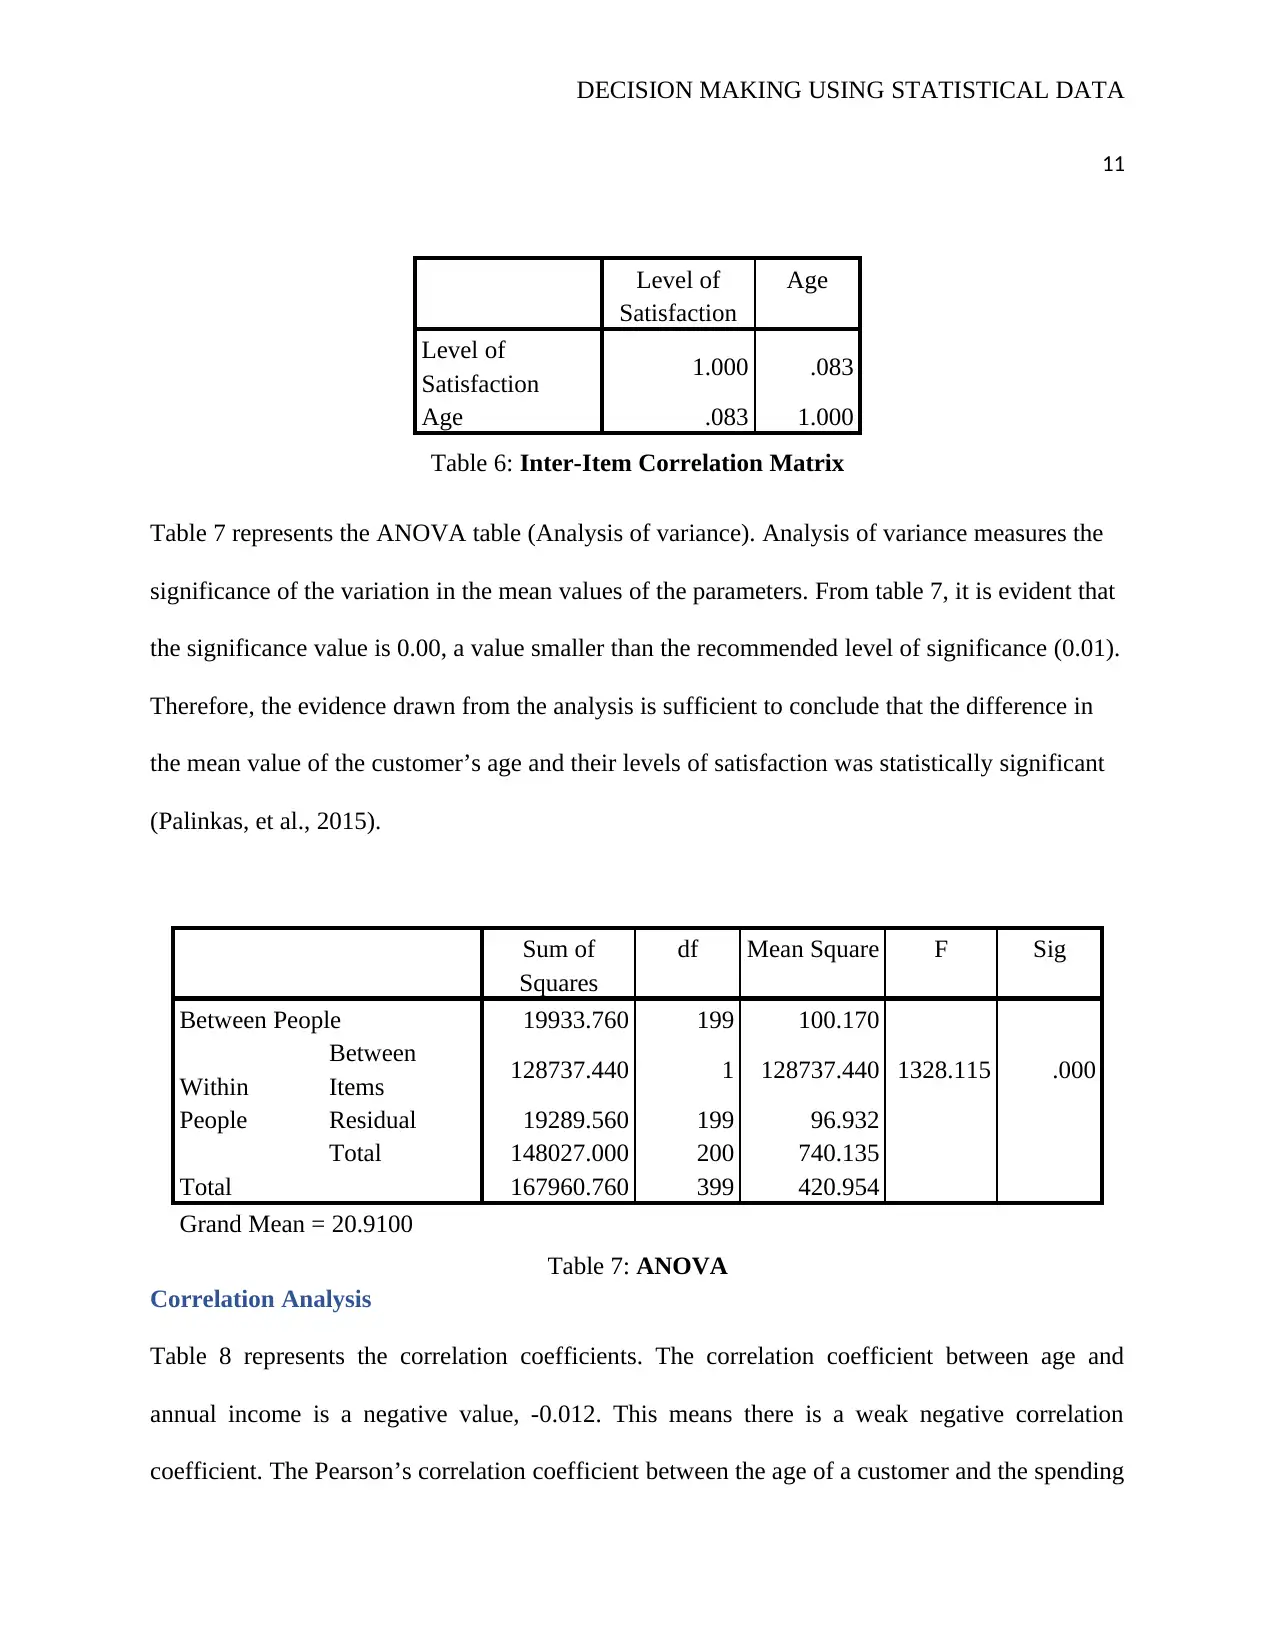
Table 6 below represents the intercorrelation matrix between the age and level of satisfaction.
Intercorrelation matrix determines whether there was internal consistency. Intercorrelation
coefficient between the level of satisfaction and age is the value 0.083. This is a weak positive
correlation coefficient which means that when a customer’s age increases by one year, then their
level of satisfaction will also increase by 0.083 units and vice versa (Ming-Hui & Paul, 2011).
10
Female Male
0
1000
2000
3000
4000
5000
6000
7000
Count of Gender
Count of Gender
Sum of Annual Income (k$)
Sum of Spending Score (1-100)
Sum of Level of Satisfcion
Sum of Age
Gender
Value
Figure 1: Bar Graph of Parameter totals by gender
Statistical Validation- Reliability Test
Table 5 below represents the reliability test statistics. The table reveals that the alpha coefficient
is o.032 which is greater than zero (0). The value of alpha implies that the responses of the level
of satisfaction were reliable (Mensi, et al., 2013).
Cronbach's
Alpha
Cronbach's
Alpha Based
on
Standardized
Items
N of Items
.032 .153 2
Table 5: Reliability Statistics
Table 6 below represents the intercorrelation matrix between the age and level of satisfaction.
Intercorrelation matrix determines whether there was internal consistency. Intercorrelation
coefficient between the level of satisfaction and age is the value 0.083. This is a weak positive
correlation coefficient which means that when a customer’s age increases by one year, then their
level of satisfaction will also increase by 0.083 units and vice versa (Ming-Hui & Paul, 2011).
Paraphrase This Document
Need a fresh take? Get an instant paraphrase of this document with our AI Paraphraser
DECISION MAKING USING STATISTICAL DATA
11
Level of
Satisfaction
Age
Level of
Satisfaction 1.000 .083
Age .083 1.000
Table 6: Inter-Item Correlation Matrix
Table 7 represents the ANOVA table (Analysis of variance). Analysis of variance measures the
significance of the variation in the mean values of the parameters. From table 7, it is evident that
the significance value is 0.00, a value smaller than the recommended level of significance (0.01).
Therefore, the evidence drawn from the analysis is sufficient to conclude that the difference in
the mean value of the customer’s age and their levels of satisfaction was statistically significant
(Palinkas, et al., 2015).
Sum of
Squares
df Mean Square F Sig
Between People 19933.760 199 100.170
Within
People
Between
Items 128737.440 1 128737.440 1328.115 .000
Residual 19289.560 199 96.932
Total 148027.000 200 740.135
Total 167960.760 399 420.954
Grand Mean = 20.9100
Table 7: ANOVA
Correlation Analysis
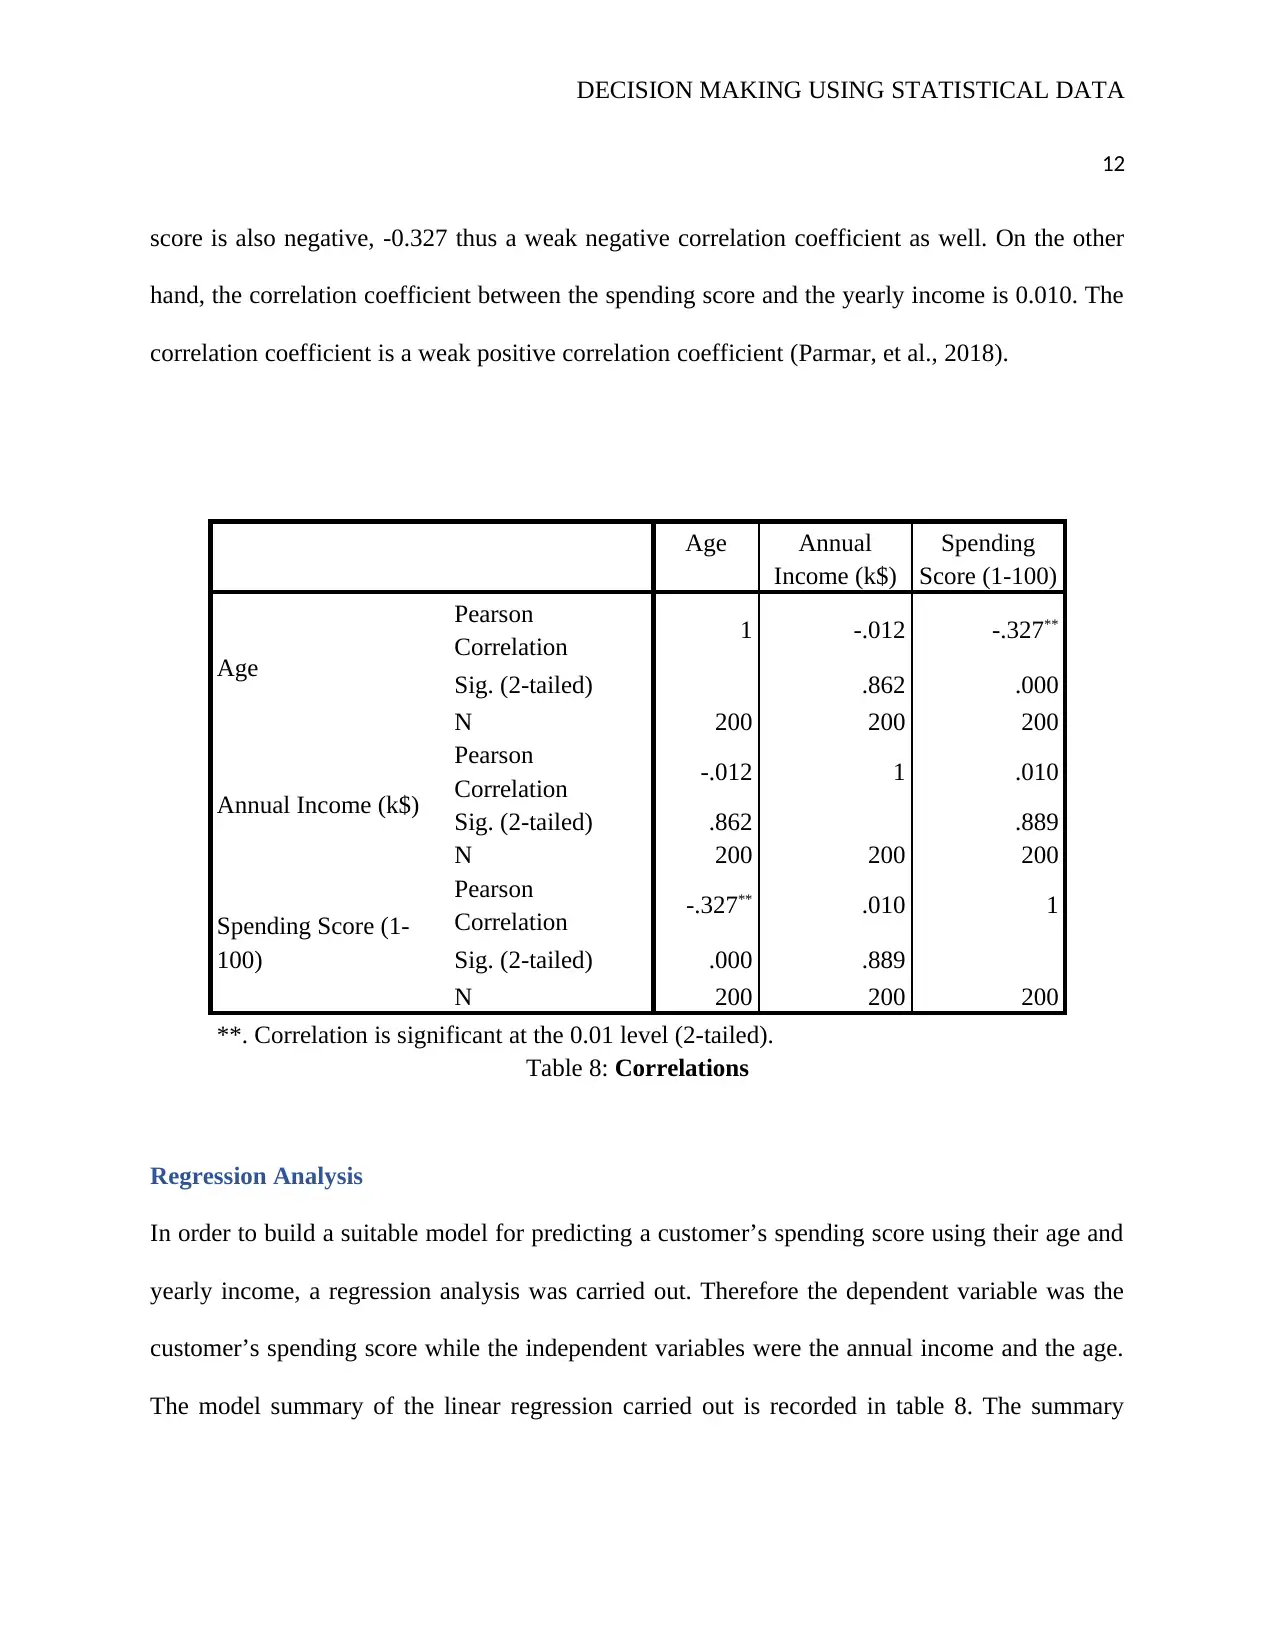
Table 8 represents the correlation coefficients. The correlation coefficient between age and
annual income is a negative value, -0.012. This means there is a weak negative correlation
coefficient. The Pearson’s correlation coefficient between the age of a customer and the spending
11
Level of
Satisfaction
Age
Level of
Satisfaction 1.000 .083
Age .083 1.000
Table 6: Inter-Item Correlation Matrix
Table 7 represents the ANOVA table (Analysis of variance). Analysis of variance measures the
significance of the variation in the mean values of the parameters. From table 7, it is evident that
the significance value is 0.00, a value smaller than the recommended level of significance (0.01).
Therefore, the evidence drawn from the analysis is sufficient to conclude that the difference in
the mean value of the customer’s age and their levels of satisfaction was statistically significant
(Palinkas, et al., 2015).
Sum of
Squares
df Mean Square F Sig
Between People 19933.760 199 100.170
Within
People
Between
Items 128737.440 1 128737.440 1328.115 .000
Residual 19289.560 199 96.932
Total 148027.000 200 740.135
Total 167960.760 399 420.954
Grand Mean = 20.9100
Table 7: ANOVA
Correlation Analysis
Table 8 represents the correlation coefficients. The correlation coefficient between age and
annual income is a negative value, -0.012. This means there is a weak negative correlation
coefficient. The Pearson’s correlation coefficient between the age of a customer and the spending
DECISION MAKING USING STATISTICAL DATA
12
score is also negative, -0.327 thus a weak negative correlation coefficient as well. On the other
hand, the correlation coefficient between the spending score and the yearly income is 0.010. The
correlation coefficient is a weak positive correlation coefficient (Parmar, et al., 2018).
Age Annual
Income (k$)
Spending
Score (1-100)
Age
Pearson
Correlation 1 -.012 -.327**
Sig. (2-tailed) .862 .000
N 200 200 200
Annual Income (k$)
Pearson
Correlation -.012 1 .010
Sig. (2-tailed) .862 .889
N 200 200 200
Spending Score (1-
100)
Pearson
Correlation -.327** .010 1
Sig. (2-tailed) .000 .889
N 200 200 200
**. Correlation is significant at the 0.01 level (2-tailed).
Table 8: Correlations
Regression Analysis
In order to build a suitable model for predicting a customer’s spending score using their age and
yearly income, a regression analysis was carried out. Therefore the dependent variable was the
customer’s spending score while the independent variables were the annual income and the age.
The model summary of the linear regression carried out is recorded in table 8. The summary
⊘ This is a preview!⊘
Do you want full access?
Subscribe today to unlock all pages.
Trusted by 1+ million students worldwide
1 out of 18
Related Documents


Your All-in-One AI-Powered Toolkit for Academic Success.
+13062052269
info@desklib.com
Available 24*7 on WhatsApp / Email
![[object Object]](/_next/static/media/star-bottom.7253800d.svg)
Unlock your academic potential
Copyright © 2020–2026 A2Z Services. All Rights Reserved. Developed and managed by ZUCOL.