Data Handling: Data Gap Analysis & Decision Making in Community
VerifiedAdded on 2023/06/13
|21
|5653
|103
Report
AI Summary
This report presents a data gap analysis for a community proposal, identifying data sources, inspecting data integrity, and recommending improvements for data analytics. It elaborates on the roadmap for developing big data infrastructure and ensures compliance with data protection requirements. The report explains how big data analytics can be used in organizational decision-making, covering strategic, tactical, and operational decisions. It also discusses data preparation processes, including data collection, filtering, and integration procedures, and examines data representatives along with statements of generalizability and limitations of the integrated dataset. Furthermore, it presents outcomes supporting decisions and provides recommendations on the implementation, acceptance, and assessment of decisions, discussing their contribution to strategic management. The document emphasizes the importance of regression analysis and SPSS for evaluating data and making informed decisions within the community project.
Data Handling and
Decision Making
Decision Making
Paraphrase This Document
Need a fresh take? Get an instant paraphrase of this document with our AI Paraphraser
Contents
EXECUTIVE SUMMARY.............................................................................................................4
TASK 1............................................................................................................................................5
1.1Performing data gap analysis for an organisation...................................................................5
Identifying data sources and data sets available for the project..................................................5
Inspection of data integrity and potential gaps in data analytics and data protection.................5
TASK1.2..........................................................................................................................................6
Recommended improvements to the data on project data analytics............................................6
Reorganisation of the current data driven processes to enhance data analytics and decision
making process............................................................................................................................6
Elaborating the roadmap for the development or enhancement of big data infrastructure..........7
Compliance of the proposed changes in the data analytics.........................................................8
1.3 Explaining how the proposed big data analytics can be used in the organisational decision
making.........................................................................................................................................9
REFERENCES..............................................................................................................................10
PART 2.1.......................................................................................................................................12
Explain process of data preparation that includes describing data collection, filtering and
integration procedure. And examine the data representatives along with statement of
generalisability and include limitation of integrated dataset as well.........................................12
TASK 2.2.......................................................................................................................................14
TASK 2.3.......................................................................................................................................19
Present further outcomes, for supporting the decisions made under above task.......................19
TASK 2.4.......................................................................................................................................20
Give recommendation on the implementation, acceptance and assessment of the decision
along with discussing that how it contributes to strategic management....................................20
REFERENCES..............................................................................................................................21

⊘ This is a preview!⊘
Do you want full access?
Subscribe today to unlock all pages.
Trusted by 1+ million students worldwide
EXECUTIVE SUMMARY
Data gap analysis is kind of analysis in which the analysts make use of the different tools to
sort the data in more convenient manner which would help them to interpret and take various
decisions related to the case in question. The following report highlights the case of data gap
analysis of a Community proposal. Various recommendations are being provided to the
organisation. Different types of decisions are also being discussed herein the report. The
advantage of data analysis in the helping the stakeholders to take a decision has also been
discussed. A detailed roadmap related to the big data infrastructure has also been provided in the
report.
Paraphrase This Document
Need a fresh take? Get an instant paraphrase of this document with our AI Paraphraser
TASK 1
1.1Performing data gap analysis for an organisation
Background of the organisation: This project deals in the community proposals which abide the
principle of charity and donation. It includes the activities related to the welfare and those
activities does not result into the profits but increase the economic growth of the country. Every
country become complete by its people only. There are various examples of community
proposals such as neighbourhood associations, government and non-profit organisations. It
serves various sectors of the economy such as old people, children, disabled, animals and
surroundings. For instance, a Christmas supper for the homeless (Levings and Stewart). These
community projects based on rural and urban areas helps to solve the disputes and issues of the
society which reduces the scope of conflict among the people of society.
Identifying data sources and data sets available for the project.
Meaning – Data source is a location from where the data originates. It can be either in the
primary or secondary form. The primary data is first hand and more accurate than other forms of
data. Whereas Secondary data is taken from the magazines, journals and newspaper.
Data set – It refers to the set of one or more records. It contains the same class of data. This data
set contains the information about number of people residing in the country and employment &
unemployment details of the country.
Inspection of data integrity and potential gaps in data analytics and data protection
Data integrity – It shows the validity or accuracy within the data. This term indicates the
reliability of the data which means when the data is used for several times, it will give the same
result every time. The integrity of the data can be calculated by following all the legislations
formed by the government of UK. The gap can be due to the various reasons such as Data
literacy, machine learning and analytics (Biswas, Sachdeva and Tortajada, 2021).
Data analytics – it is the branch of science which helps in making interpretations by using the
raw data collected earlier.
Data protection – It is the process of safeguarding the raw form of data from corruption,
compromise and various other forms of data loss.
TASK1.2
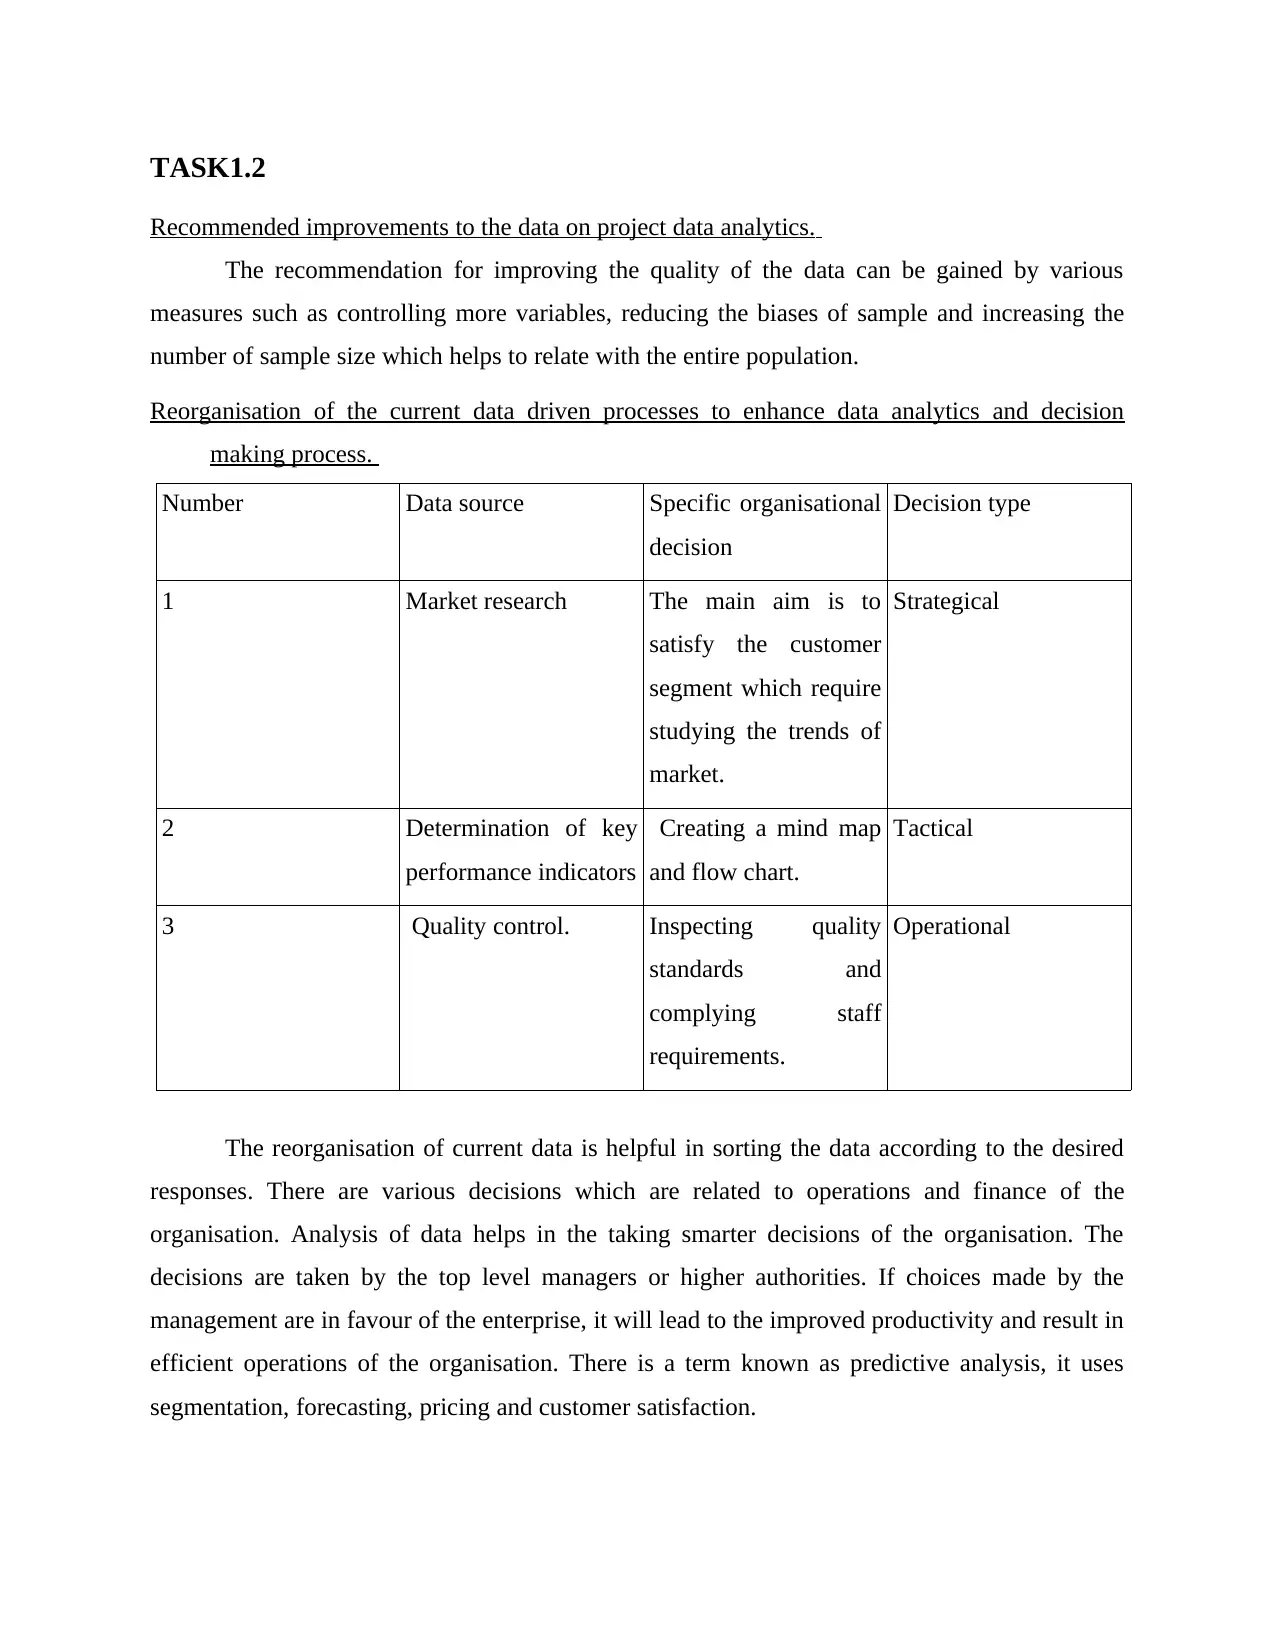
Recommended improvements to the data on project data analytics.
The recommendation for improving the quality of the data can be gained by various
measures such as controlling more variables, reducing the biases of sample and increasing the
number of sample size which helps to relate with the entire population.
Reorganisation of the current data driven processes to enhance data analytics and decision
making process.
Number Data source Specific organisational
decision
Decision type
1 Market research The main aim is to
satisfy the customer
segment which require
studying the trends of
market.
Strategical
2 Determination of key
performance indicators
Creating a mind map
and flow chart.
Tactical
3 Quality control. Inspecting quality
standards and
complying staff
requirements.
Operational
The reorganisation of current data is helpful in sorting the data according to the desired
responses. There are various decisions which are related to operations and finance of the
organisation. Analysis of data helps in the taking smarter decisions of the organisation. The
decisions are taken by the top level managers or higher authorities. If choices made by the
management are in favour of the enterprise, it will lead to the improved productivity and result in
efficient operations of the organisation. There is a term known as predictive analysis, it uses
segmentation, forecasting, pricing and customer satisfaction.
⊘ This is a preview!⊘
Do you want full access?
Subscribe today to unlock all pages.
Trusted by 1+ million students worldwide
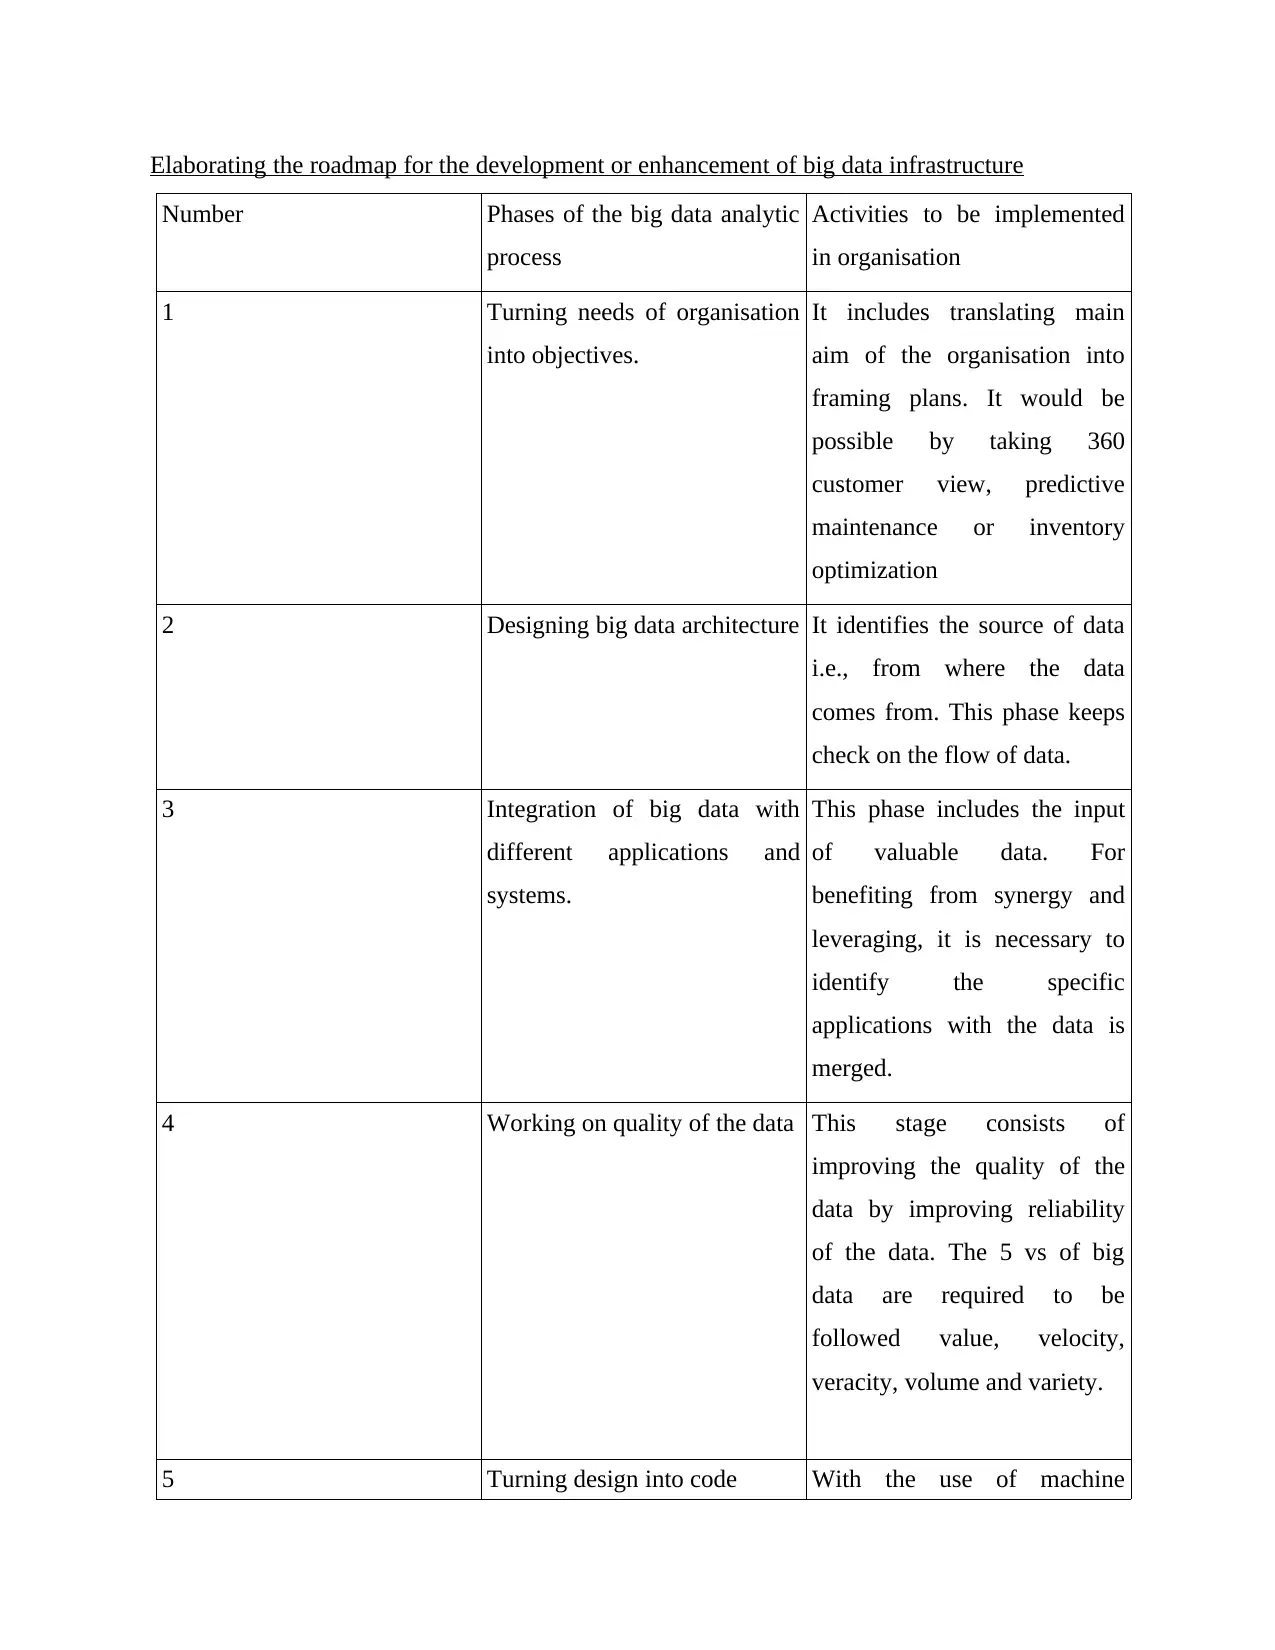
Elaborating the roadmap for the development or enhancement of big data infrastructure
Number Phases of the big data analytic
process
Activities to be implemented
in organisation
1 Turning needs of organisation
into objectives.
It includes translating main
aim of the organisation into
framing plans. It would be
possible by taking 360
customer view, predictive
maintenance or inventory
optimization
2 Designing big data architecture It identifies the source of data
i.e., from where the data
comes from. This phase keeps
check on the flow of data.
3 Integration of big data with
different applications and
systems.
This phase includes the input
of valuable data. For
benefiting from synergy and
leveraging, it is necessary to
identify the specific
applications with the data is
merged.
4 Working on quality of the data This stage consists of
improving the quality of the
data by improving reliability
of the data. The 5 vs of big
data are required to be
followed value, velocity,
veracity, volume and variety.
5 Turning design into code With the use of machine
Paraphrase This Document
Need a fresh take? Get an instant paraphrase of this document with our AI Paraphraser
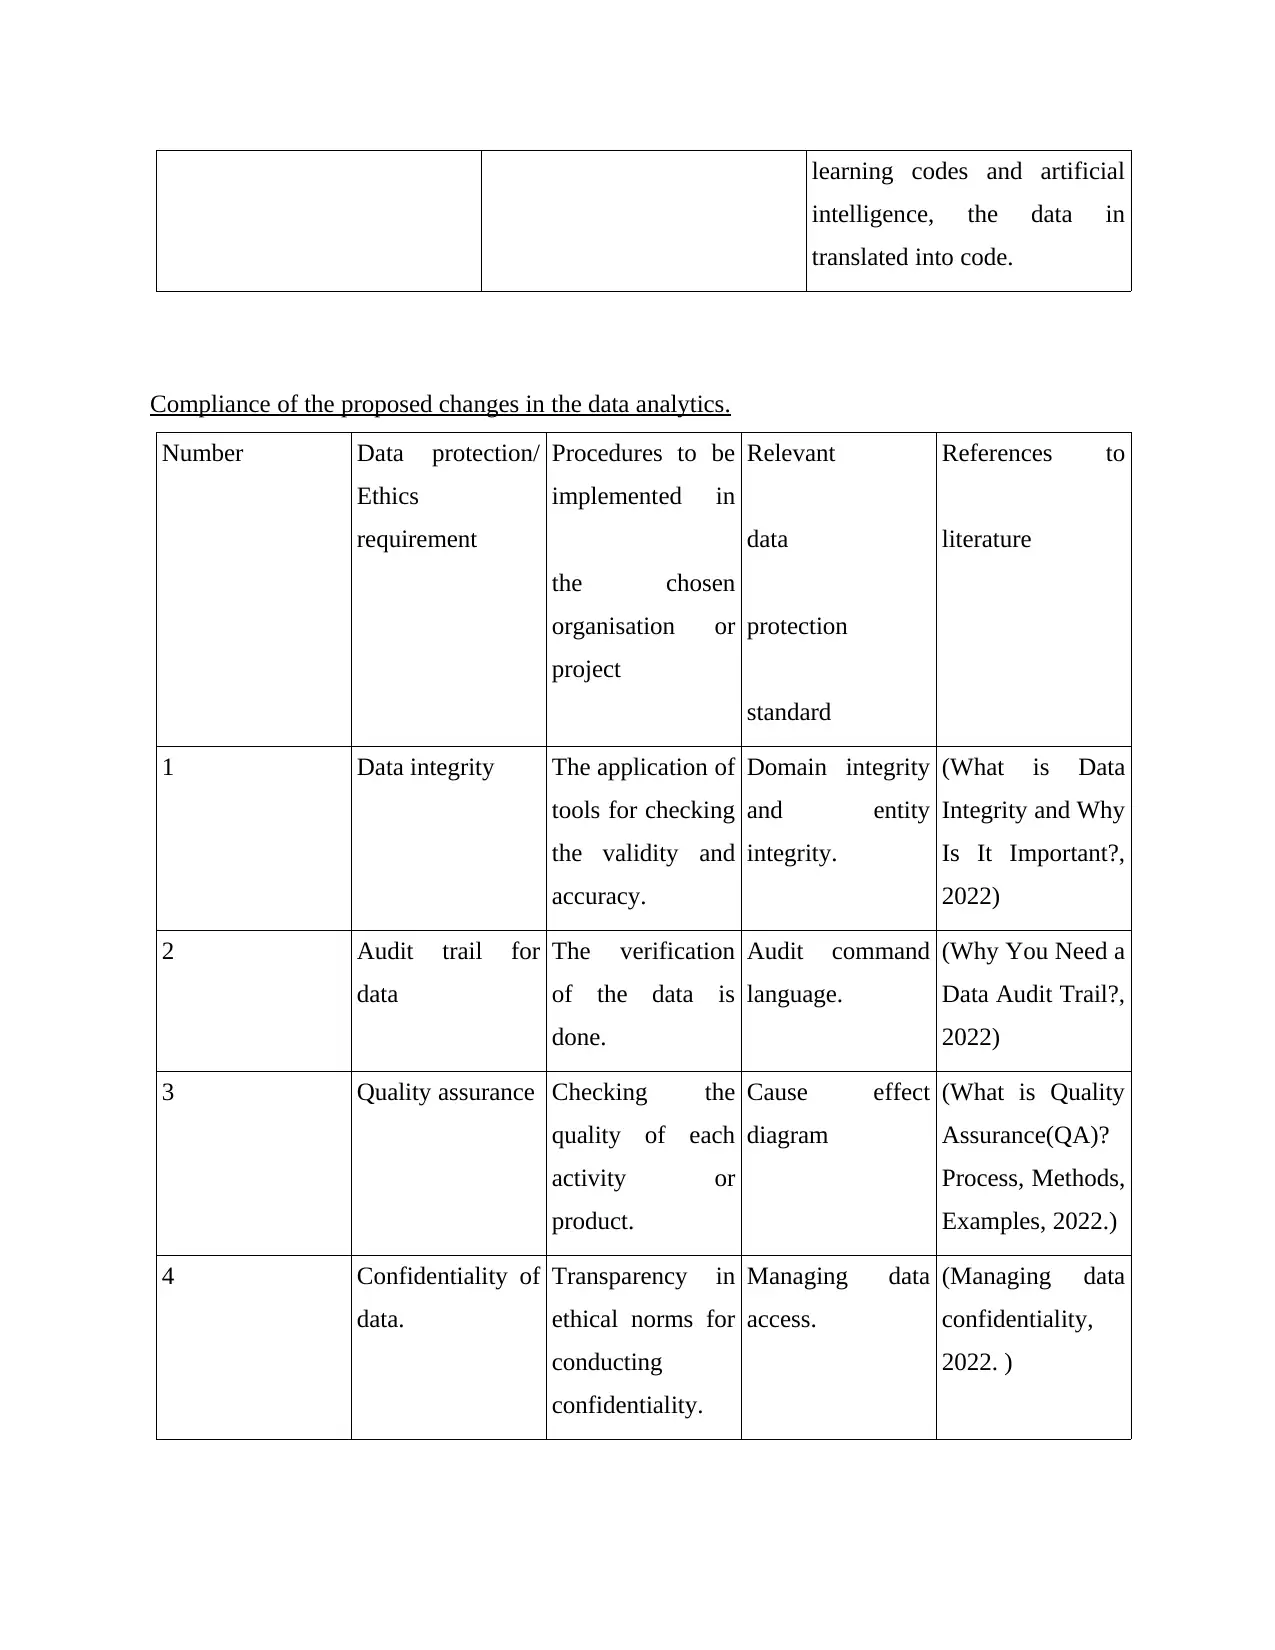
learning codes and artificial
intelligence, the data in
translated into code.
Compliance of the proposed changes in the data analytics.
Number Data protection/
Ethics
requirement
Procedures to be
implemented in
the chosen
organisation or
project
Relevant
data
protection
standard
References to
literature
1 Data integrity The application of
tools for checking
the validity and
accuracy.
Domain integrity
and entity
integrity.
(What is Data
Integrity and Why
Is It Important?,
2022)
2 Audit trail for
data
The verification
of the data is
done.
Audit command
language.
(Why You Need a
Data Audit Trail?,
2022)
3 Quality assurance Checking the
quality of each
activity or
product.
Cause effect
diagram
(What is Quality
Assurance(QA)?
Process, Methods,
Examples, 2022.)
4 Confidentiality of
data.
Transparency in
ethical norms for
conducting
confidentiality.
Managing data
access.
(Managing data
confidentiality,
2022. )
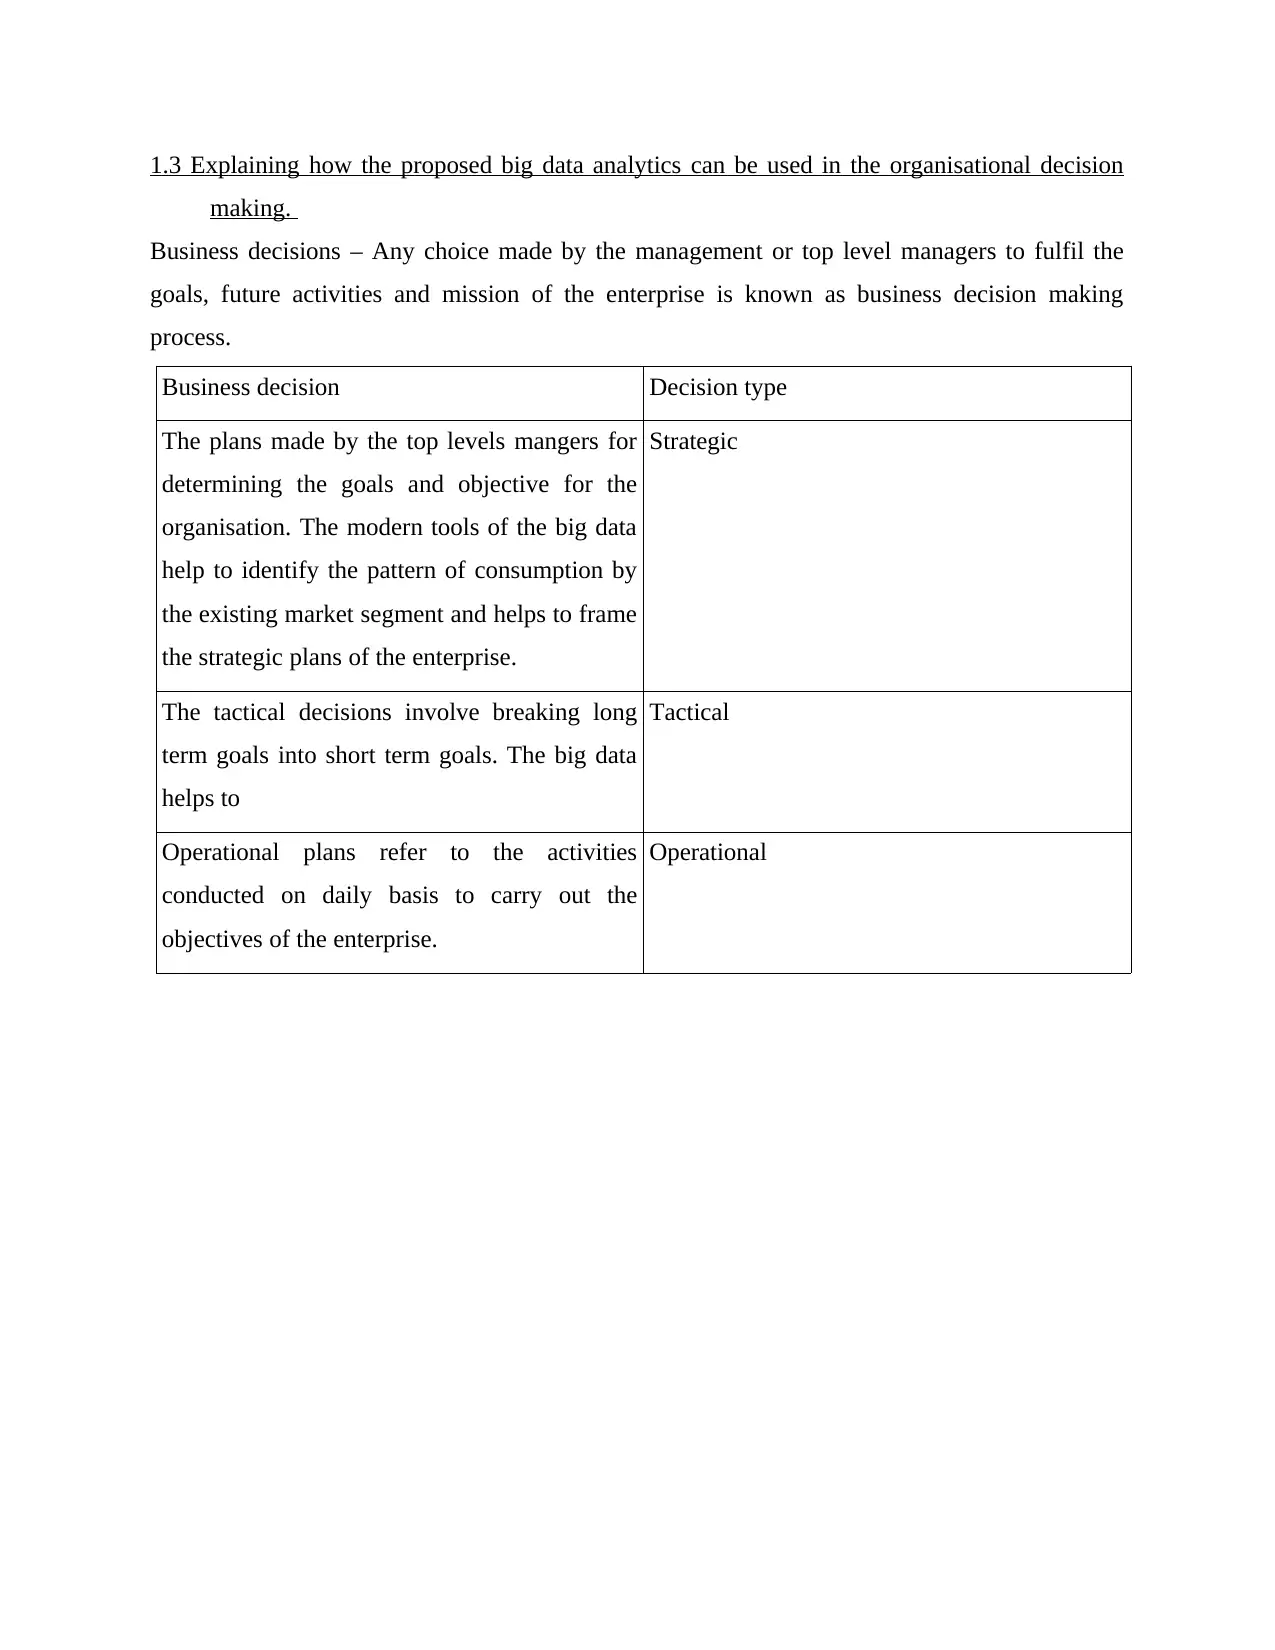
1.3 Explaining how the proposed big data analytics can be used in the organisational decision
making.
Business decisions – Any choice made by the management or top level managers to fulfil the
goals, future activities and mission of the enterprise is known as business decision making
process.
Business decision Decision type
The plans made by the top levels mangers for
determining the goals and objective for the
organisation. The modern tools of the big data
help to identify the pattern of consumption by
the existing market segment and helps to frame
the strategic plans of the enterprise.
Strategic
The tactical decisions involve breaking long
term goals into short term goals. The big data
helps to
Tactical
Operational plans refer to the activities
conducted on daily basis to carry out the
objectives of the enterprise.
Operational
⊘ This is a preview!⊘
Do you want full access?
Subscribe today to unlock all pages.
Trusted by 1+ million students worldwide

REFERENCES
Biswas, A.K., Sachdeva, P.K. and Tortajada, C., 2021. Gap Analysis of Four Domains.
In Phnom Penh Water Story (pp. 89-90). Springer, Singapore.
Levings, C.D. and Stewart, H.L., Research Priorities for Nearshore Algae in Coastal British
Columbia Workshop and Gap Analysis-Final Report.
Biswas, A.K., Sachdeva, P.K. and Tortajada, C., 2021. Gap Analysis of Four Domains.
In Phnom Penh Water Story (pp. 89-90). Springer, Singapore.
Levings, C.D. and Stewart, H.L., Research Priorities for Nearshore Algae in Coastal British
Columbia Workshop and Gap Analysis-Final Report.
Paraphrase This Document
Need a fresh take? Get an instant paraphrase of this document with our AI Paraphraser
EXECUTIVE SUMMARY
The decision that would help in analysis is Regression analysis and SPSS method must be
chosen for evaluating. It also helps to understand its importance and necessity in a project plan or
company that would help to predict the dependency of one value of variable on another variable.
It is thus observed that Urban community must hire employees who specialise in SPSS and are
having a thorough knowledge of it for better results. It is further advised to that the company to
schedule proper training for people who can perform better and serve as an asset for the same.
PART 2.1
Explain process of data preparation that includes describing data collection, filtering and
integration procedure. And examine the data representatives along with statement of
generalisability and include limitation of integrated dataset as well.
Data collection can be explained as a process suggested for collecting, sorting and
examining the information accurately for carrying out research with the help of standardised
tools, methods and techniques. An organisation or a person that conducts the research can
evaluate hypothesis on basis of data collected. The first step for initiating any type of research is
to gather the data at one place (Egger, 2022). The necessary aspect that must be kept in mind is
reliability and accuracy present in the information collected also how it contributes in decision
making as well. There are two kinds of methods applied in such data such as primary and
secondary. In current scenario there are different methods for collection of primary data. It can
be collected with the help of interviews scheduled on telephonic conversations, in person
conversation or through emails as well. The secondary data can be gathered at one place through
sources such as journals, newspaper, articles, books and their websites as well. But the credibility
of such sources is dependent on people who has collected it in initial stages. After collection of
information from efficient sources, it is necessary to sort & filter this information for evaluating
it.
Filtering of data can be explained as an operation for choosing specific section of content
for further investigation. This portion is distributed on a temporary basis in few cases and on
permanent basis in others, but the whole set further is kept with them only. For instance, there is
a need to collect data about a particular duration. So, filtering of data is demanded that would
help to sort data as well for a given time period. It is also helpful for computation of outcome
that is required to be sorted. After filtration and sorting of useful information next step that is
needed is to integrate the data that is diffused under different formats.
Data integration can be explained as a method that helps to put all information collected
from various sources and merging it in a single file or presenting it in a respective frame. It starts
from the procedure based on activities such as mapping, transforming and cleansing. It further
helps to make tools effective that related to analytics and will be helpful for implementation of
decisions as well (Fedushko and Ustyianovych, 2019). There is no such method that is soleus
⊘ This is a preview!⊘
Do you want full access?
Subscribe today to unlock all pages.
Trusted by 1+ million students worldwide
1 out of 21
Related Documents


Your All-in-One AI-Powered Toolkit for Academic Success.
+13062052269
info@desklib.com
Available 24*7 on WhatsApp / Email
![[object Object]](/_next/static/media/star-bottom.7253800d.svg)
Unlock your academic potential
Copyright © 2020–2026 A2Z Services. All Rights Reserved. Developed and managed by ZUCOL.