Data Analysis: Excel and Weka for Business Intelligence Report

Verified

Added on  2020/01/07

|18
|3573
|185
Report
AI Summary
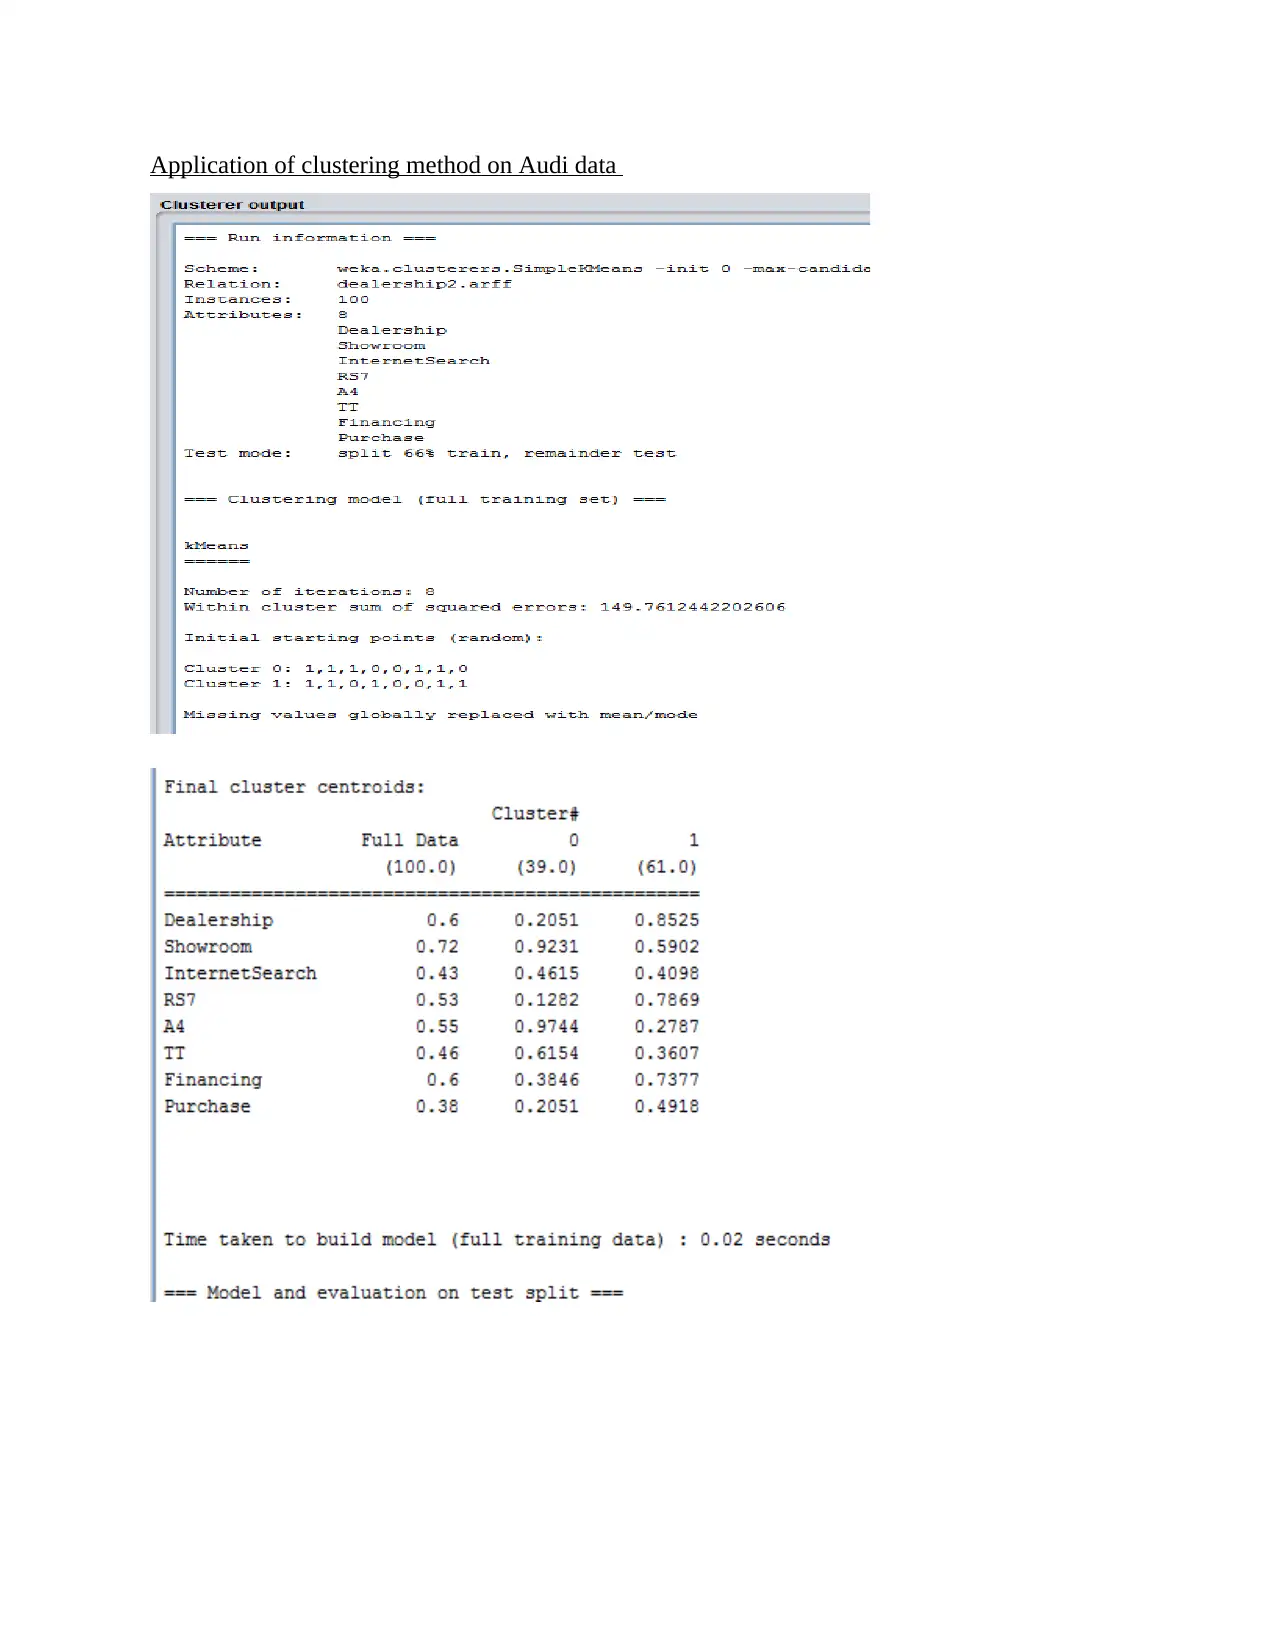
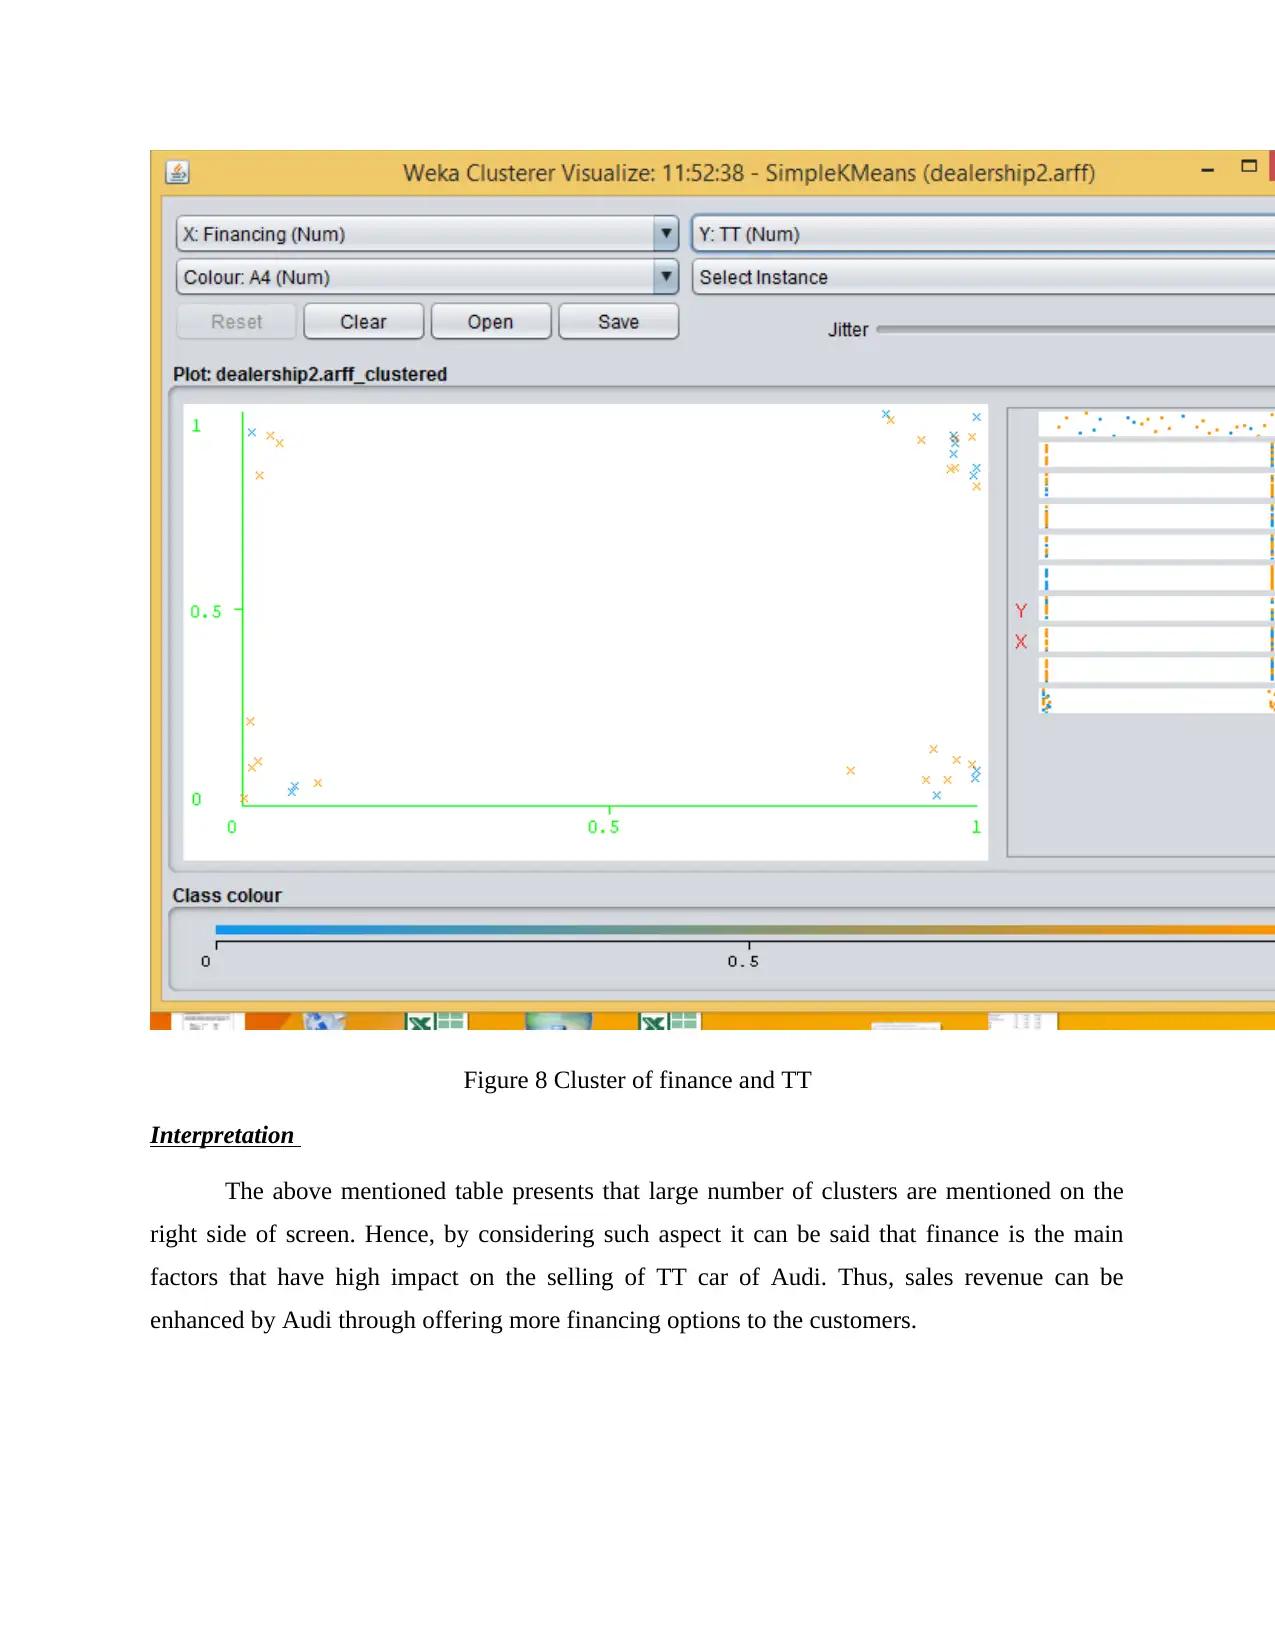
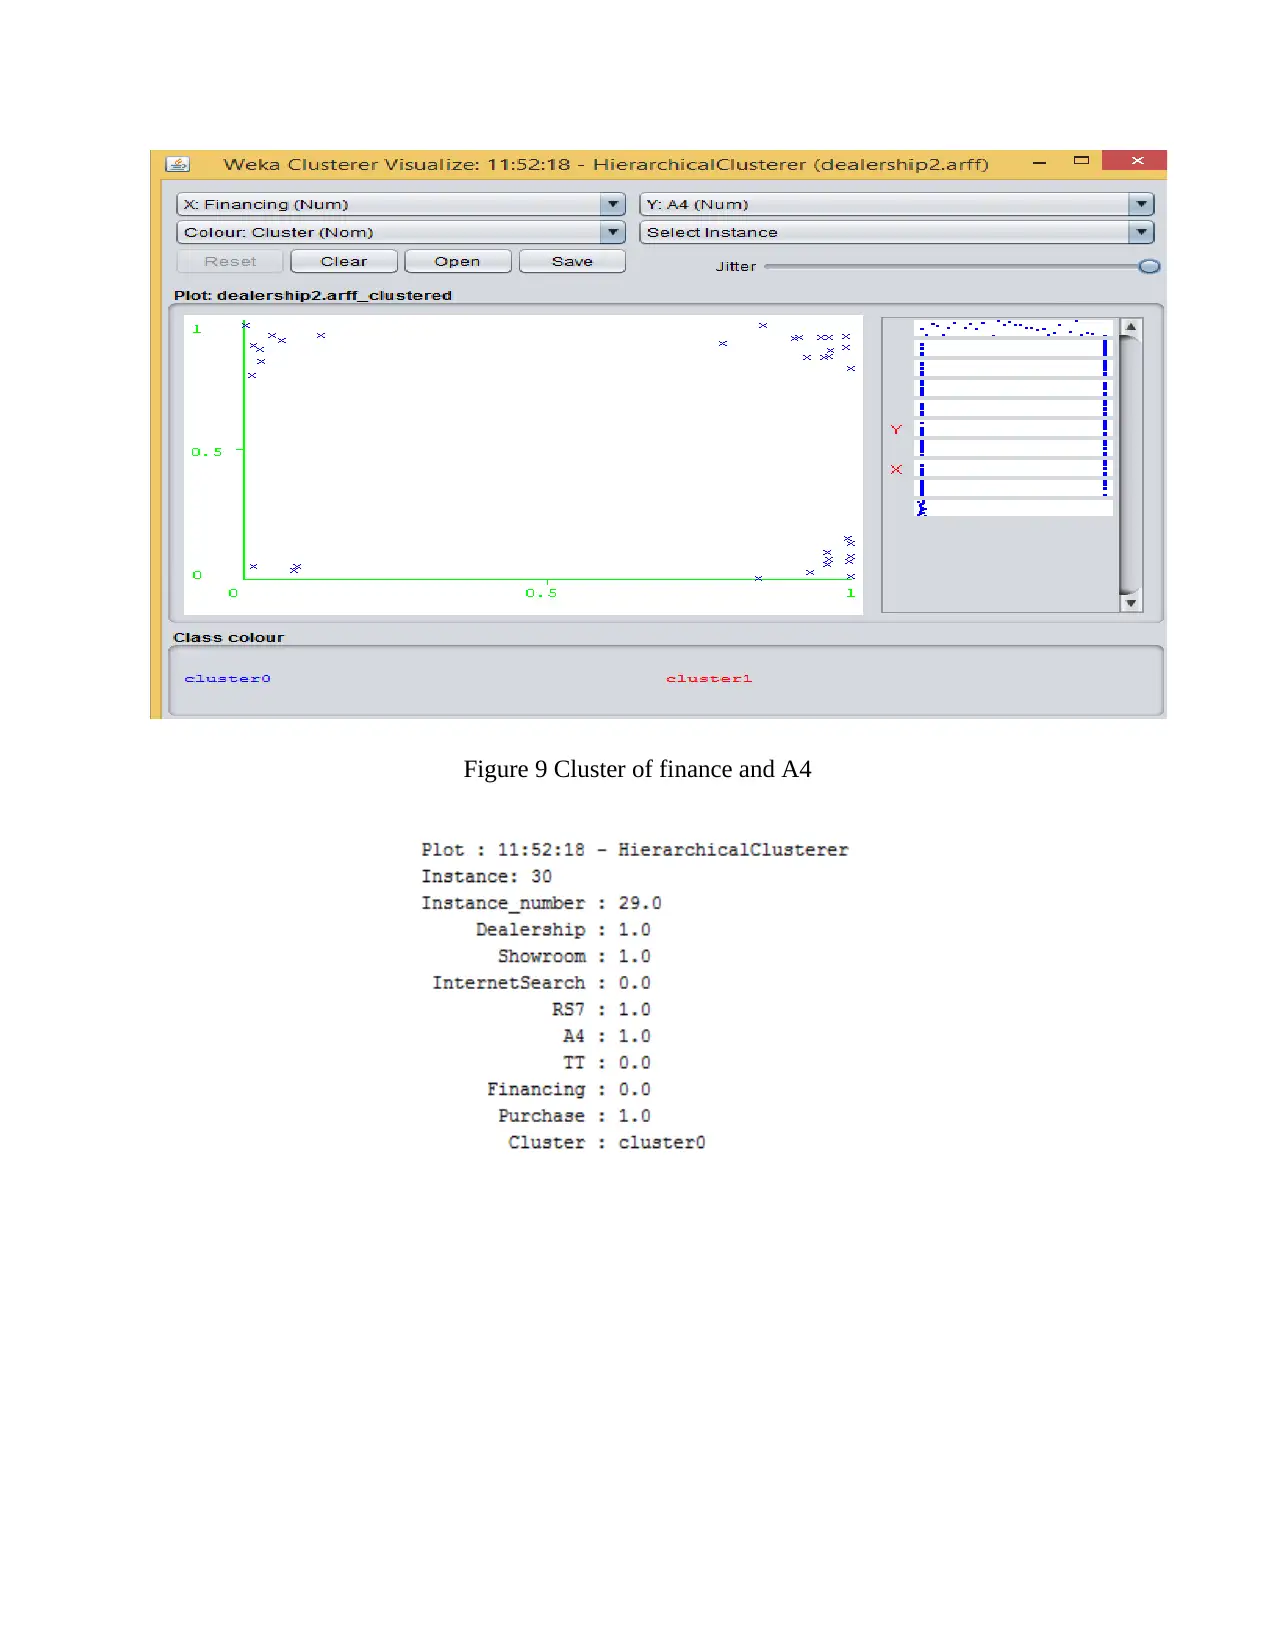
This report delves into data handling and business intelligence, evaluating the use of Excel and Weka for data mining and analysis. The first part critically assesses Excel's strengths and weaknesses in pre-processing datasets, using case studies of a superstore's declining sales and profit figures to illustrate the impact of discounting policies and margin setting. The report highlights the advantages of Excel, such as its charting and formula capabilities, while also pointing out its limitations, including the risk of data manipulation and the need for analyst familiarity. The second part discusses the advantages and disadvantages of Weka, a machine learning tool, over Excel, including its clustering methods applied to Audi data. The analysis examines how different customer segments respond to financing options and warranty policies based on cluster analysis of Audi car sales. The report concludes with a comparison of these tools, highlighting their respective roles in extracting valuable insights from large datasets to support effective decision-making in business contexts.
Document Page
Data Handling and Business
Intelligence
tabler-icon-diamond-filled.svg

Paraphrase This Document

Need a fresh take? Get an instant paraphrase of this document with our AI Paraphraser
Document Page
Table of Contents
INTRODUCTION...........................................................................................................................3
PART 1............................................................................................................................................3
Critically evaluating the strengths and weaknesses of using excel for pre-processing data set. .3
PART 2............................................................................................................................................8
Discussing the advantages and disadvantages of Weka over excel.............................................8
Application of clustering method on Audi data.........................................................................11
Modification of existing data.....................................................................................................15
CONCLUSION..............................................................................................................................17
REFERENCES..............................................................................................................................18
Document Page
INTRODUCTION
Data mining may be defined a process which is used to examine the large existing
database. By this, business unit can extract or generate new information in the best possible
manner. Moreover, data mining tools place more emphasis on the conversion of raw data into
valuable information. Thus, data mining tools help business organization in making highly
effectual as well as profitable decisions and thereby make contribution in the attainment of
organizational goals. The present report is based on the case situations which will present the
tools that are used by superstores and Audi dealership for the purpose of data mining. Besides
this, it will also shed light on the benefits and drawbacks which are associated with traditional
use of Excel as well as Weka.
PART 1
Critically evaluating the strengths and weaknesses of using excel for pre-processing data set
Reasons due to which sales and profit figure of superstore declines over the years
Figure 1 Calculation of unit cost
Figure 2 Margin calculation per unit
Document Page
Figure 3IF statement formula
Figure 4 IF statement formula
Figure 5Lookup formula
From the above mentioned table, it has been analyzed that discounting policies which are
framed and introduced by supermarkets are not highly effective. Hence, it is one of the main
reasons due to which sales revenue of supermarkets is continuously declining. By making use of
excel options or functions it has been identified that supermarkets are offering same discounts on
products irrespective their price level (Wu and et.al., 2014). Hence, it is one of the main factors
which have high level of impact on the purchasing decision of the customers of supermarket.
From the evaluation of data set it has been assessed that 0.07 discount is offered by supermarkets
on products with the ID of 103 and 107. On the other side, high level of variation takes place in
the price level of such products. Data set presents that price of product with the ID of 103 is
tabler-icon-diamond-filled.svg

Paraphrase This Document

Need a fresh take? Get an instant paraphrase of this document with our AI Paraphraser
Document Page
2781 respectively. On the other hand, ID 107 product is served by the supermarkets at the price
of 228. Due to such reason sales revenue of the firm is affected in a negative manner.
Usually, customers want and expect high level of discount when they purchase highly
priced product. In this situation, supermarkets fail to meet the expectation level of the customers.
This in turn also influences satisfaction and loyalty aspect of customers negatively. Along with
this, usually customers are attracted to purchase highly expensive product only when they get
more discount (Gupta, 2014). Thus, such discounting policy causes reduction in the sales
revenue of firm. Besides this, such aspect can also be supported from other examples where
supermarket has provided customers with similar discounts on varied price level (Carlberg,
2014). Collected data shows that ID 203 and 204 highly differs in terms of price level.
However, discount which is offered by supermarkets on such ID product is 0.06. This
aspect clearly shows that supermarket has setting down the discounting policy without taking
into account the factors that have high level of impact on purchasing behavior and decision
making aspect of customers (Hothorn and Zeileis, 2015). Hence, supermarket is required to
make changes in the existing policies which in turn help in enhancing the sales position to the
large extent. Along with this, business unit needs to make focus on promotional aspects or
campaign for persuading customers about the products or services offered by it.
In addition to this, strategies employed by supermarket for setting the margin are not
highly effectual. Moreover, supermarkets have setting down the lower margin on products with
higher price. On the other hand, company sets higher margin on products whose prices are lower.
For instance: profit level and price of ID product 2383 is .59. In contrast to this, sales price and
profit margin of ID product 2484 is 1810 & .77. Thus, by considering such aspect it can be said
that there is no logical relationship takes place between the sales value and profit level. This is
the main reason which hampered the profit level of firm negatively (Zhang, 2014). On the other
hand, in the real world, superstores generate high profit when they provide customers with highly
priced products. Moreover, usually business unit enjoys high economies of scale when they
manufacture or offer highly expensive products to the customers. Along with this, cost is another
factor that influences the profit margin or level of supermarket. For instance: In cost plus pricing
approach, profit factor is affected from the money incurred by the firm for manufacturing and
offering the products to customers (Correa and et.al., 2015). Hence, company needs to frame
Document Page
competent framework for making control over the expenditure level. In addition to this, finance
personnel and analyst of supermarket needs to make focus on reviewing the profit policies
according to the market trend and competitors framework. Hence, by taking such strategic
measure or action supermarket can make significant improvement in both sales and profit level.
Pros and cons of using excel
Excel is one of the main traditional methods which are undertaken by most of the firms
for decision making. Moreover, excel contains several options which helps in evaluating and
analyzing the large data set more effectively through the means of lookup, if function, pivot
table, charts etc. (Seiffert and et.al., 2014). Hence, by using all such functions or tools business
unit can generate highly valuable information and thereby assists in taking effective decision that
aid in its growth aspect.
Advantages
Excel helps in framing appropriate charts and graphs from the large data set in an
effectual way. Through this, business entities can understand the trend or pattern of
specific data. For instance: By making use of excel company can draw the charts and
graphs in relation to sales as well as profit figures (Keramati and et.al., 2014). This in
turn provides deeper insight about the manner in which sales figures are moving in each
year. In this way, graphs or charts facilitate better understanding about the pattern of
financial movements.
Along with this, if function of excel is highly effectual which in turn helps in identifying
the situation that occurred in a repeated manner. Hence, in this, by inserting the formula
regarding the specific situation specific data set can be identified or assessed more
efficiently (Keet and et.al., 2015). Thus, such function reduces the manual work to the
large extent. Moreover, manual work is so tedious and time consuming. In this way,
excel work helps in presenting and assessing data in a better way.
Further, pivot table also helps in handling the large quantity of data in the best possible
manner. By this, business units can summarize the data set in a structured manner
(Harvey, 2016). Hence, it helps in organizing the large amount of data in the best
possible way. Along with this, ease of data analysis is another main strength of such tool.
In this, one can summarize data by dragging data into the different sections of table.
Document Page
Such tool also helps in making proper and appropriate forecasting of data set. By this,
one can prepare and present reports within the less time-frame (Vilares, Alonso and
Gómez-Rodríguez, 2015). Hence, such tool of excel also provides assistance in saving
the huge amount of time to the significant level. The rationale behind this, in the
industrial world pivot table helps company in making quick and precise decisions.
Lookup is one of the most valuable functions of excel through which specific variable
can be assessed from the big data set. In excel, by putting the specific value in the look
up option analysts can find out the data that takes place in a vertical or horizontal cell
(Sanmiquel, Rossell and Vintró, 2015). By considering such aspect it can be said that
excel options are highly useful and provides assistance to the analysts in saving time.
Disadvantages
Data which is recorded in the excel sheet suffers from the risk of manipulation which
in turn resulted into high losses. For instance: if analysts failed to enter appropriate
data in the sheet then it may result into the inappropriate framework for the decision
making.
Graphs which are drawn in excel only provides higher management with the
quantitative expression of data set. Excel does not provide information about the
qualitative facts and figures which are equally important for analysts when they take
decisions. Due to this, traditional means or use of excel does not have high level of
importance in the decision making aspect.
High level of familiarity is also required among the analysts regarding sources
before making use of pivot table. Moreover, in the absence of having proper
information it is not possible for the analysts to determine suitable solution from the
big data set (The Disadvantages of Pivot Tables, 2017).
In addition to this, analysts cannot find suitable option if they fail to insert suitable
condition. Moreover, if function provides output according to situation identified by
the analysts.
Hence, traditional options of excel have both advantages and disadvantages which analyst
needs to keep in mind while evaluating the quantitative aspects.
tabler-icon-diamond-filled.svg

Paraphrase This Document

Need a fresh take? Get an instant paraphrase of this document with our AI Paraphraser
Document Page
PART 2
Discussing the advantages and disadvantages of Weka over excel
Weka may be defined as a collection of machine learning algorithms which in turn help in
mining the data more effectively and efficiently. It includes several tools which provide
assistance to the company in classifying, pre-processing the data through the means of regression
and other techniques effectually. Weka contains wide range of visualization tools and algorithm
which helps in analyzing data in the best possible way. It also provides assistance in predicting
the future pattern or aspects more effectually. It is Java based version which in turn helps in
evaluating the large amount of data more efficiently.
Figure 6 Output table of decision tree in Weka
Document Page
Figure 7: Decision tree in Weka
Interpretation
The above mentioned charts present that customers of Audi have option to make
purchase either before or after the month of August, 2005. Thus, customers will not make use of
warranty policy if they purchase Audi after the period of August, 2005. Besides this, if purchase
is made after the month of December then there is the possibility that customers will make use of
warranty period. On the other side, if purchase is made by the customers before December, 2012
then customers will not make use of warranty policy. Thus, month is one of the main aspects
which has high level of impact on the execution of warranty policy to the large extent.
Document Page
Application of clustering method on Audi data
tabler-icon-diamond-filled.svg

Paraphrase This Document

Need a fresh take? Get an instant paraphrase of this document with our AI Paraphraser
Document Page
Figure 8 Cluster of finance and TT
Interpretation
The above mentioned table presents that large number of clusters are mentioned on the
right side of screen. Hence, by considering such aspect it can be said that finance is the main
factors that have high impact on the selling of TT car of Audi. Thus, sales revenue can be
enhanced by Audi through offering more financing options to the customers.
Document Page
Figure 9 Cluster of finance and A4
chevron_up_icon
1 out of 18
circle_padding
hide_on_mobile
zoom_out_icon
[object Object]