Analysis of Capital Structure and Cost: Debenhams and Marks & Spencer
VerifiedAdded on 2020/10/22
|14
|3385
|177
Report
AI Summary
This report conducts a comparative financial analysis of Debenhams PLC and Marks & Spencer Group PLC, focusing on key aspects of corporate financial management. It examines the capital structure of both companies, analyzing their debt and equity components over a period of time, and calculates the weighted average cost of capital (WACC) to assess the companies' financing costs. The report also delves into the cost of capital using the discounted cash flow (DCF) model to evaluate investment attractiveness. Furthermore, it applies ratio analysis, including current and quick ratios, to assess the financial performance and liquidity of both companies. The analysis provides insights into the financial health and strategic decisions of these two prominent retailers, highlighting their similarities and differences in financial management practices.
CORPORATE
FINANCIAL
MANAGEMENT
FINANCIAL
MANAGEMENT
Paraphrase This Document
Need a fresh take? Get an instant paraphrase of this document with our AI Paraphraser
Table of Contents
INTRODUCTION ..........................................................................................................................3
1. Capital structure of companies...........................................................................................3
2. Cost of capital.....................................................................................................................6
3. Ratio Analysis....................................................................................................................8
CONCLUSION .............................................................................................................................10
REFERENCES..............................................................................................................................11
INTRODUCTION
Corporate finance providing help in financial dealing with the capital structure and
source of funding (Chenhall and Moers, 2015). This reports selecting two companies are
Debenhams PLC and Marks and Spencer group PLC. Debenhams plc is a major world-wide,
multi channel trade name with a proud British attribute which trading from over 241 stores
across 22 countries. Marks and Spencer Group plc is a retailer of clothing, food and home
products in the united kingdom. This report covered these topics of selecting companies like as
capital structure, cost of capital and ratio analysis.
MAIN BODY
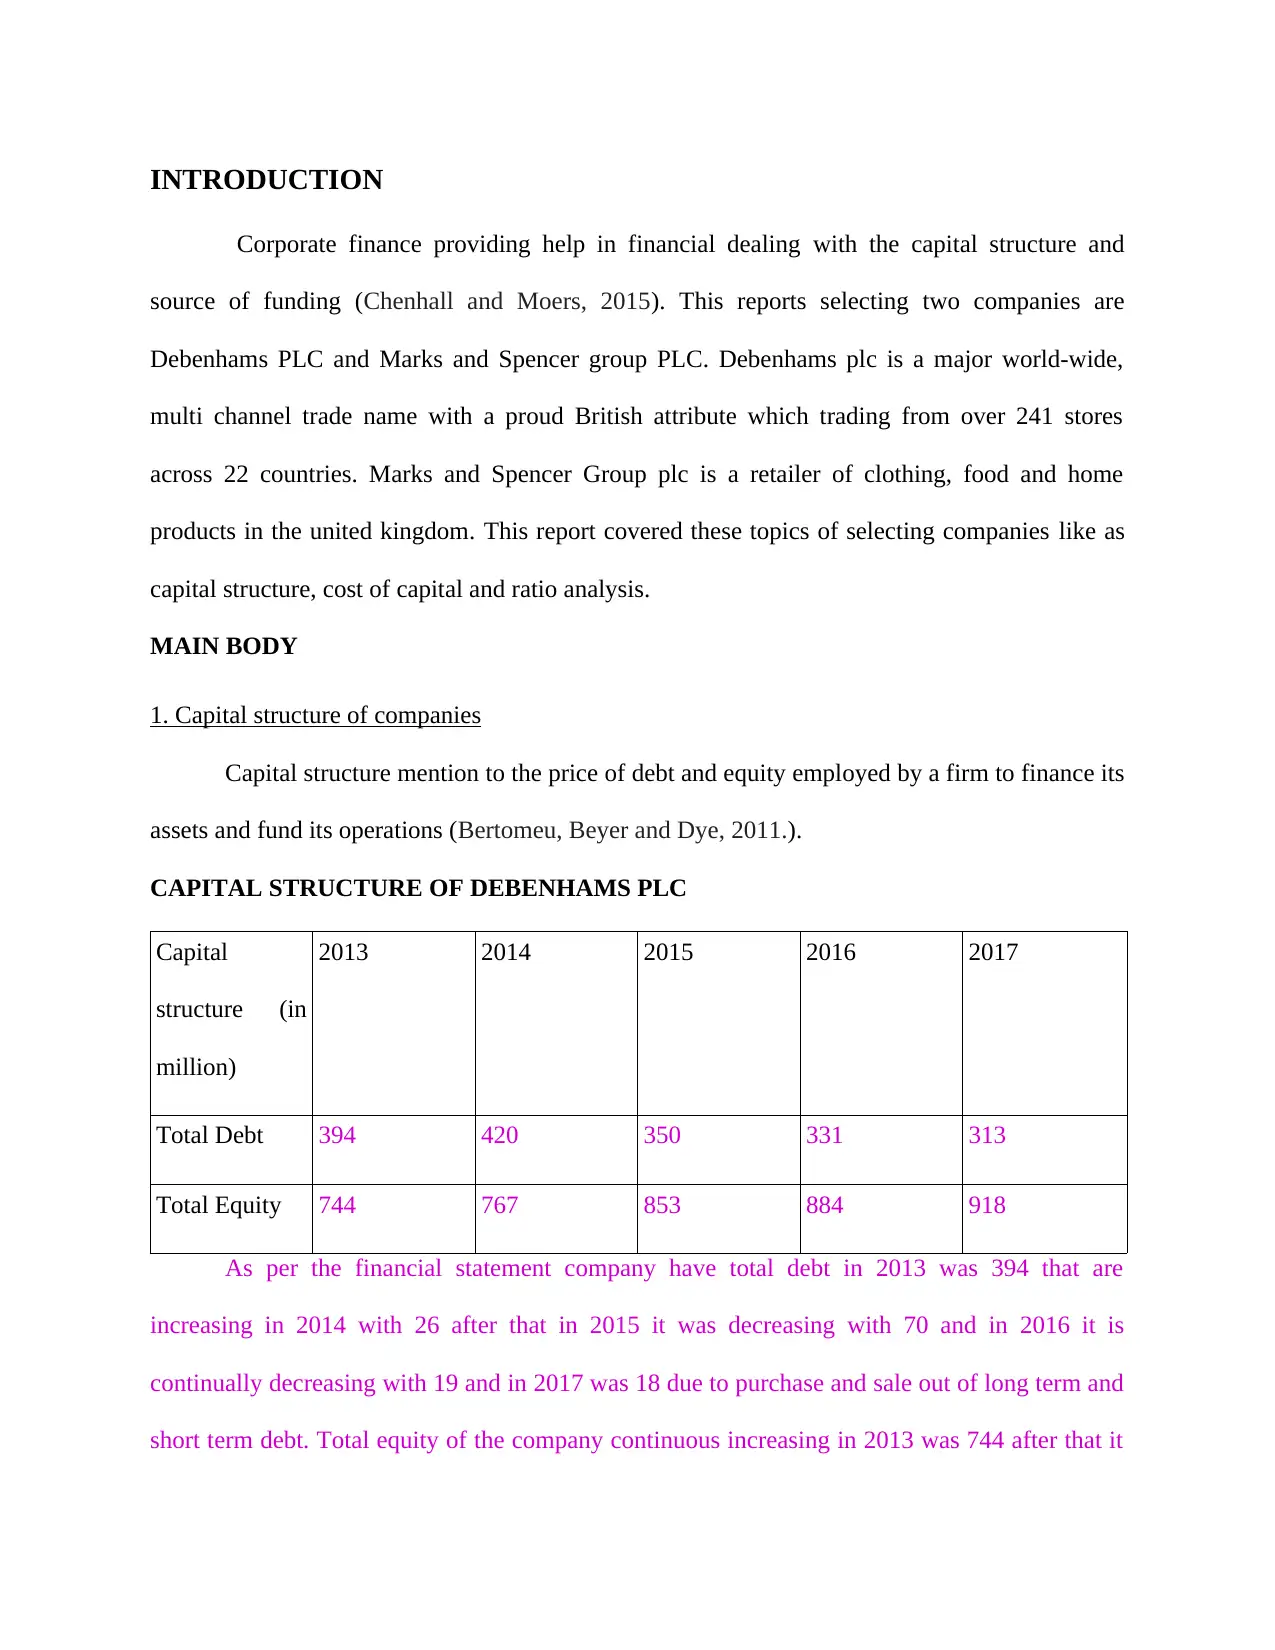
1. Capital structure of companies
Capital structure mention to the price of debt and equity employed by a firm to finance its
assets and fund its operations (Bertomeu, Beyer and Dye, 2011.).
CAPITAL STRUCTURE OF DEBENHAMS PLC
Capital
structure (in
million)
2013 2014 2015 2016 2017
Total Debt 394 420 350 331 313
Total Equity 744 767 853 884 918
As per the financial statement company have total debt in 2013 was 394 that are
increasing in 2014 with 26 after that in 2015 it was decreasing with 70 and in 2016 it is
continually decreasing with 19 and in 2017 was 18 due to purchase and sale out of long term and
short term debt. Total equity of the company continuous increasing in 2013 was 744 after that it
Corporate finance providing help in financial dealing with the capital structure and
source of funding (Chenhall and Moers, 2015). This reports selecting two companies are
Debenhams PLC and Marks and Spencer group PLC. Debenhams plc is a major world-wide,
multi channel trade name with a proud British attribute which trading from over 241 stores
across 22 countries. Marks and Spencer Group plc is a retailer of clothing, food and home
products in the united kingdom. This report covered these topics of selecting companies like as
capital structure, cost of capital and ratio analysis.
MAIN BODY
1. Capital structure of companies
Capital structure mention to the price of debt and equity employed by a firm to finance its
assets and fund its operations (Bertomeu, Beyer and Dye, 2011.).
CAPITAL STRUCTURE OF DEBENHAMS PLC
Capital
structure (in
million)
2013 2014 2015 2016 2017
Total Debt 394 420 350 331 313
Total Equity 744 767 853 884 918
As per the financial statement company have total debt in 2013 was 394 that are
increasing in 2014 with 26 after that in 2015 it was decreasing with 70 and in 2016 it is
continually decreasing with 19 and in 2017 was 18 due to purchase and sale out of long term and
short term debt. Total equity of the company continuous increasing in 2013 was 744 after that it
⊘ This is a preview!⊘
Do you want full access?
Subscribe today to unlock all pages.
Trusted by 1+ million students worldwide
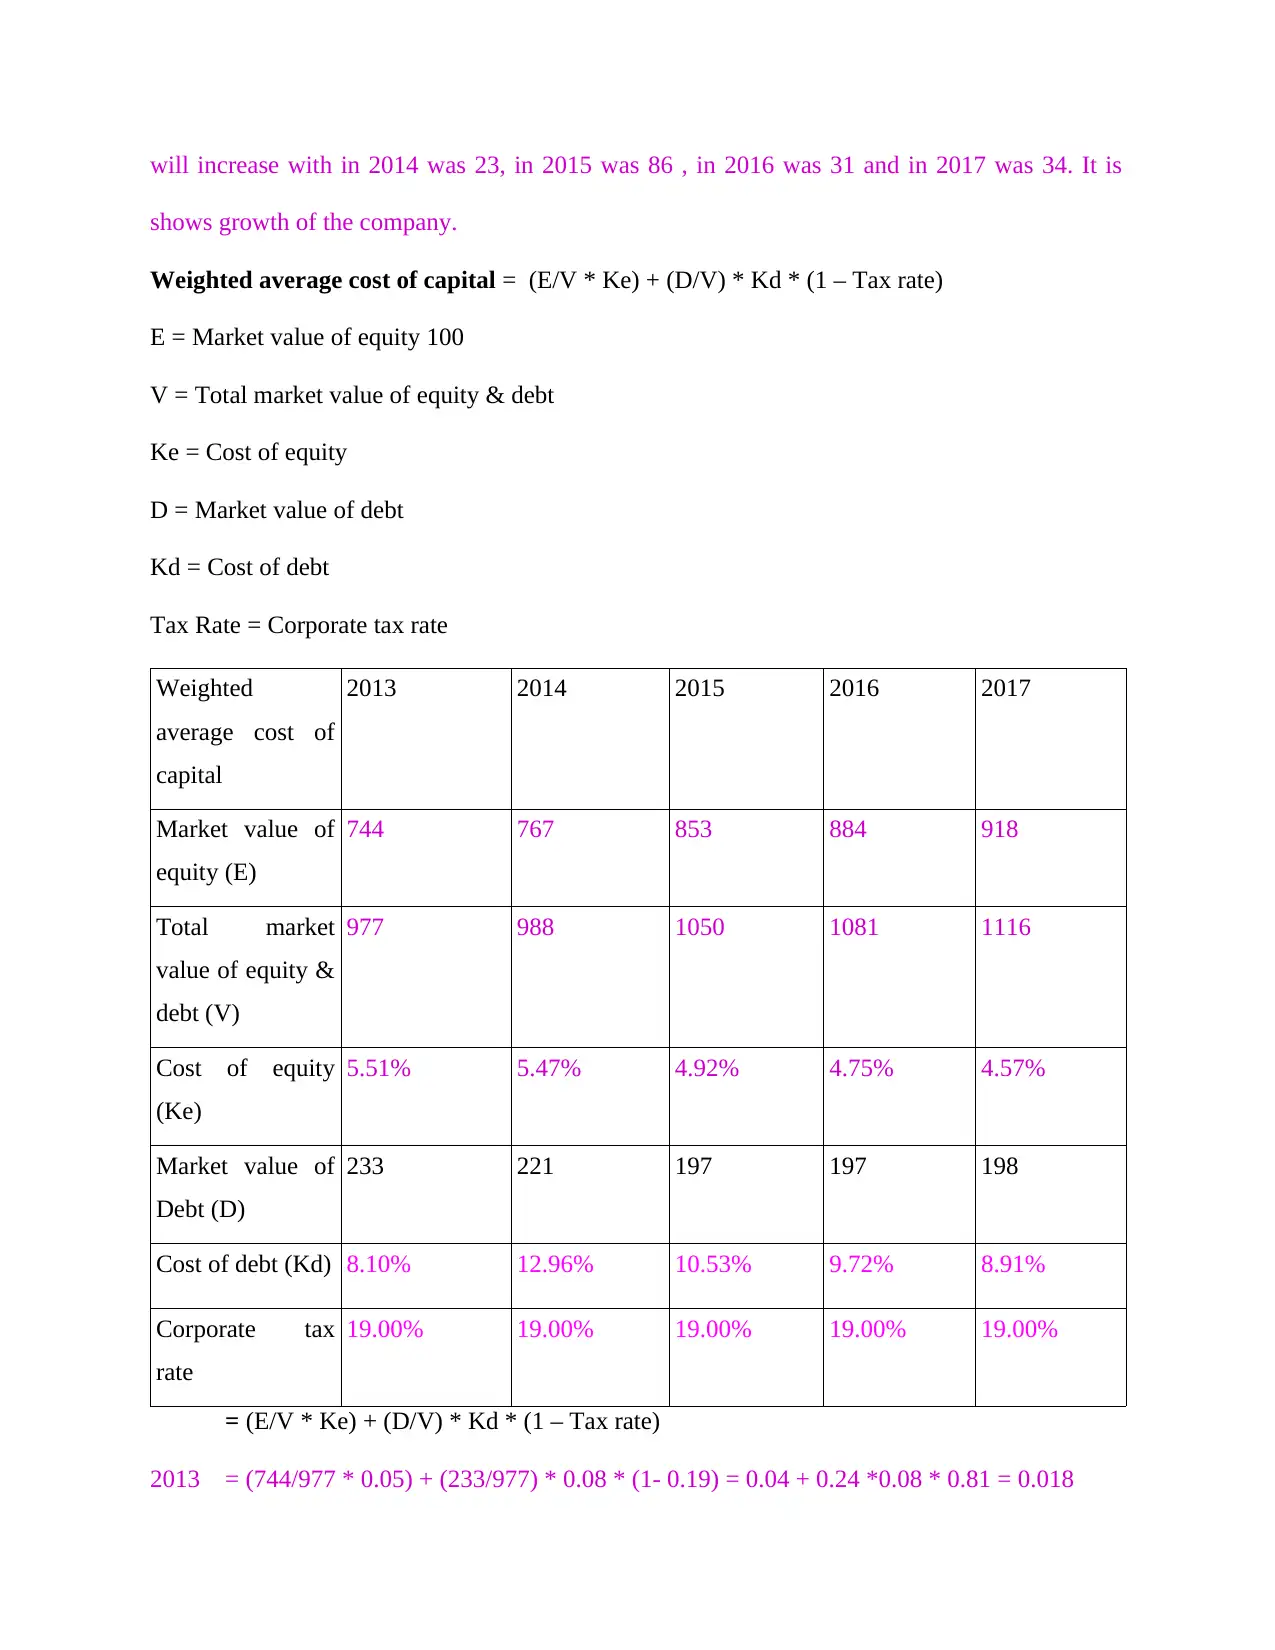
will increase with in 2014 was 23, in 2015 was 86 , in 2016 was 31 and in 2017 was 34. It is
shows growth of the company.
Weighted average cost of capital = (E/V * Ke) + (D/V) * Kd * (1 – Tax rate)
E = Market value of equity 100
V = Total market value of equity & debt
Ke = Cost of equity
D = Market value of debt
Kd = Cost of debt
Tax Rate = Corporate tax rate
Weighted
average cost of
capital
2013 2014 2015 2016 2017
Market value of
equity (E)
744 767 853 884 918
Total market
value of equity &
debt (V)
977 988 1050 1081 1116
Cost of equity
(Ke)
5.51% 5.47% 4.92% 4.75% 4.57%
Market value of
Debt (D)
233 221 197 197 198
Cost of debt (Kd) 8.10% 12.96% 10.53% 9.72% 8.91%
Corporate tax
rate
19.00% 19.00% 19.00% 19.00% 19.00%
= (E/V * Ke) + (D/V) * Kd * (1 – Tax rate)
2013 = (744/977 * 0.05) + (233/977) * 0.08 * (1- 0.19) = 0.04 + 0.24 *0.08 * 0.81 = 0.018
Paraphrase This Document
Need a fresh take? Get an instant paraphrase of this document with our AI Paraphraser
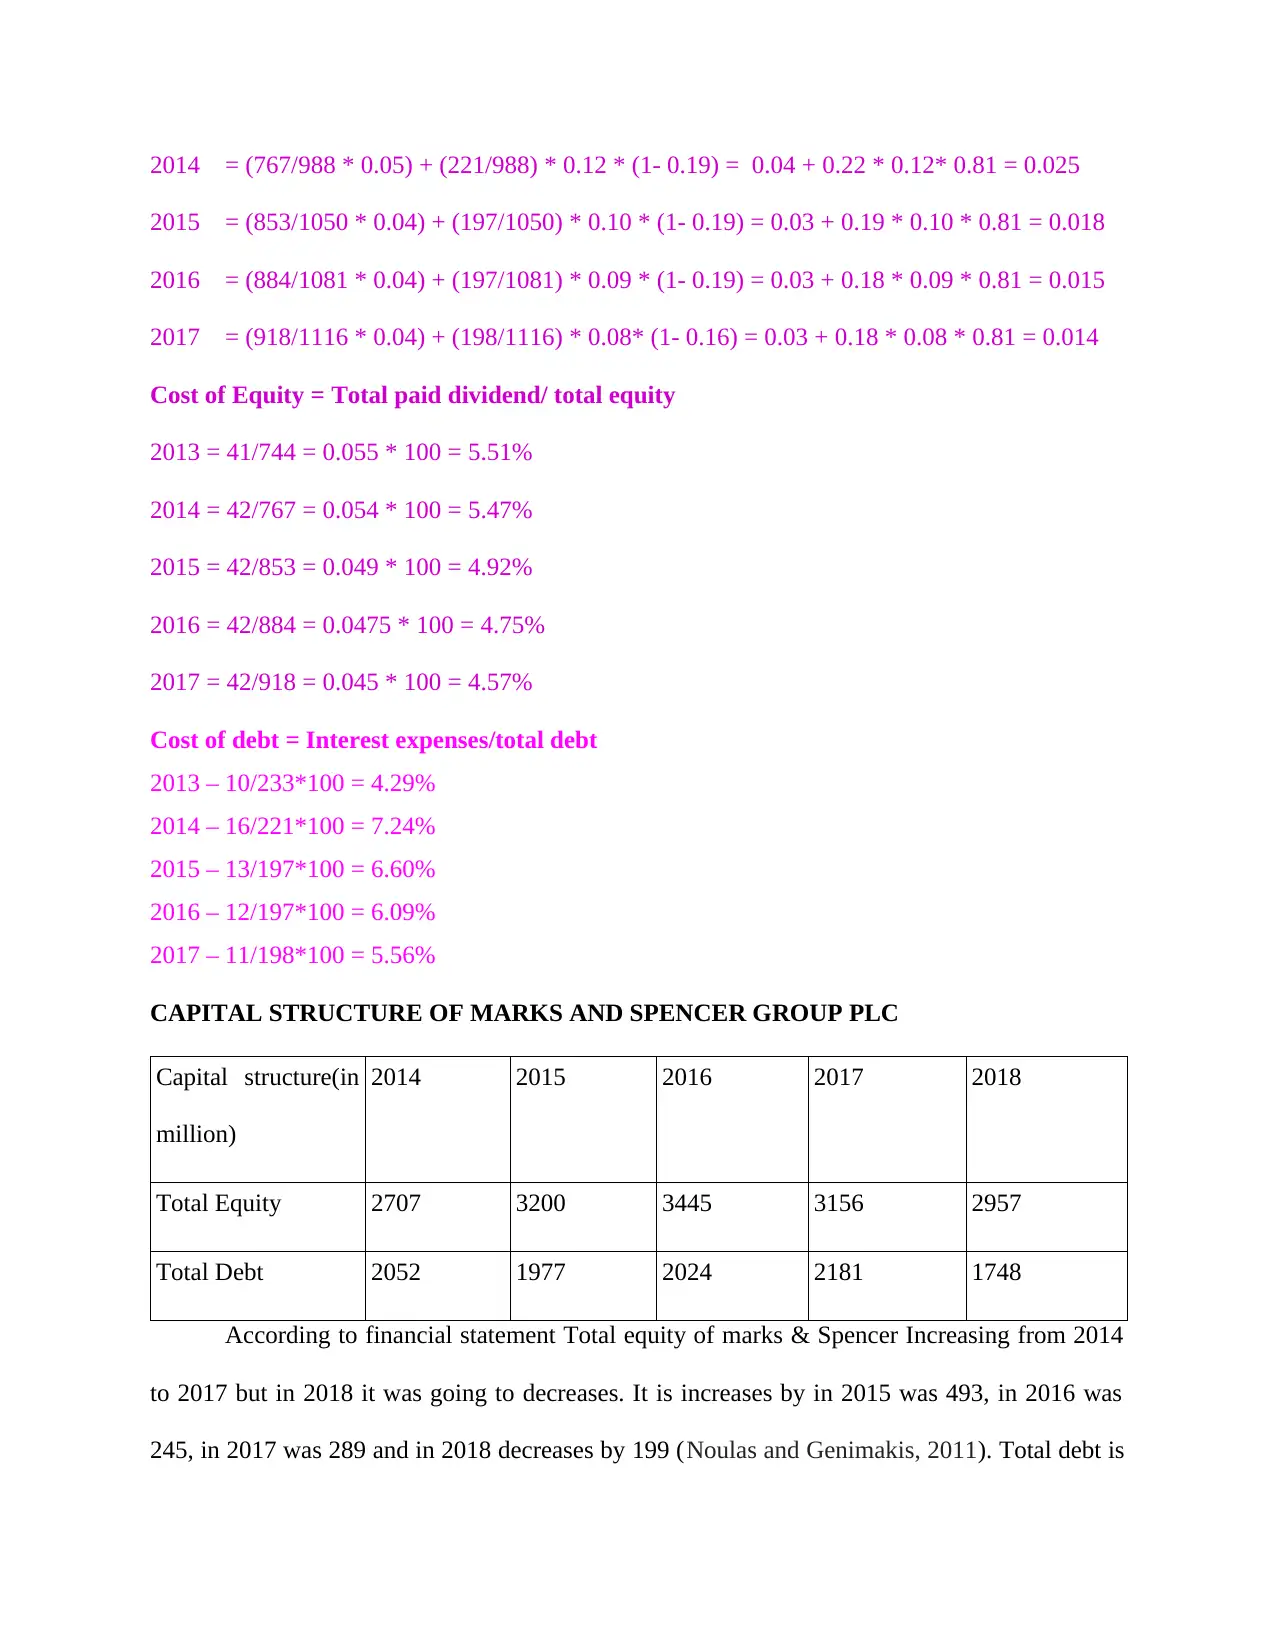
2014 = (767/988 * 0.05) + (221/988) * 0.12 * (1- 0.19) = 0.04 + 0.22 * 0.12* 0.81 = 0.025
2015 = (853/1050 * 0.04) + (197/1050) * 0.10 * (1- 0.19) = 0.03 + 0.19 * 0.10 * 0.81 = 0.018
2016 = (884/1081 * 0.04) + (197/1081) * 0.09 * (1- 0.19) = 0.03 + 0.18 * 0.09 * 0.81 = 0.015
2017 = (918/1116 * 0.04) + (198/1116) * 0.08* (1- 0.16) = 0.03 + 0.18 * 0.08 * 0.81 = 0.014
Cost of Equity = Total paid dividend/ total equity
2013 = 41/744 = 0.055 * 100 = 5.51%
2014 = 42/767 = 0.054 * 100 = 5.47%
2015 = 42/853 = 0.049 * 100 = 4.92%
2016 = 42/884 = 0.0475 * 100 = 4.75%
2017 = 42/918 = 0.045 * 100 = 4.57%
Cost of debt = Interest expenses/total debt
2013 – 10/233*100 = 4.29%
2014 – 16/221*100 = 7.24%
2015 – 13/197*100 = 6.60%
2016 – 12/197*100 = 6.09%
2017 – 11/198*100 = 5.56%
CAPITAL STRUCTURE OF MARKS AND SPENCER GROUP PLC
Capital structure(in
million)
2014 2015 2016 2017 2018
Total Equity 2707 3200 3445 3156 2957
Total Debt 2052 1977 2024 2181 1748
According to financial statement Total equity of marks & Spencer Increasing from 2014
to 2017 but in 2018 it was going to decreases. It is increases by in 2015 was 493, in 2016 was
245, in 2017 was 289 and in 2018 decreases by 199 (Noulas and Genimakis, 2011). Total debt is
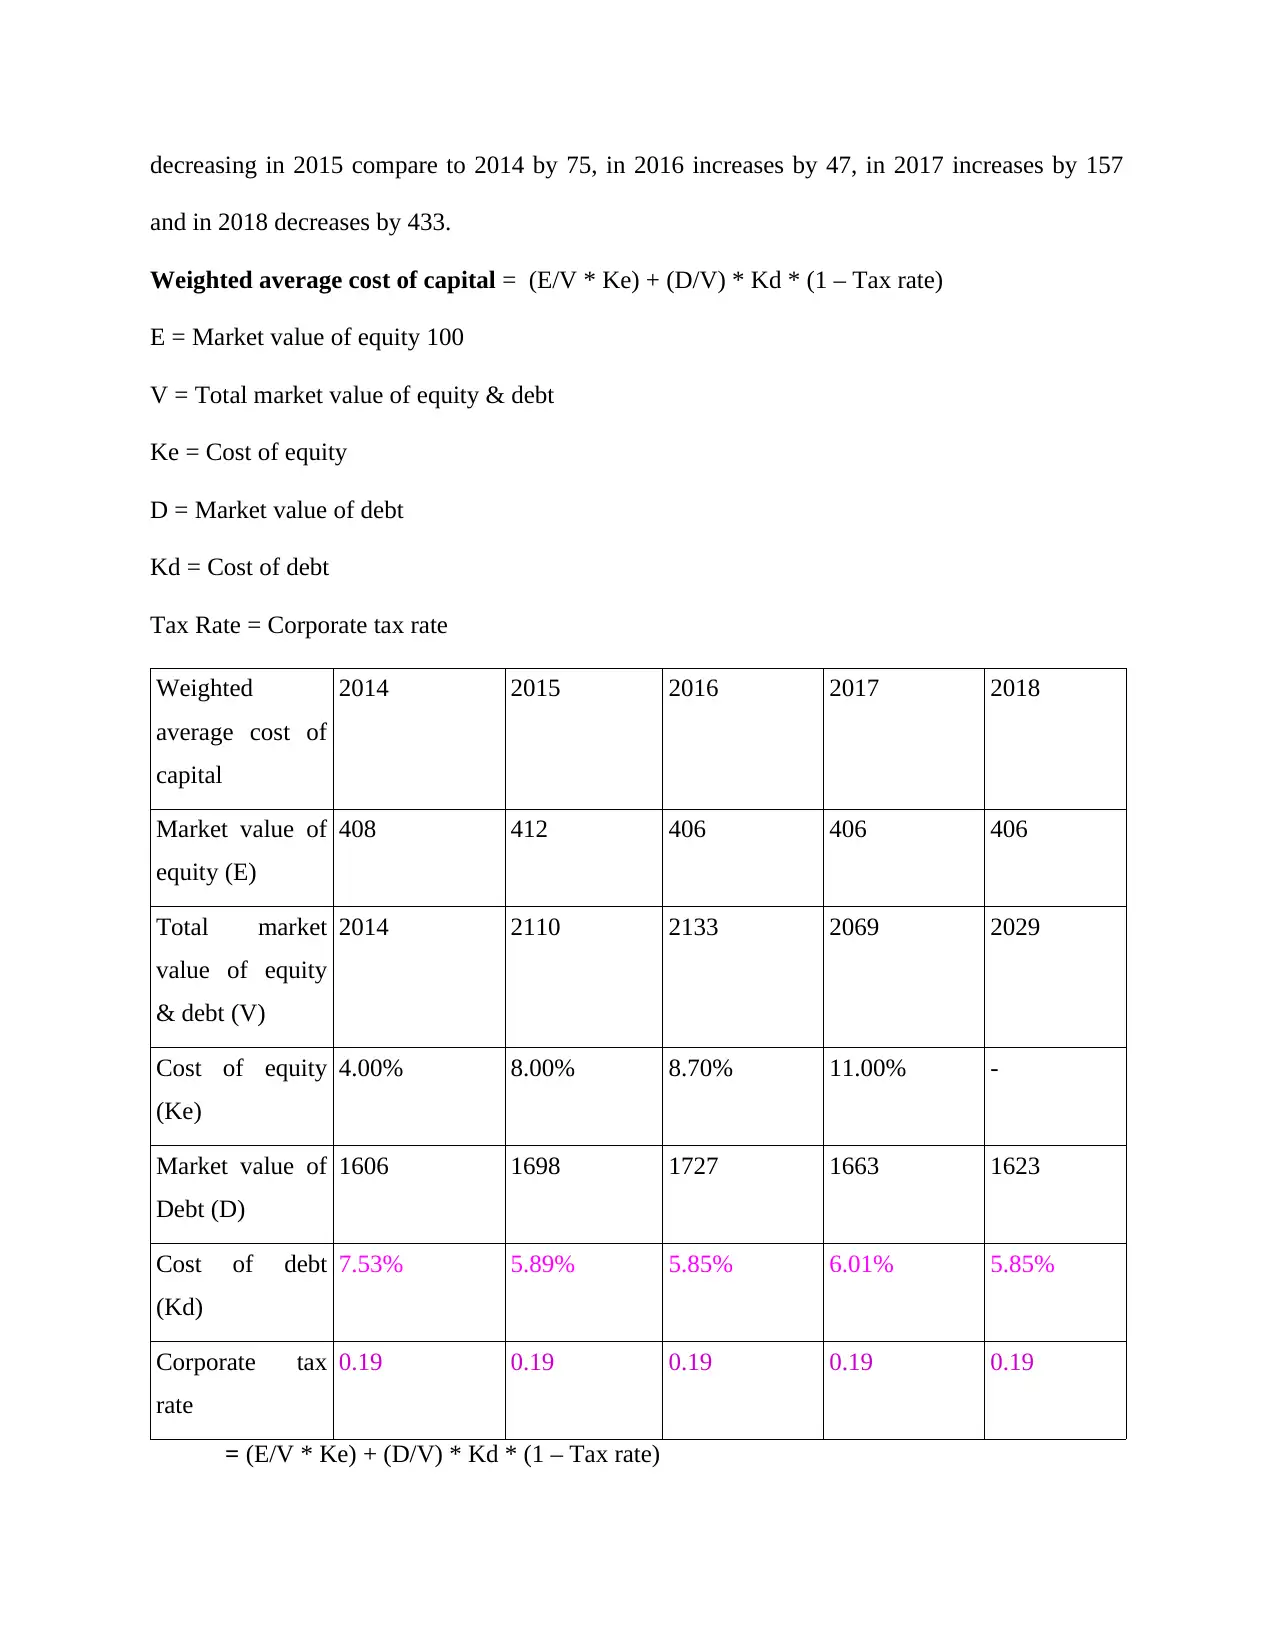
decreasing in 2015 compare to 2014 by 75, in 2016 increases by 47, in 2017 increases by 157
and in 2018 decreases by 433.
Weighted average cost of capital = (E/V * Ke) + (D/V) * Kd * (1 – Tax rate)
E = Market value of equity 100
V = Total market value of equity & debt
Ke = Cost of equity
D = Market value of debt
Kd = Cost of debt
Tax Rate = Corporate tax rate
Weighted
average cost of
capital
2014 2015 2016 2017 2018
Market value of
equity (E)
408 412 406 406 406
Total market
value of equity
& debt (V)
2014 2110 2133 2069 2029
Cost of equity
(Ke)
4.00% 8.00% 8.70% 11.00% -
Market value of
Debt (D)
1606 1698 1727 1663 1623
Cost of debt
(Kd)
7.53% 5.89% 5.85% 6.01% 5.85%
Corporate tax
rate
0.19 0.19 0.19 0.19 0.19
= (E/V * Ke) + (D/V) * Kd * (1 – Tax rate)
⊘ This is a preview!⊘
Do you want full access?
Subscribe today to unlock all pages.
Trusted by 1+ million students worldwide
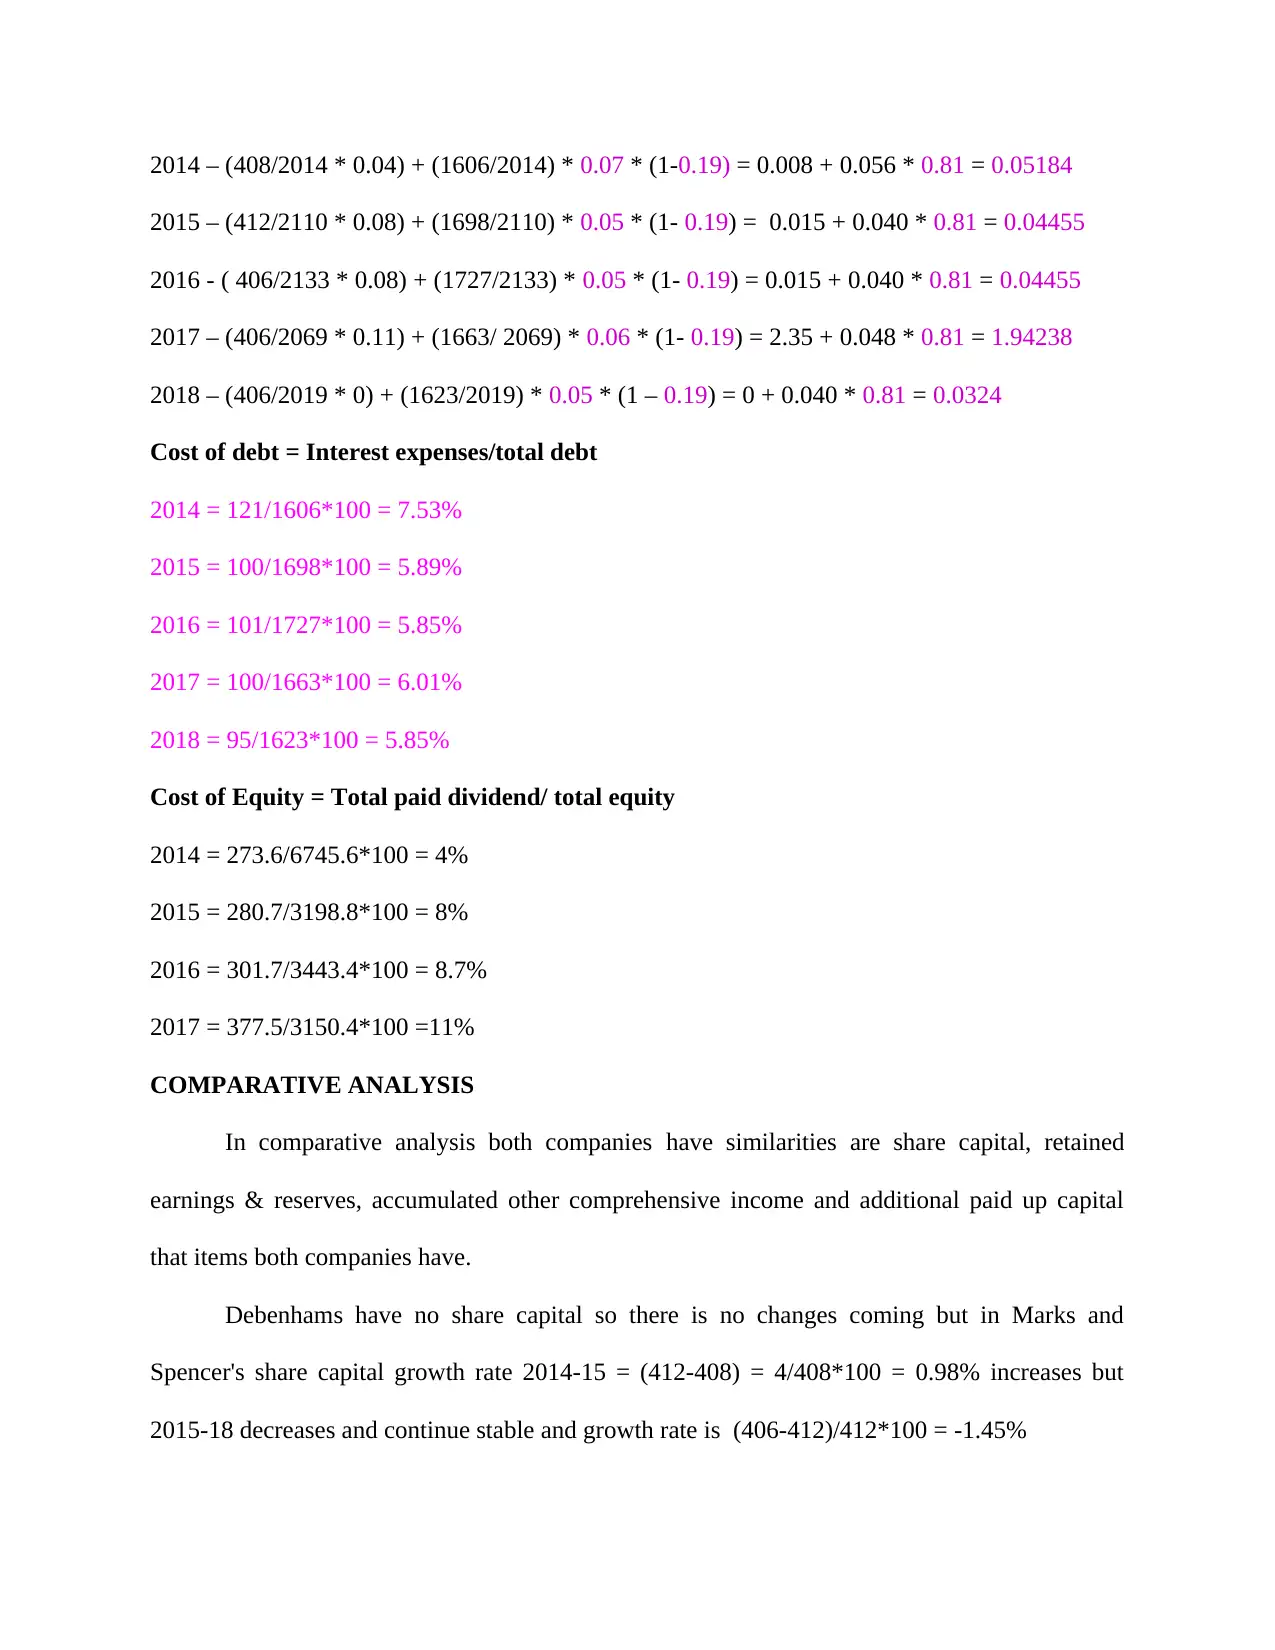
2014 – (408/2014 * 0.04) + (1606/2014) * 0.07 * (1-0.19) = 0.008 + 0.056 * 0.81 = 0.05184
2015 – (412/2110 * 0.08) + (1698/2110) * 0.05 * (1- 0.19) = 0.015 + 0.040 * 0.81 = 0.04455
2016 - ( 406/2133 * 0.08) + (1727/2133) * 0.05 * (1- 0.19) = 0.015 + 0.040 * 0.81 = 0.04455
2017 – (406/2069 * 0.11) + (1663/ 2069) * 0.06 * (1- 0.19) = 2.35 + 0.048 * 0.81 = 1.94238
2018 – (406/2019 * 0) + (1623/2019) * 0.05 * (1 – 0.19) = 0 + 0.040 * 0.81 = 0.0324
Cost of debt = Interest expenses/total debt
2014 = 121/1606*100 = 7.53%
2015 = 100/1698*100 = 5.89%
2016 = 101/1727*100 = 5.85%
2017 = 100/1663*100 = 6.01%
2018 = 95/1623*100 = 5.85%
Cost of Equity = Total paid dividend/ total equity
2014 = 273.6/6745.6*100 = 4%
2015 = 280.7/3198.8*100 = 8%
2016 = 301.7/3443.4*100 = 8.7%
2017 = 377.5/3150.4*100 =11%
COMPARATIVE ANALYSIS
In comparative analysis both companies have similarities are share capital, retained
earnings & reserves, accumulated other comprehensive income and additional paid up capital
that items both companies have.
Debenhams have no share capital so there is no changes coming but in Marks and
Spencer's share capital growth rate 2014-15 = (412-408) = 4/408*100 = 0.98% increases but
2015-18 decreases and continue stable and growth rate is (406-412)/412*100 = -1.45%
Paraphrase This Document
Need a fresh take? Get an instant paraphrase of this document with our AI Paraphraser
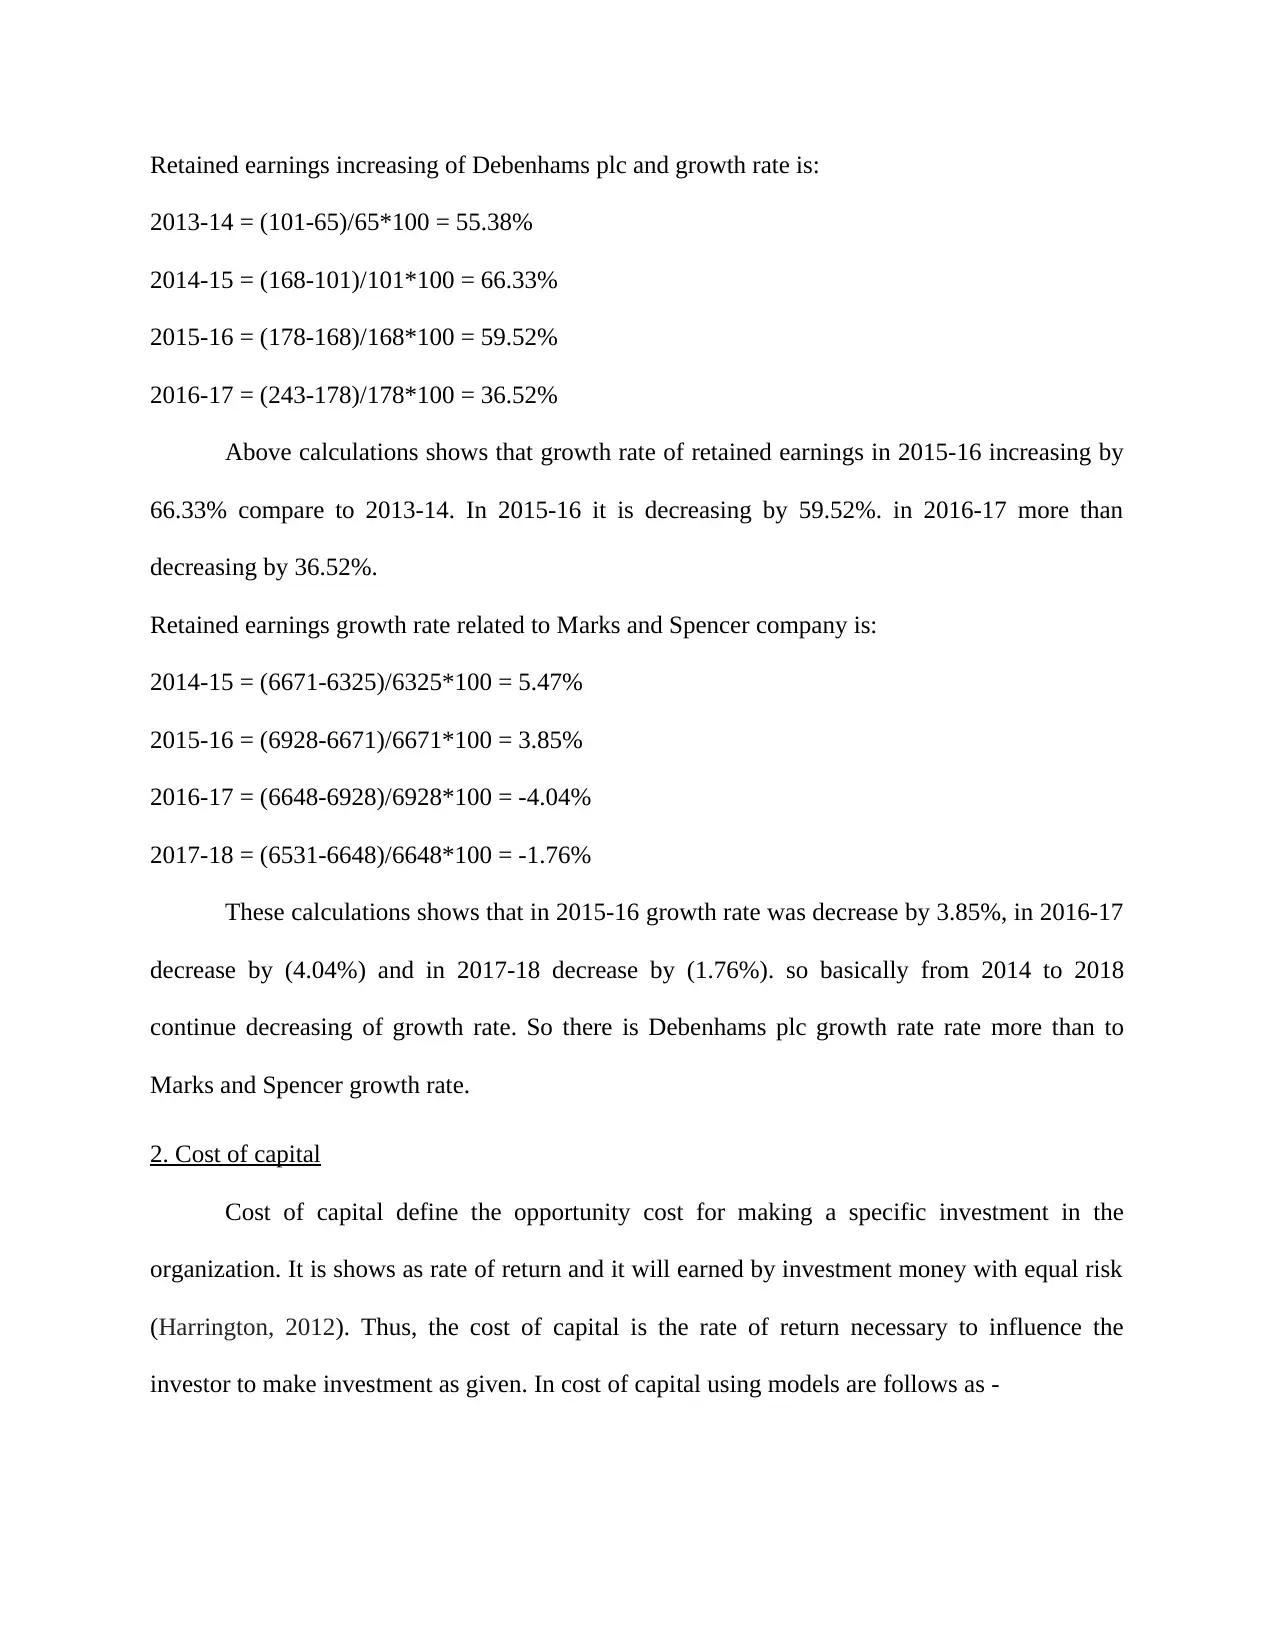
Retained earnings increasing of Debenhams plc and growth rate is:
2013-14 = (101-65)/65*100 = 55.38%
2014-15 = (168-101)/101*100 = 66.33%
2015-16 = (178-168)/168*100 = 59.52%
2016-17 = (243-178)/178*100 = 36.52%
Above calculations shows that growth rate of retained earnings in 2015-16 increasing by
66.33% compare to 2013-14. In 2015-16 it is decreasing by 59.52%. in 2016-17 more than
decreasing by 36.52%.
Retained earnings growth rate related to Marks and Spencer company is:
2014-15 = (6671-6325)/6325*100 = 5.47%
2015-16 = (6928-6671)/6671*100 = 3.85%
2016-17 = (6648-6928)/6928*100 = -4.04%
2017-18 = (6531-6648)/6648*100 = -1.76%
These calculations shows that in 2015-16 growth rate was decrease by 3.85%, in 2016-17
decrease by (4.04%) and in 2017-18 decrease by (1.76%). so basically from 2014 to 2018
continue decreasing of growth rate. So there is Debenhams plc growth rate rate more than to
Marks and Spencer growth rate.
2. Cost of capital
Cost of capital define the opportunity cost for making a specific investment in the
organization. It is shows as rate of return and it will earned by investment money with equal risk
(Harrington, 2012). Thus, the cost of capital is the rate of return necessary to influence the
investor to make investment as given. In cost of capital using models are follows as -
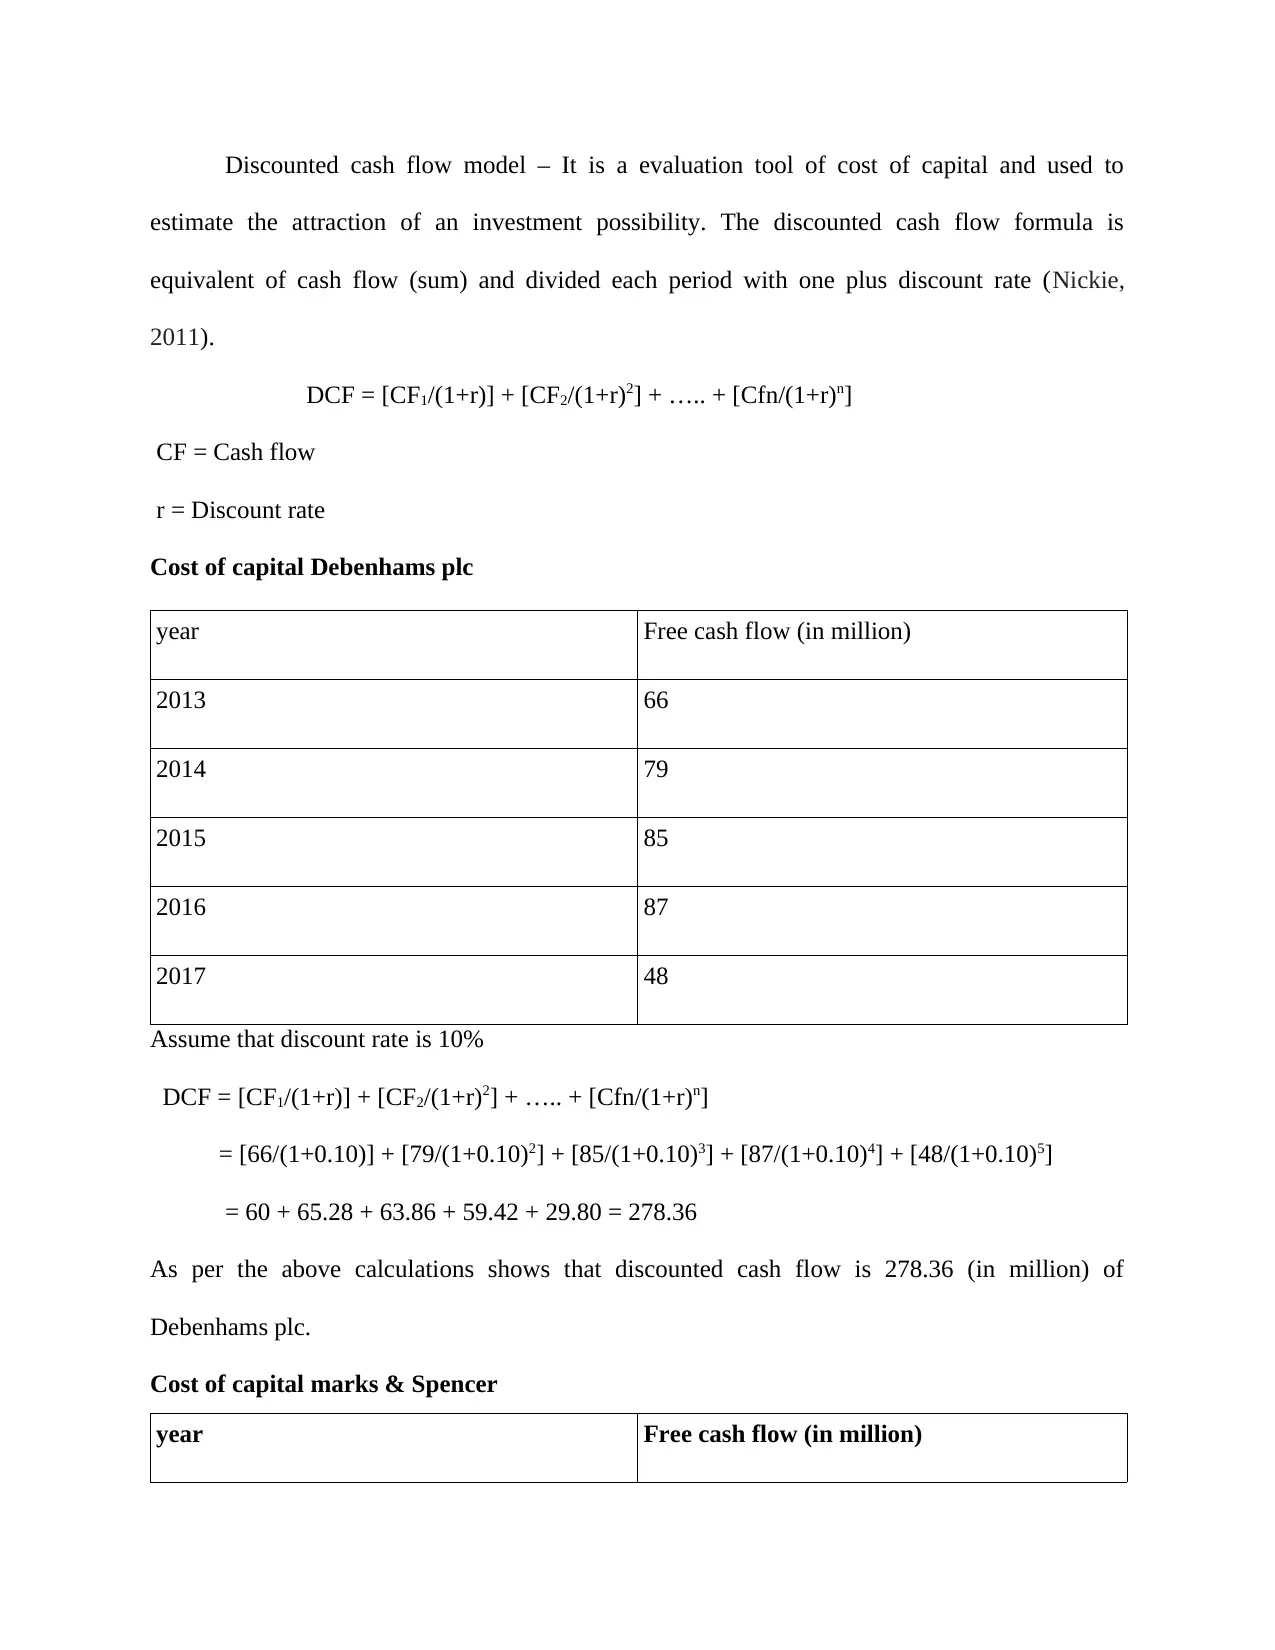
Discounted cash flow model – It is a evaluation tool of cost of capital and used to
estimate the attraction of an investment possibility. The discounted cash flow formula is
equivalent of cash flow (sum) and divided each period with one plus discount rate (Nickie,
2011).
DCF = [CF1/(1+r)] + [CF2/(1+r)2] + ….. + [Cfn/(1+r)n]
CF = Cash flow
r = Discount rate
Cost of capital Debenhams plc
year Free cash flow (in million)
2013 66
2014 79
2015 85
2016 87
2017 48
Assume that discount rate is 10%
DCF = [CF1/(1+r)] + [CF2/(1+r)2] + ….. + [Cfn/(1+r)n]
= [66/(1+0.10)] + [79/(1+0.10)2] + [85/(1+0.10)3] + [87/(1+0.10)4] + [48/(1+0.10)5]
= 60 + 65.28 + 63.86 + 59.42 + 29.80 = 278.36
As per the above calculations shows that discounted cash flow is 278.36 (in million) of
Debenhams plc.
Cost of capital marks & Spencer
year Free cash flow (in million)
⊘ This is a preview!⊘
Do you want full access?
Subscribe today to unlock all pages.
Trusted by 1+ million students worldwide
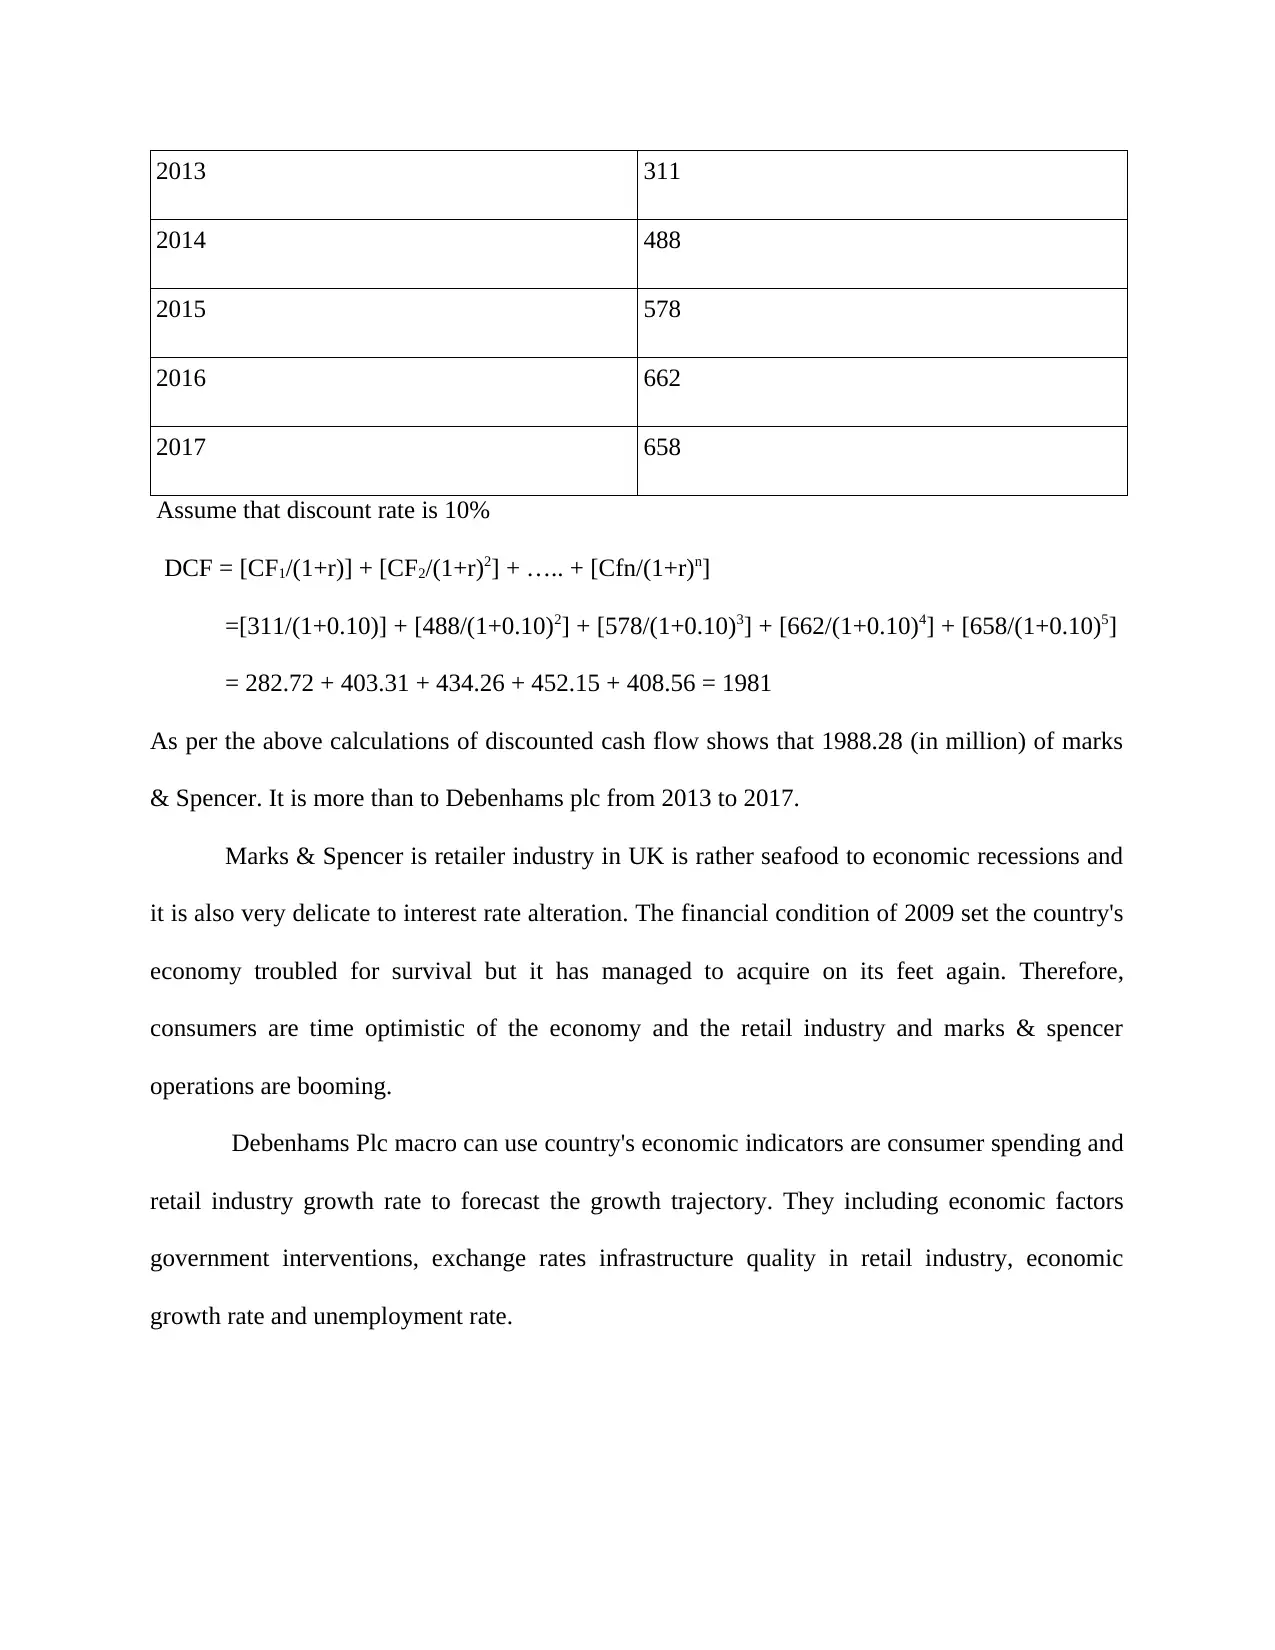
2013 311
2014 488
2015 578
2016 662
2017 658
Assume that discount rate is 10%
DCF = [CF1/(1+r)] + [CF2/(1+r)2] + ….. + [Cfn/(1+r)n]
=[311/(1+0.10)] + [488/(1+0.10)2] + [578/(1+0.10)3] + [662/(1+0.10)4] + [658/(1+0.10)5]
= 282.72 + 403.31 + 434.26 + 452.15 + 408.56 = 1981
As per the above calculations of discounted cash flow shows that 1988.28 (in million) of marks
& Spencer. It is more than to Debenhams plc from 2013 to 2017.
Marks & Spencer is retailer industry in UK is rather seafood to economic recessions and
it is also very delicate to interest rate alteration. The financial condition of 2009 set the country's
economy troubled for survival but it has managed to acquire on its feet again. Therefore,
consumers are time optimistic of the economy and the retail industry and marks & spencer
operations are booming.
Debenhams Plc macro can use country's economic indicators are consumer spending and
retail industry growth rate to forecast the growth trajectory. They including economic factors
government interventions, exchange rates infrastructure quality in retail industry, economic
growth rate and unemployment rate.
Paraphrase This Document
Need a fresh take? Get an instant paraphrase of this document with our AI Paraphraser
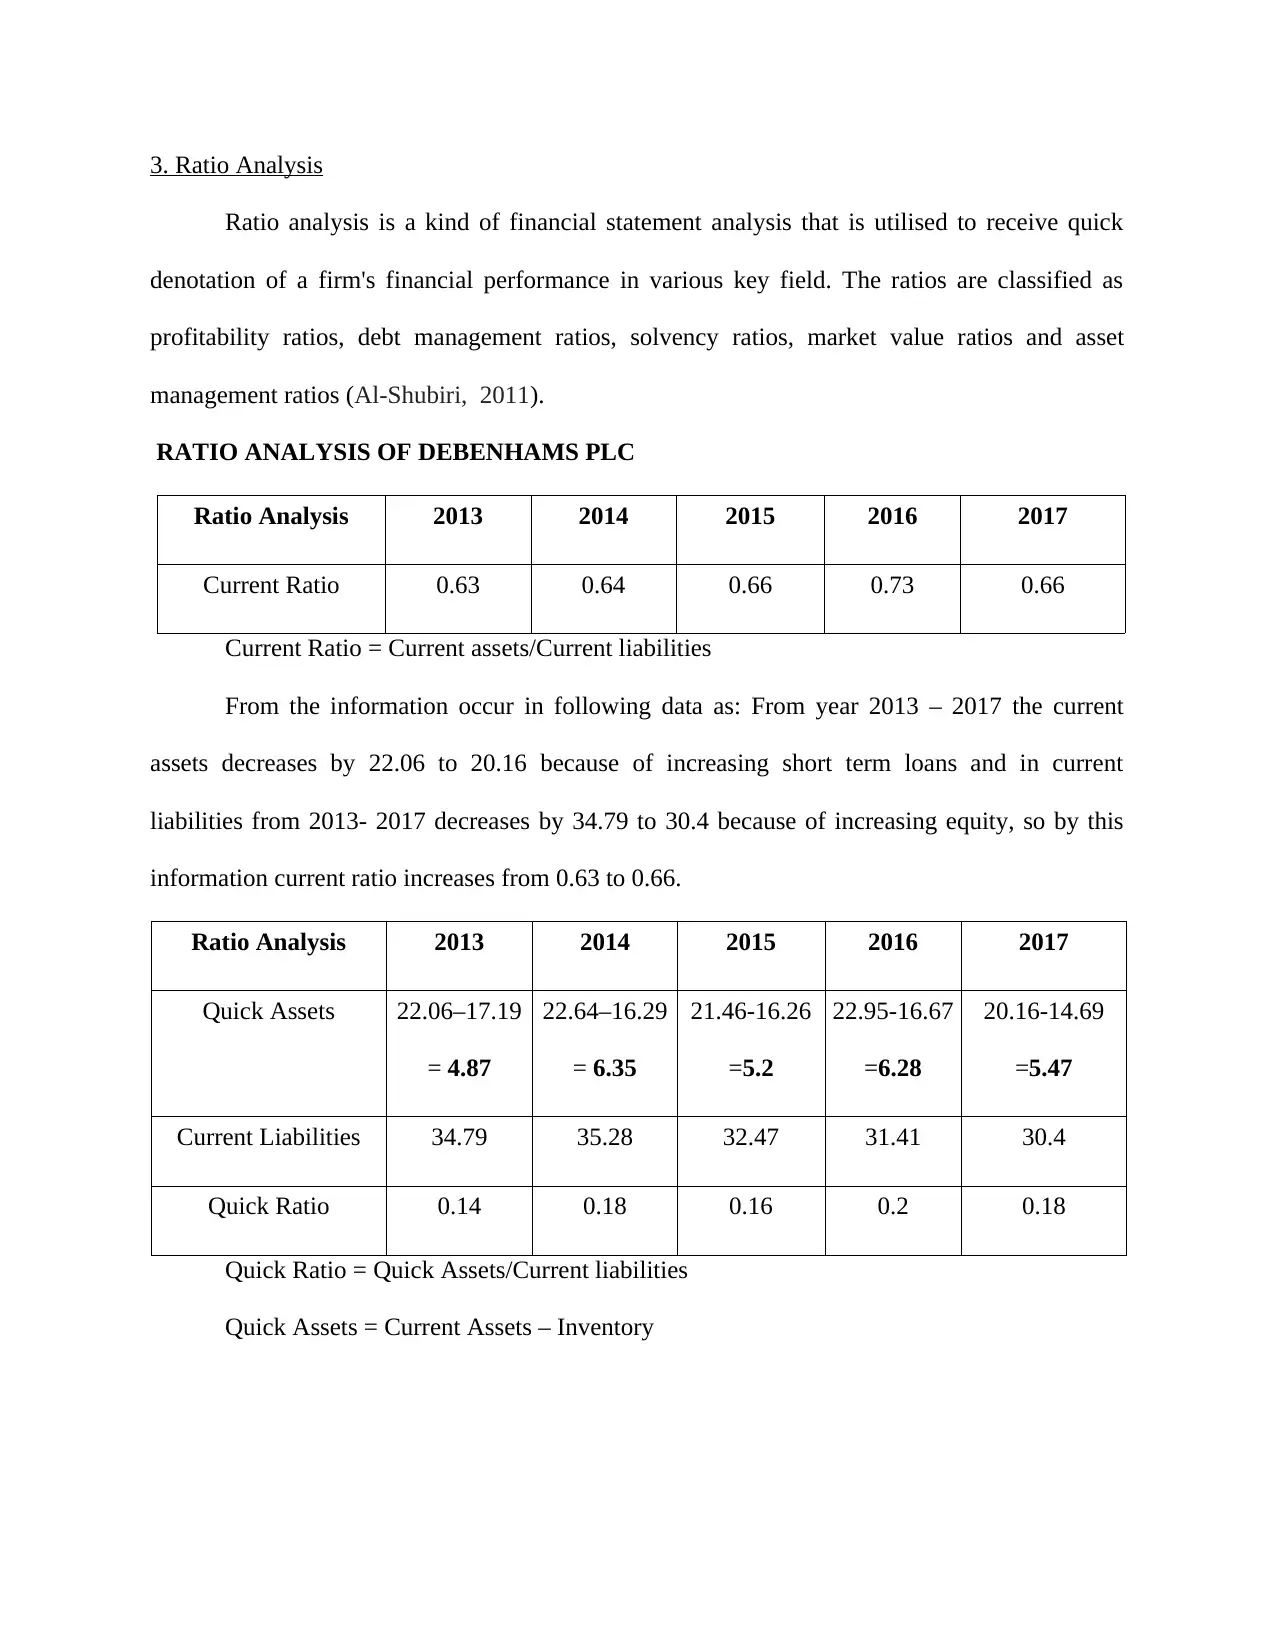
3. Ratio Analysis
Ratio analysis is a kind of financial statement analysis that is utilised to receive quick
denotation of a firm's financial performance in various key field. The ratios are classified as
profitability ratios, debt management ratios, solvency ratios, market value ratios and asset
management ratios (Al-Shubiri, 2011).
RATIO ANALYSIS OF DEBENHAMS PLC
Ratio Analysis 2013 2014 2015 2016 2017
Current Ratio 0.63 0.64 0.66 0.73 0.66
Current Ratio = Current assets/Current liabilities
From the information occur in following data as: From year 2013 – 2017 the current
assets decreases by 22.06 to 20.16 because of increasing short term loans and in current
liabilities from 2013- 2017 decreases by 34.79 to 30.4 because of increasing equity, so by this
information current ratio increases from 0.63 to 0.66.
Ratio Analysis 2013 2014 2015 2016 2017
Quick Assets 22.06–17.19
= 4.87
22.64–16.29
= 6.35
21.46-16.26
=5.2
22.95-16.67
=6.28
20.16-14.69
=5.47
Current Liabilities 34.79 35.28 32.47 31.41 30.4
Quick Ratio 0.14 0.18 0.16 0.2 0.18
Quick Ratio = Quick Assets/Current liabilities
Quick Assets = Current Assets – Inventory
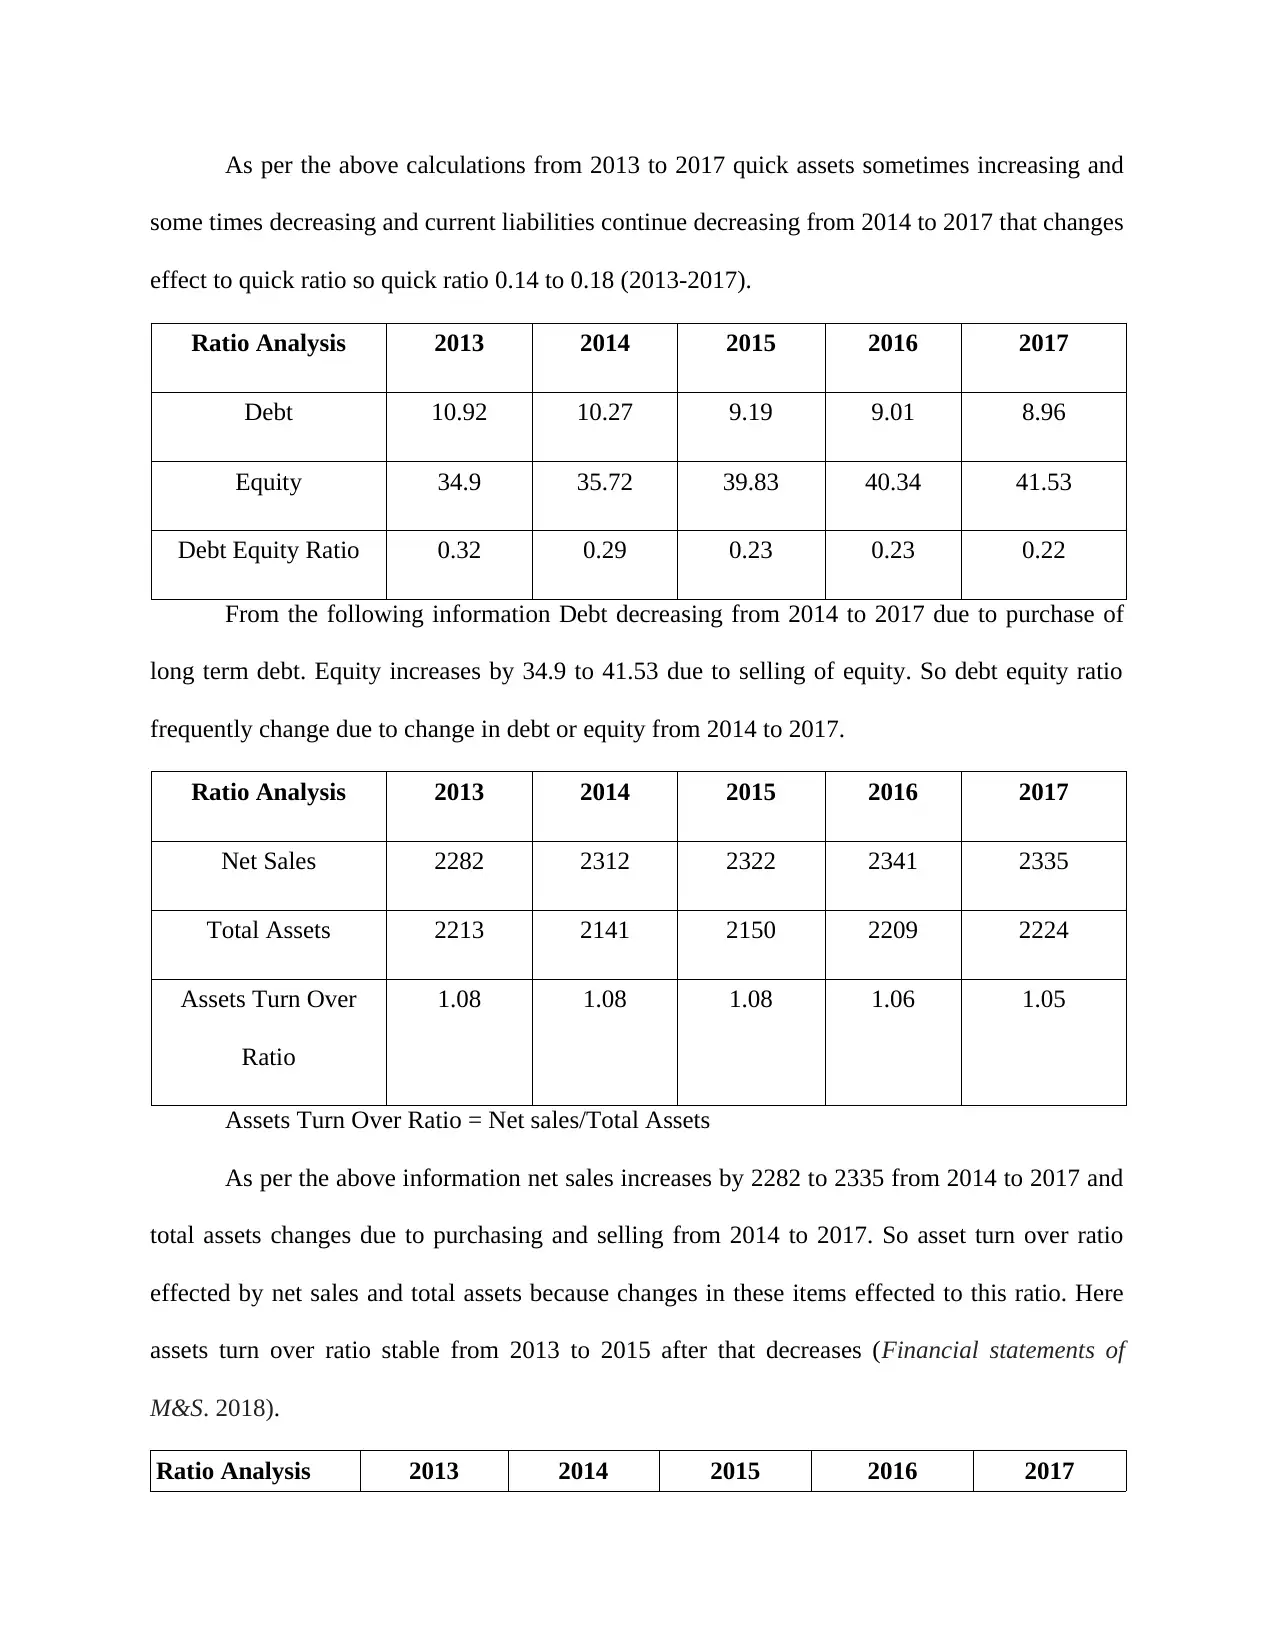
As per the above calculations from 2013 to 2017 quick assets sometimes increasing and
some times decreasing and current liabilities continue decreasing from 2014 to 2017 that changes
effect to quick ratio so quick ratio 0.14 to 0.18 (2013-2017).
Ratio Analysis 2013 2014 2015 2016 2017
Debt 10.92 10.27 9.19 9.01 8.96
Equity 34.9 35.72 39.83 40.34 41.53
Debt Equity Ratio 0.32 0.29 0.23 0.23 0.22
From the following information Debt decreasing from 2014 to 2017 due to purchase of
long term debt. Equity increases by 34.9 to 41.53 due to selling of equity. So debt equity ratio
frequently change due to change in debt or equity from 2014 to 2017.
Ratio Analysis 2013 2014 2015 2016 2017
Net Sales 2282 2312 2322 2341 2335
Total Assets 2213 2141 2150 2209 2224
Assets Turn Over
Ratio
1.08 1.08 1.08 1.06 1.05
Assets Turn Over Ratio = Net sales/Total Assets
As per the above information net sales increases by 2282 to 2335 from 2014 to 2017 and
total assets changes due to purchasing and selling from 2014 to 2017. So asset turn over ratio
effected by net sales and total assets because changes in these items effected to this ratio. Here
assets turn over ratio stable from 2013 to 2015 after that decreases (Financial statements of
M&S. 2018).
Ratio Analysis 2013 2014 2015 2016 2017
⊘ This is a preview!⊘
Do you want full access?
Subscribe today to unlock all pages.
Trusted by 1+ million students worldwide
1 out of 14
Related Documents


Your All-in-One AI-Powered Toolkit for Academic Success.
+13062052269
info@desklib.com
Available 24*7 on WhatsApp / Email
![[object Object]](/_next/static/media/star-bottom.7253800d.svg)
Unlock your academic potential
Copyright © 2020–2026 A2Z Services. All Rights Reserved. Developed and managed by ZUCOL.