Debt to Equity Ratio Analysis: Firm A vs. Competitors

Verified

Added on  2022/08/27

|5
|723
|18
Report
AI Summary
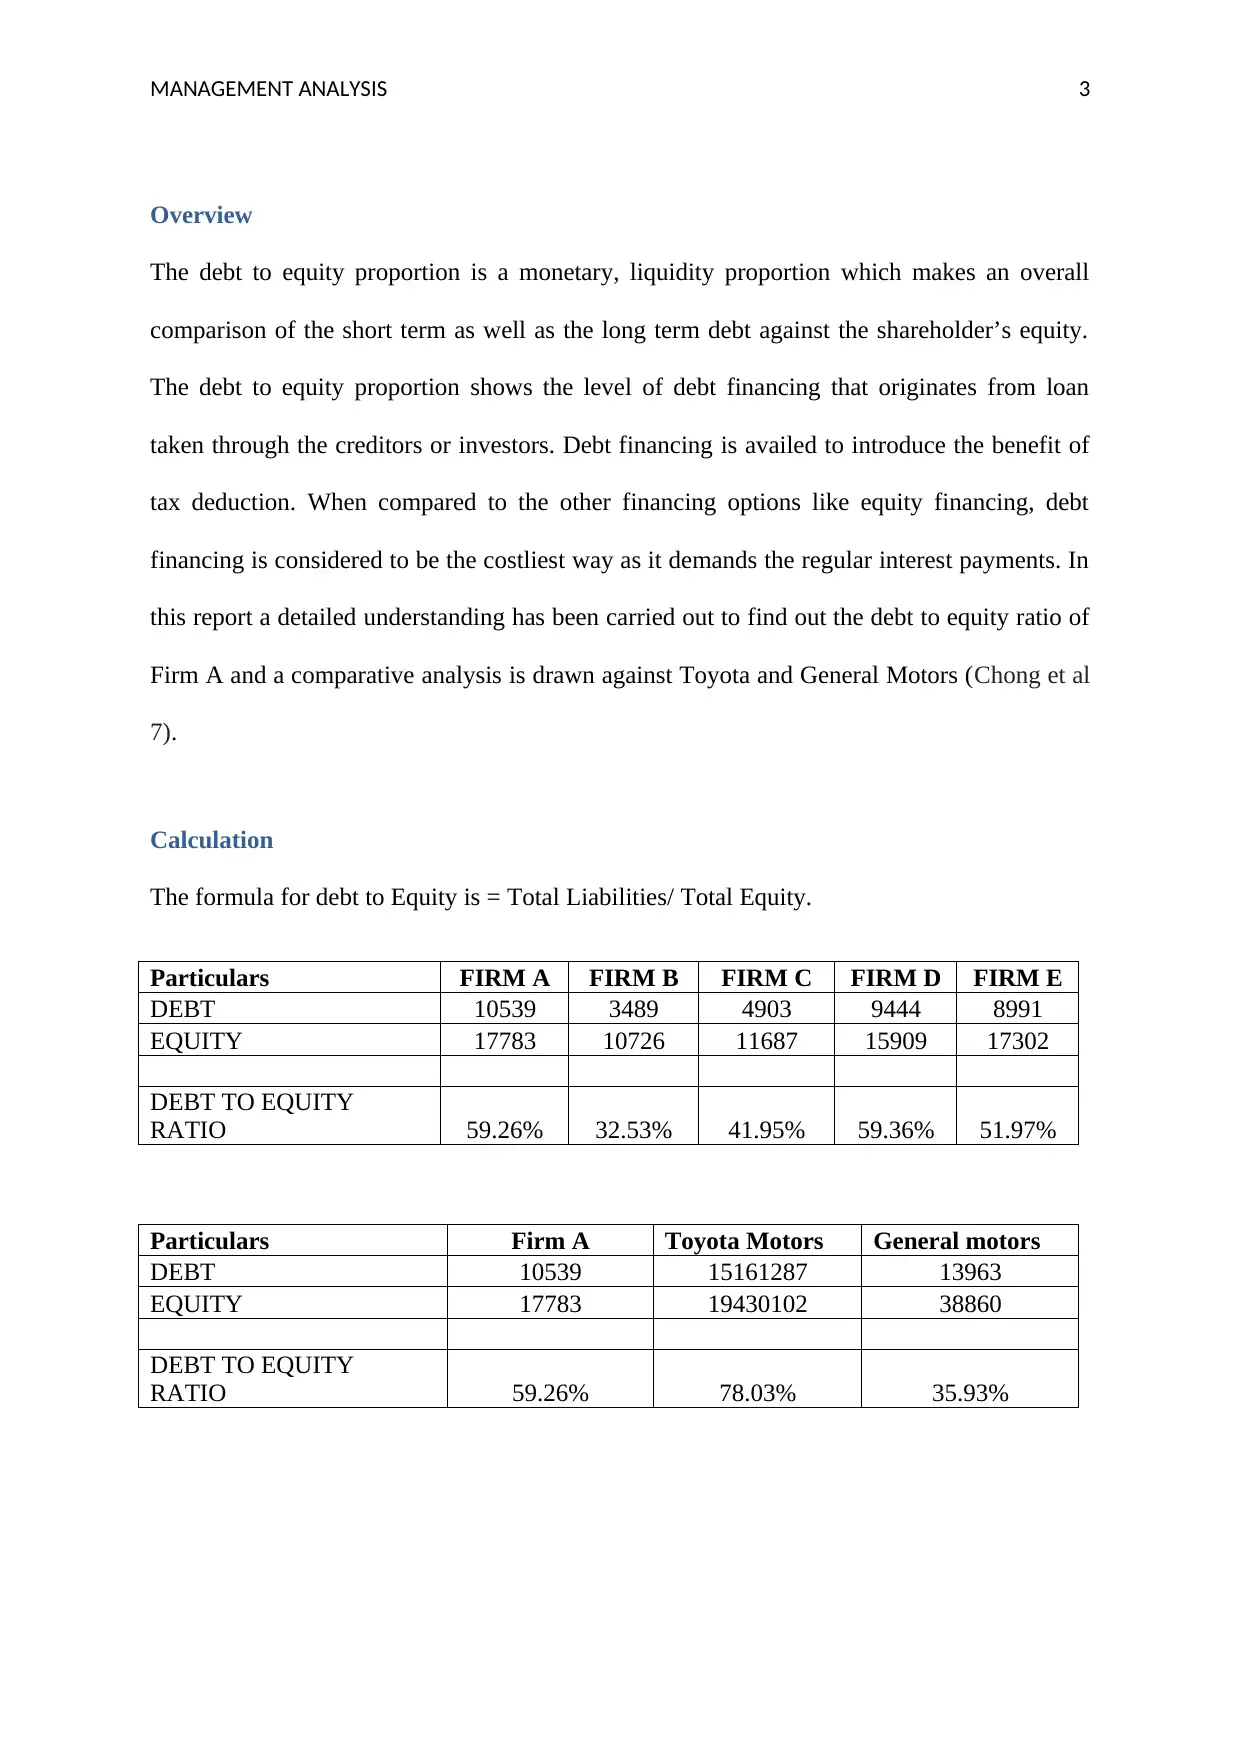
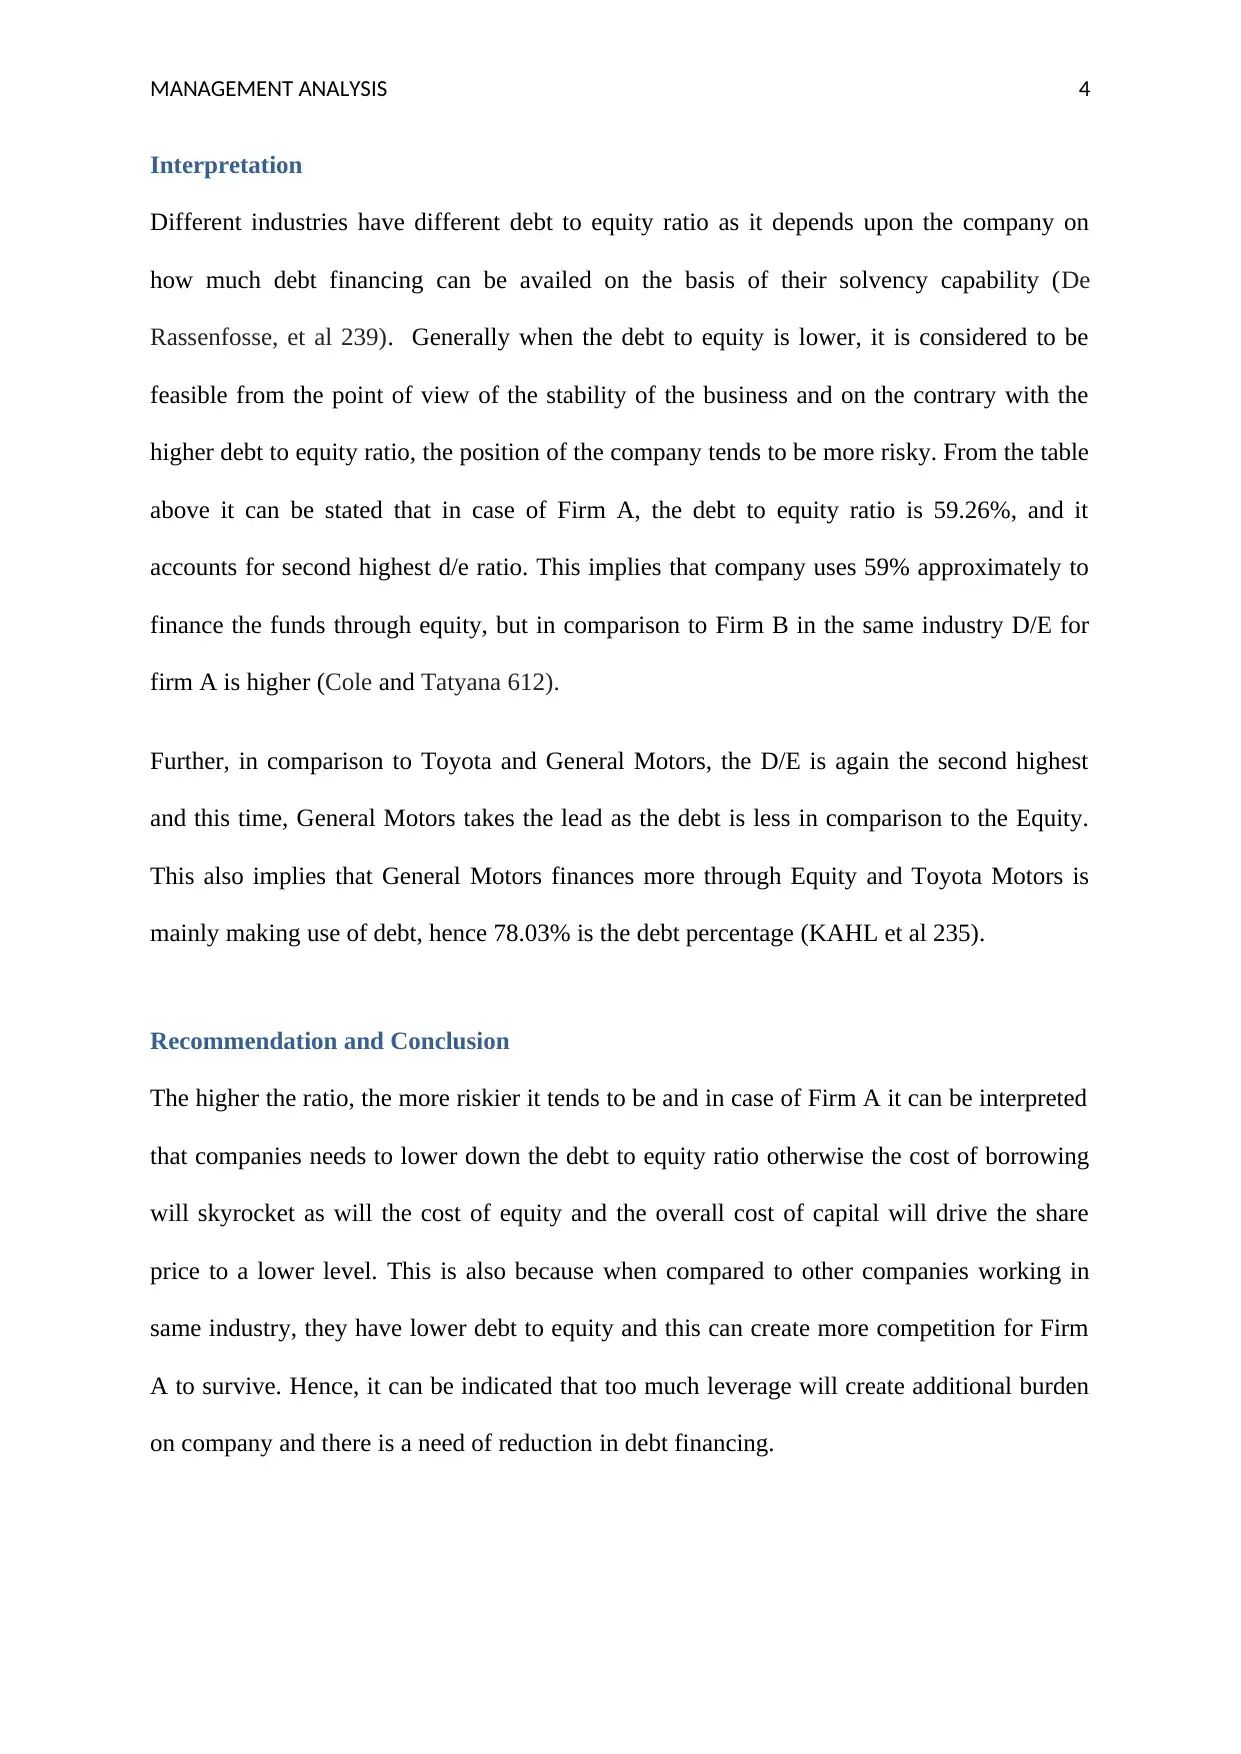
This report provides a comprehensive analysis of the debt to equity ratio, a crucial financial metric used to assess a company's financial leverage and risk. The analysis begins with an overview of the debt to equity ratio, explaining its significance in comparing short-term and long-term debt against shareholder equity. The report calculates the debt to equity ratios for Firm A and several other firms. The study compares Firm A's ratio with those of Toyota and General Motors, offering insights into their respective financing strategies. The interpretation section discusses the implications of different debt to equity ratios across various industries and provides a comparative analysis of the firms. The report concludes with recommendations for Firm A, emphasizing the need to manage its debt levels to maintain financial stability and competitiveness. The references include several academic sources that support the analysis and findings.
Document Page
Running Head: MANAGEMENT ANALYSIS 1
MANAGEMENT ANALYSIS
tabler-icon-diamond-filled.svg

Paraphrase This Document

Need a fresh take? Get an instant paraphrase of this document with our AI Paraphraser
Document Page
MANAGEMENT ANALYSIS 2
Table of Contents
Overview....................................................................................................................................3
Calculation.................................................................................................................................3
Interpretation..............................................................................................................................3
Recommendation and Conclusion..............................................................................................4
References..................................................................................................................................5
Document Page
MANAGEMENT ANALYSIS 3
Overview
The debt to equity proportion is a monetary, liquidity proportion which makes an overall
comparison of the short term as well as the long term debt against the shareholder’s equity.
The debt to equity proportion shows the level of debt financing that originates from loan
taken through the creditors or investors. Debt financing is availed to introduce the benefit of
tax deduction. When compared to the other financing options like equity financing, debt
financing is considered to be the costliest way as it demands the regular interest payments. In
this report a detailed understanding has been carried out to find out the debt to equity ratio of
Firm A and a comparative analysis is drawn against Toyota and General Motors (Chong et al
7).
Calculation
The formula for debt to Equity is = Total Liabilities/ Total Equity.
Particulars FIRM A FIRM B FIRM C FIRM D FIRM E
DEBT 10539 3489 4903 9444 8991
EQUITY 17783 10726 11687 15909 17302
DEBT TO EQUITY
RATIO 59.26% 32.53% 41.95% 59.36% 51.97%
Particulars Firm A Toyota Motors General motors
DEBT 10539 15161287 13963
EQUITY 17783 19430102 38860
DEBT TO EQUITY
RATIO 59.26% 78.03% 35.93%
Document Page
MANAGEMENT ANALYSIS 4
Interpretation
Different industries have different debt to equity ratio as it depends upon the company on
how much debt financing can be availed on the basis of their solvency capability (De
Rassenfosse, et al 239). Generally when the debt to equity is lower, it is considered to be
feasible from the point of view of the stability of the business and on the contrary with the
higher debt to equity ratio, the position of the company tends to be more risky. From the table
above it can be stated that in case of Firm A, the debt to equity ratio is 59.26%, and it
accounts for second highest d/e ratio. This implies that company uses 59% approximately to
finance the funds through equity, but in comparison to Firm B in the same industry D/E for
firm A is higher (Cole and Tatyana 612).
Further, in comparison to Toyota and General Motors, the D/E is again the second highest
and this time, General Motors takes the lead as the debt is less in comparison to the Equity.
This also implies that General Motors finances more through Equity and Toyota Motors is
mainly making use of debt, hence 78.03% is the debt percentage (KAHL et al 235).
Recommendation and Conclusion
The higher the ratio, the more riskier it tends to be and in case of Firm A it can be interpreted
that companies needs to lower down the debt to equity ratio otherwise the cost of borrowing
will skyrocket as will the cost of equity and the overall cost of capital will drive the share
price to a lower level. This is also because when compared to other companies working in
same industry, they have lower debt to equity and this can create more competition for Firm
A to survive. Hence, it can be indicated that too much leverage will create additional burden
on company and there is a need of reduction in debt financing.
tabler-icon-diamond-filled.svg

Paraphrase This Document

Need a fresh take? Get an instant paraphrase of this document with our AI Paraphraser
Document Page
MANAGEMENT ANALYSIS 5
References
Chong, Joon, and Karen Miller. "Tax treatment of excessive debt financing under
review." Tax Breaks Newsletter 2018.395 (2018): 7-8.
Cole, Rebel A., and Tatyana Sokolyk. "Debt financing, survival, and growth of start-up
firms." Journal of Corporate Finance 50 (2018): 609-625.
De Rassenfosse, Gaétan, and Timo Fischer. "Venture debt financing: Determinants of the
lending decision." Strategic Entrepreneurship Journal 10.3 (2016): 235-256.
KAHL, MATTHIAS et al. "Short-Term Debt As Bridge Financing: Evidence From The
Commercial Paper Market". The Journal Of Finance, vol 70, no. 1, 2015, 211-255.
chevron_up_icon
1 out of 5
circle_padding
hide_on_mobile
zoom_out_icon
[object Object]