Edith Cowan University ECF6102 Statistics Assignment, Semester 1, 2020

Verified

Added on  2022/08/01

|7
|624
|1
Homework Assignment
AI Summary
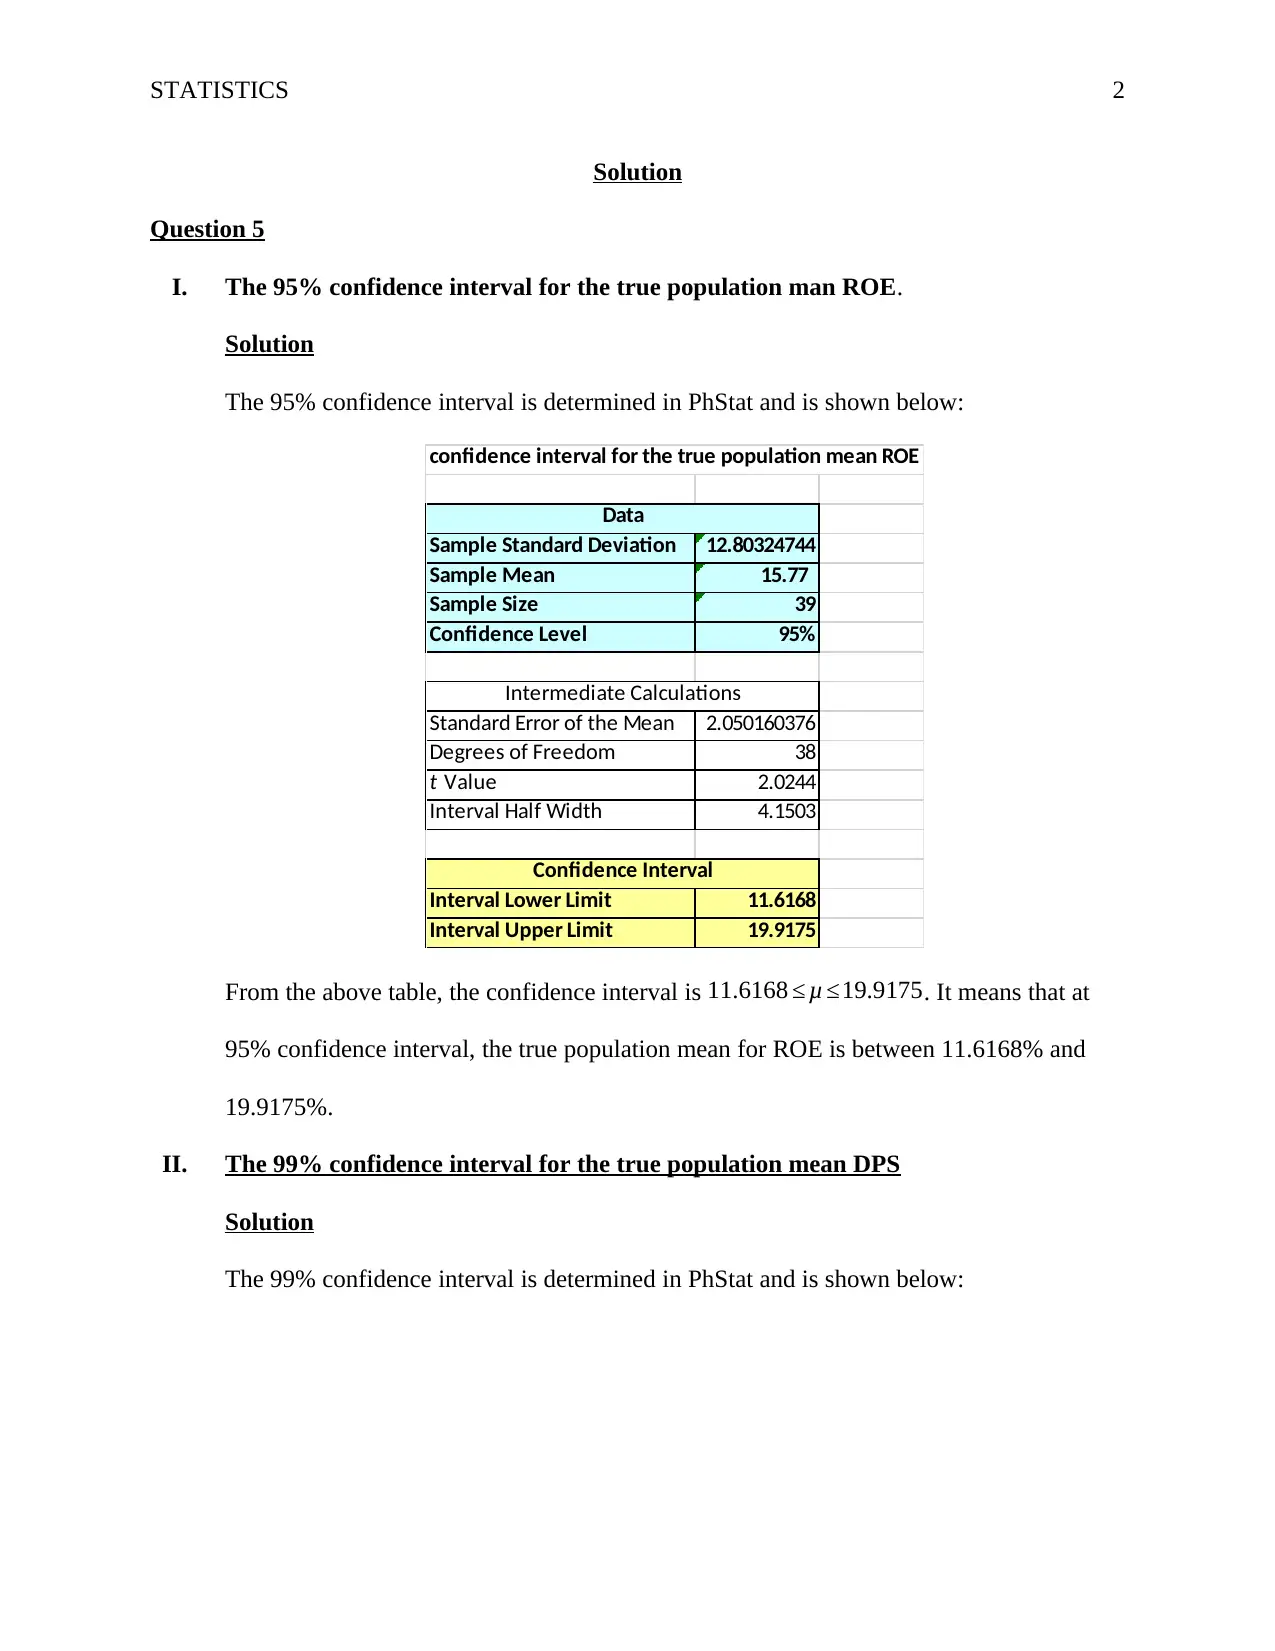
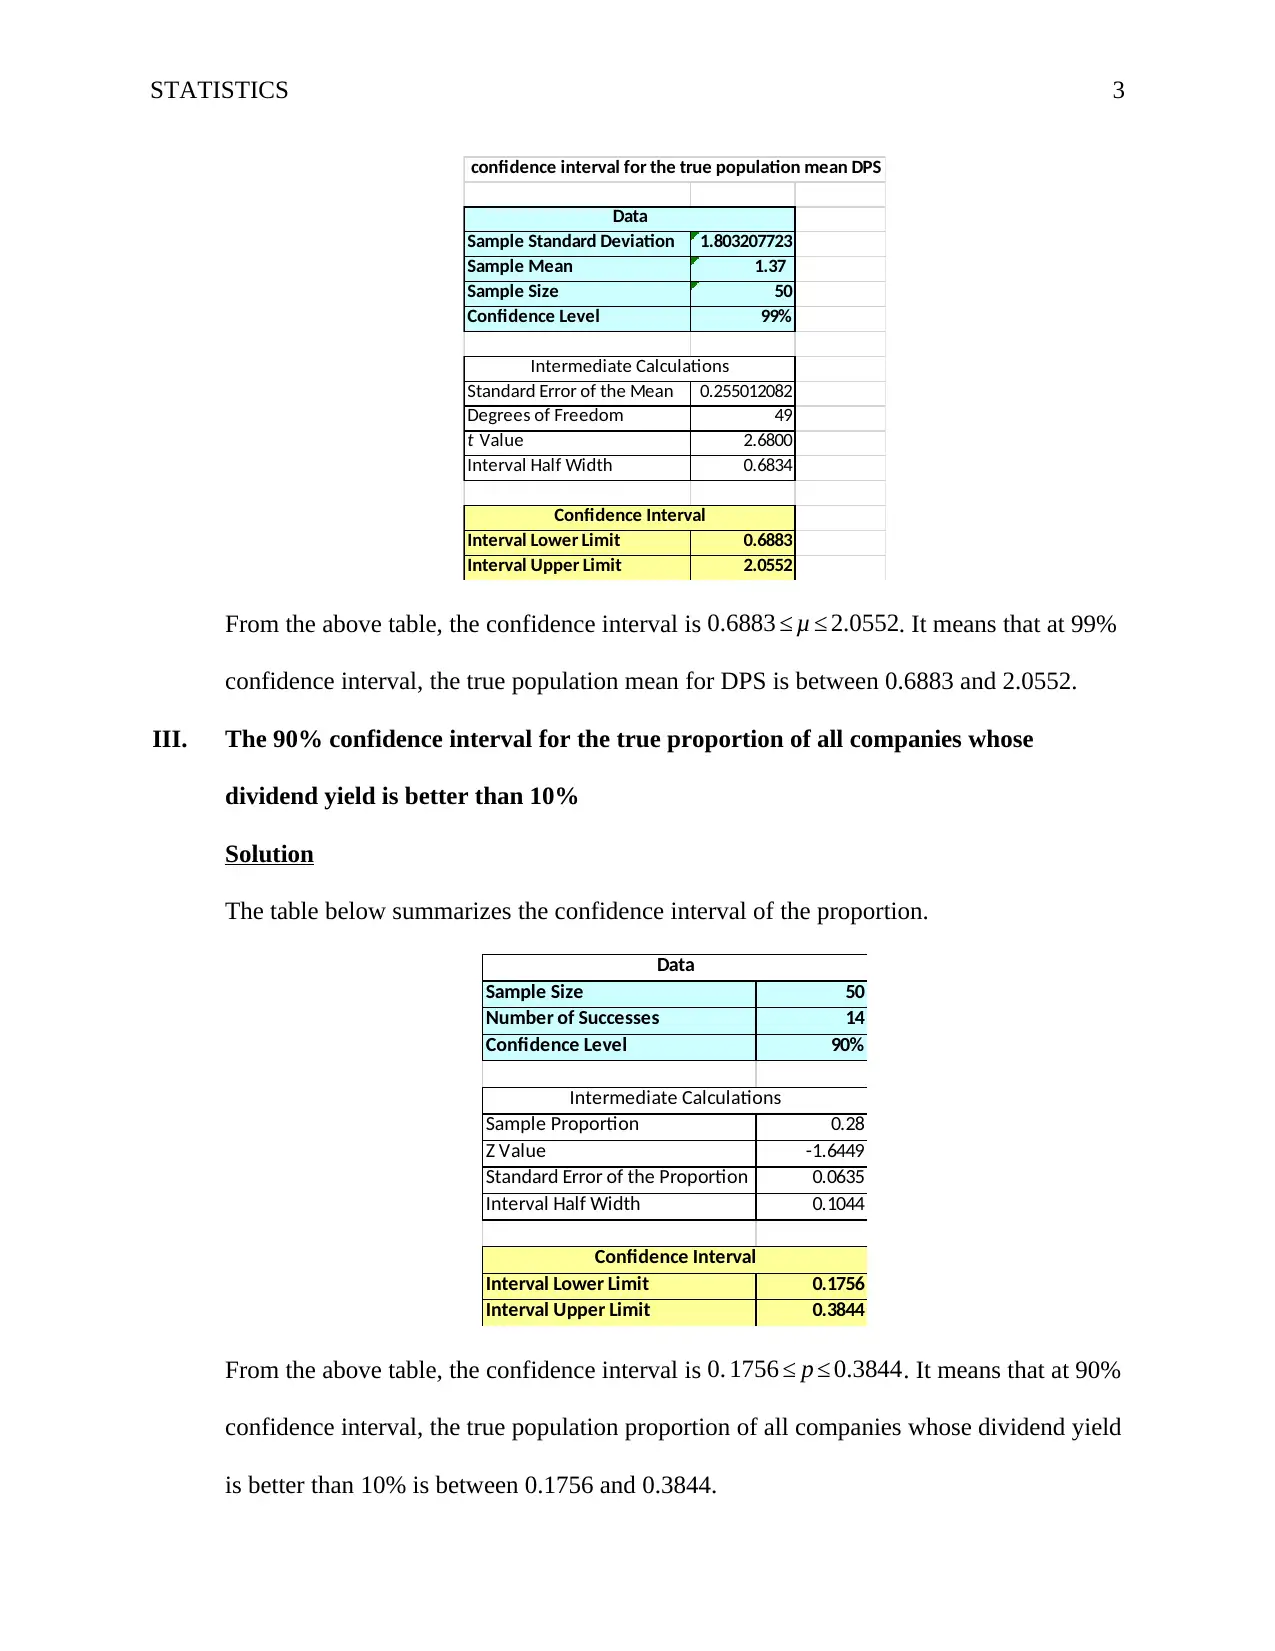
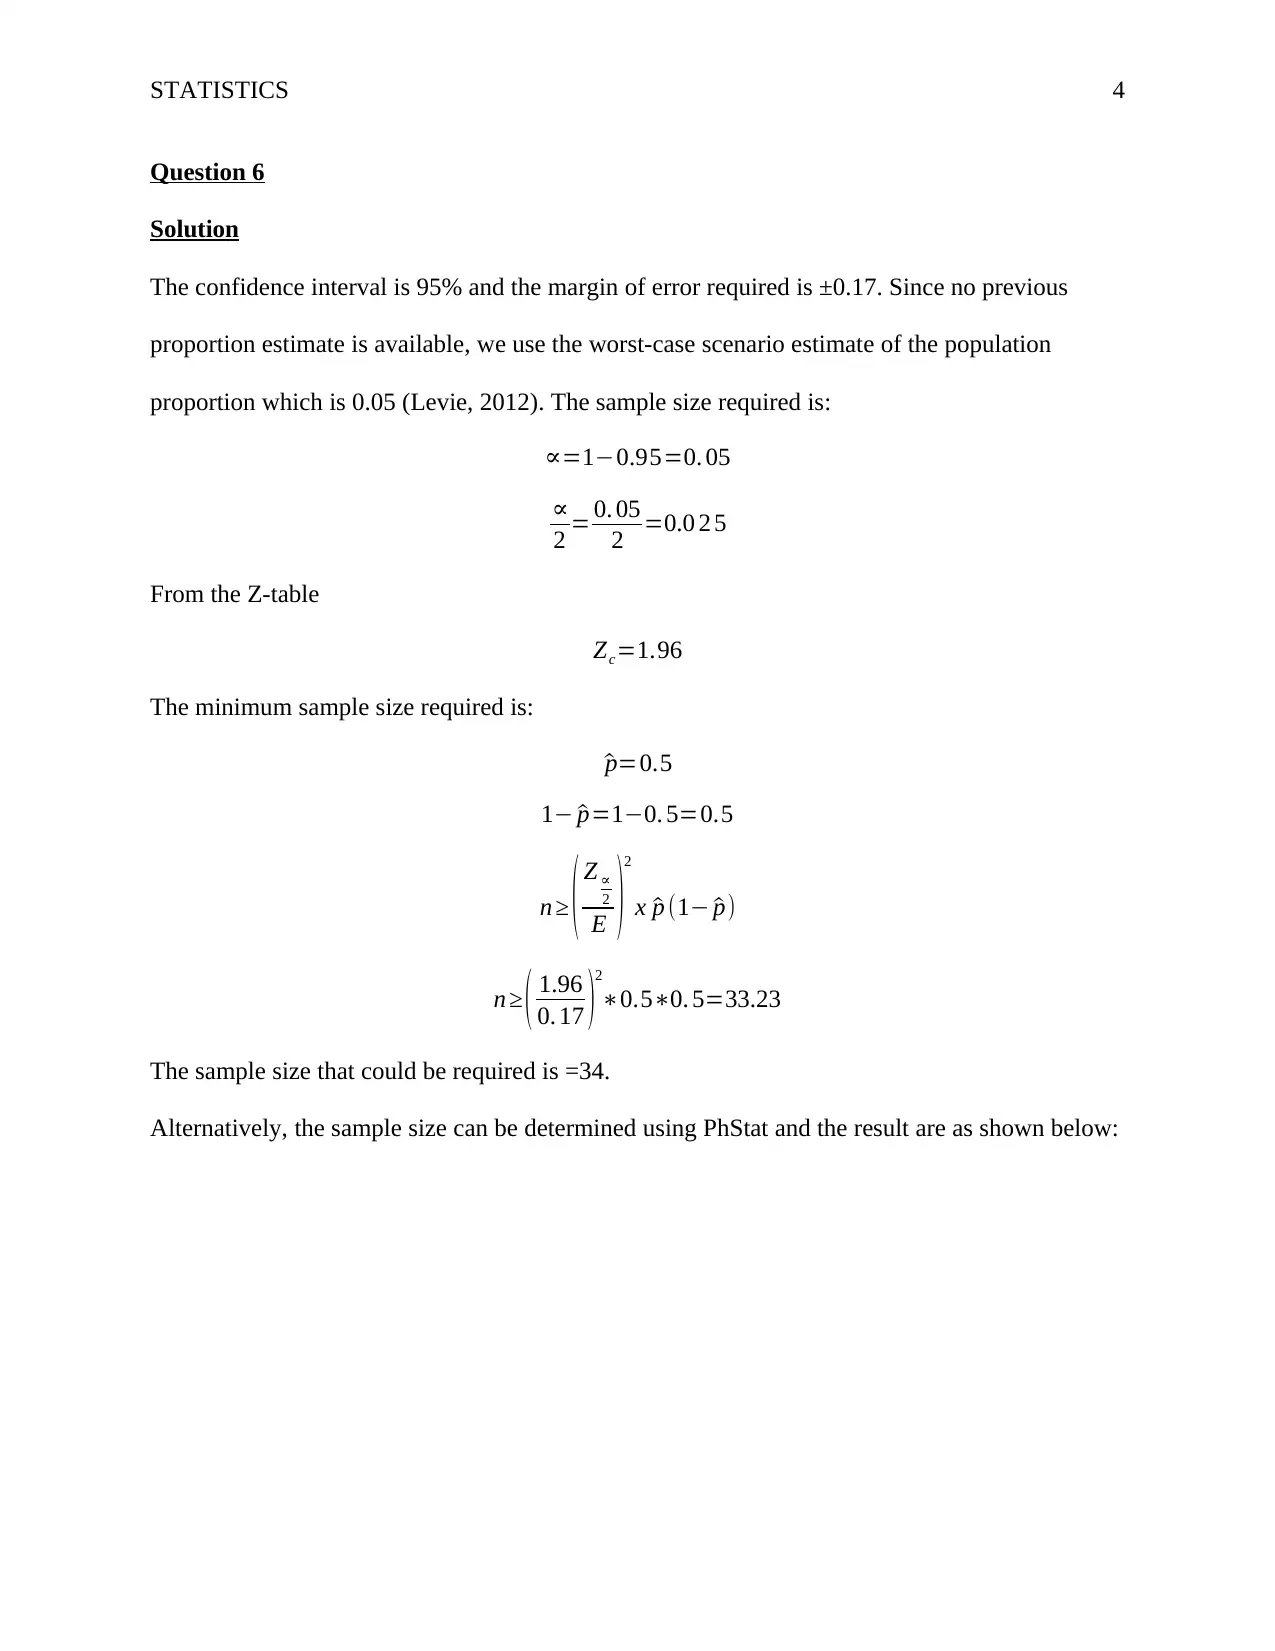
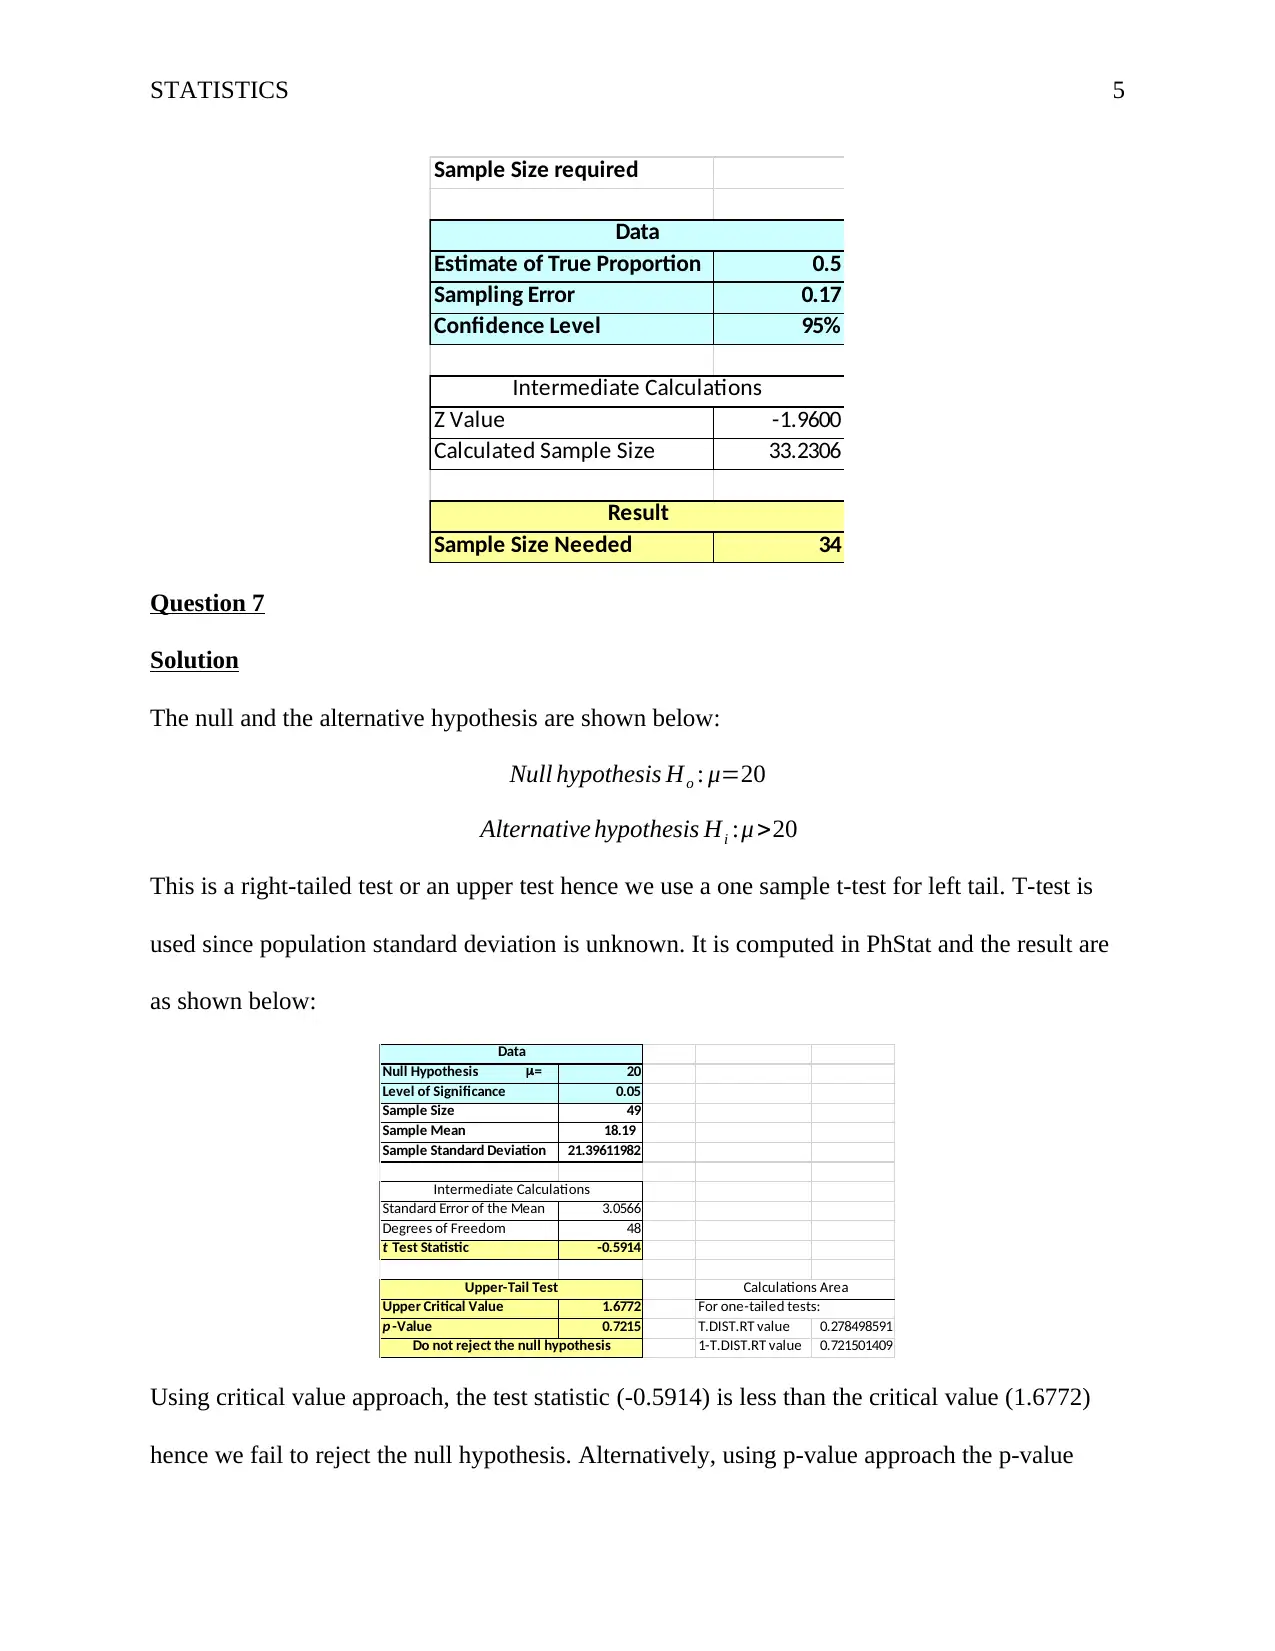
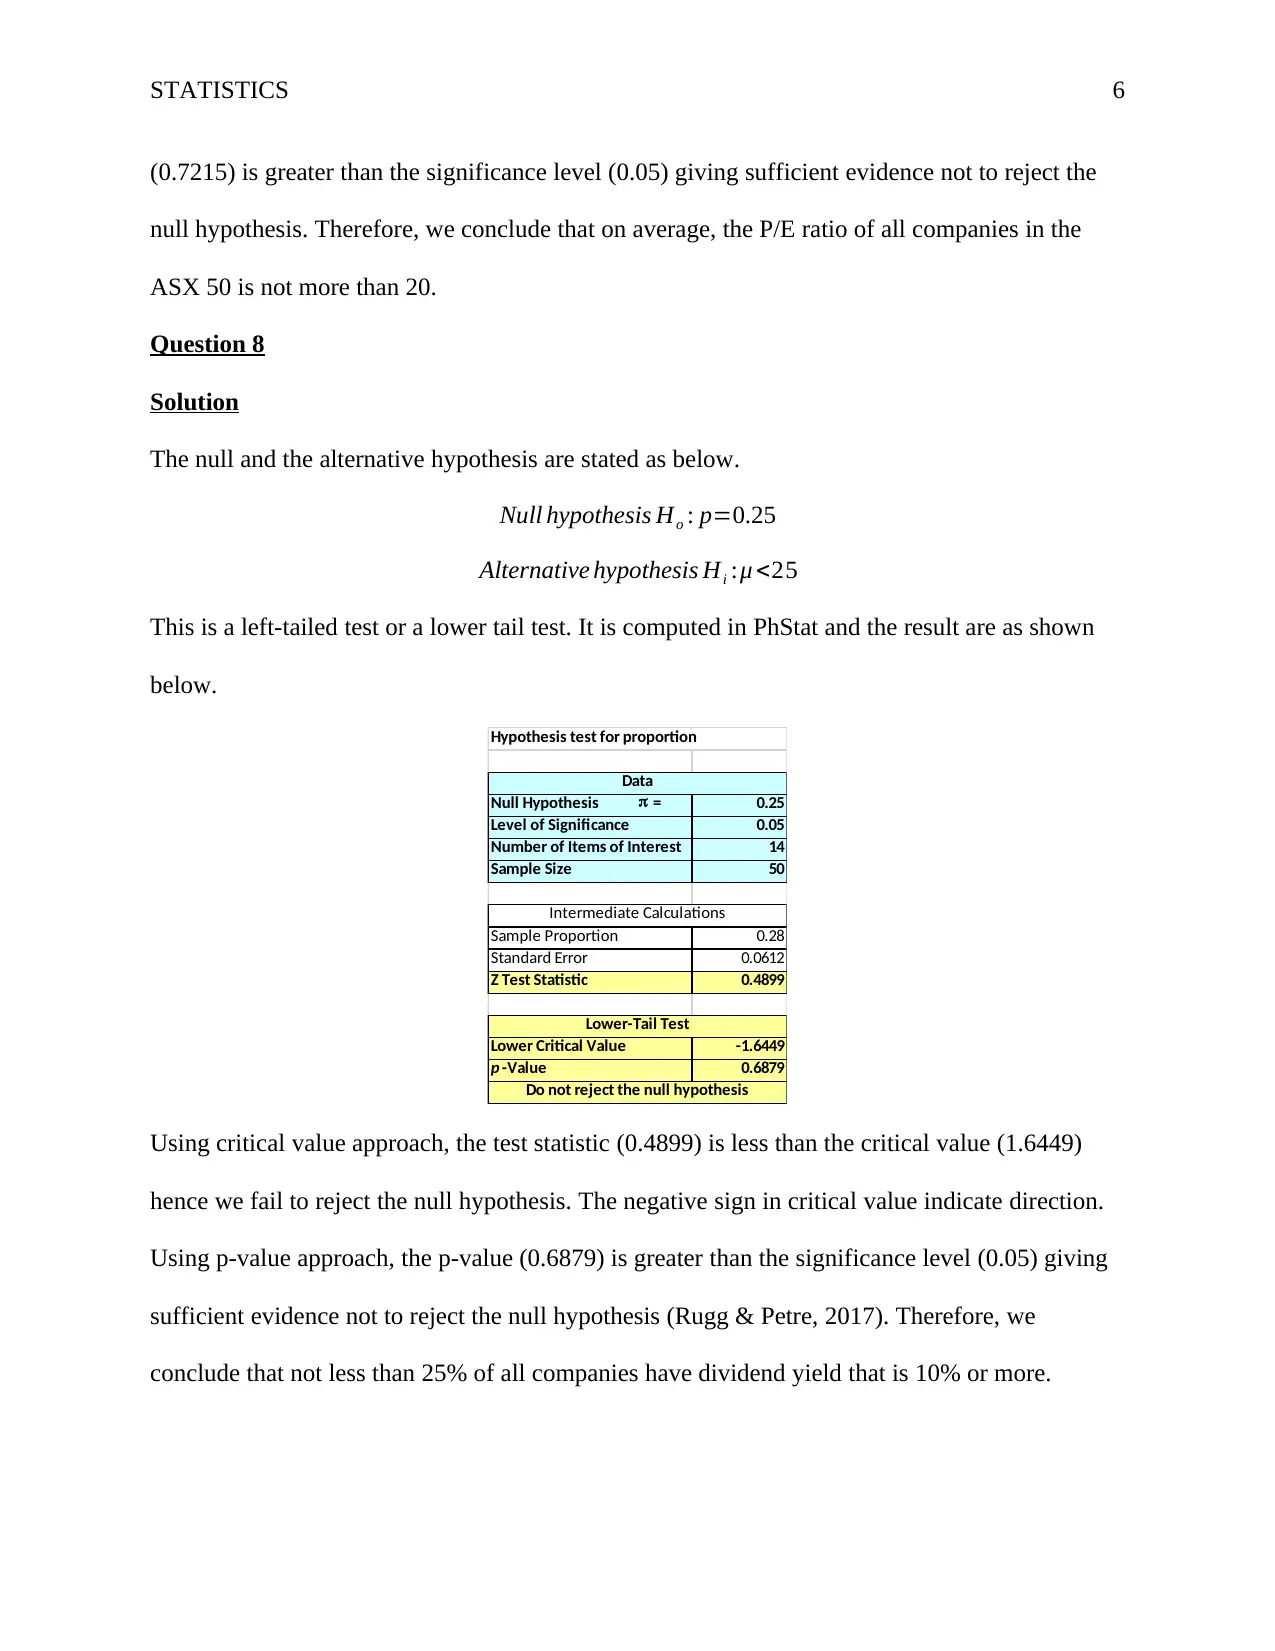
This document provides a detailed solution to a statistics assignment for the ECF6102 Quantitative Skills for Business course at Edith Cowan University, Semester 1, 2020. The solution covers various statistical concepts including calculating confidence intervals for population means and proportions, determining sample sizes, and performing hypothesis tests using t-tests. The assignment addresses questions related to the return on equity (ROE), dividend per share (DPS), and dividend yield of companies. The document includes step-by-step solutions, explanations, and references to statistical tools and methodologies used to solve the problems. The assignment aims to assess students' understanding of statistical analysis and their ability to apply these concepts to business-related scenarios. The provided solutions demonstrate the application of confidence intervals and hypothesis testing to draw conclusions about population parameters based on sample data.
Document Page
Running head: STATISTICS 1
Statistics
Student Name
Professor’s Name
University Name
Date
tabler-icon-diamond-filled.svg

Paraphrase This Document

Need a fresh take? Get an instant paraphrase of this document with our AI Paraphraser
Document Page
STATISTICS 2
Solution
Question 5
I. The 95% confidence interval for the true population man ROE.
Solution
The 95% confidence interval is determined in PhStat and is shown below:
confidence interval for the true population mean ROE
Data
Sample Standard Deviation 12.80324744
Sample Mean 15.77
Sample Size 39
Confidence Level 95%
Standard Error of the Mean 2.050160376
Degrees of Freedom 38
t Value 2.0244
Interval Half Width 4.1503
Interval Lower Limit 11.6168
Interval Upper Limit 19.9175
Intermediate Calculations
Confidence Interval
From the above table, the confidence interval is 11.6168 μ 19.9175. It means that at
95% confidence interval, the true population mean for ROE is between 11.6168% and
19.9175%.
II. The 99% confidence interval for the true population mean DPS
Solution
The 99% confidence interval is determined in PhStat and is shown below:
Document Page
STATISTICS 3
confidence interval for the true population mean DPS
Data
Sample Standard Deviation 1.803207723
Sample Mean 1.37
Sample Size 50
Confidence Level 99%
Standard Error of the Mean 0.255012082
Degrees of Freedom 49
t Value 2.6800
Interval Half Width 0.6834
Interval Lower Limit 0.6883
Interval Upper Limit 2.0552
Intermediate Calculations
Confidence Interval
From the above table, the confidence interval is 0.6883 μ 2.0552. It means that at 99%
confidence interval, the true population mean for DPS is between 0.6883 and 2.0552.
III. The 90% confidence interval for the true proportion of all companies whose
dividend yield is better than 10%
Solution
The table below summarizes the confidence interval of the proportion.
Data
Sample Size 50
Number of Successes 14
Confidence Level 90%
Sample Proportion 0.28
Z Value -1.6449
Standard Error of the Proportion 0.0635
Interval Half Width 0.1044
Interval Lower Limit 0.1756
Interval Upper Limit 0.3844
Intermediate Calculations
Confidence Interval
From the above table, the confidence interval is 0. 1756 p 0.3844. It means that at 90%
confidence interval, the true population proportion of all companies whose dividend yield
is better than 10% is between 0.1756 and 0.3844.
Document Page
STATISTICS 4
Question 6
Solution
The confidence interval is 95% and the margin of error required is ±0.17. Since no previous
proportion estimate is available, we use the worst-case scenario estimate of the population
proportion which is 0.05 (Levie, 2012). The sample size required is:
=10.95=0. 05

2 = 0. 05
2 =0.0 2 5
From the Z-table
Zc=1.96
The minimum sample size required is:
^p=0.5
1 ^p=10. 5=0.5
n ( Z
2
E )
2
x ^p (1 ^p)
n ( 1.96
0. 17 )
2
0.50. 5=33.23
The sample size that could be required is =34.
Alternatively, the sample size can be determined using PhStat and the result are as shown below:
tabler-icon-diamond-filled.svg

Paraphrase This Document

Need a fresh take? Get an instant paraphrase of this document with our AI Paraphraser
Document Page
STATISTICS 5
Sample Size required
Data
Estimate of True Proportion 0.5
Sampling Error 0.17
Confidence Level 95%
Z Value -1.9600
Calculated Sample Size 33.2306
Sample Size Needed 34
Intermediate Calculations
Result
Question 7
Solution
The null and the alternative hypothesis are shown below:
Null hypothesis Ho : μ=20
Alternative hypothesis Hi :μ >20
This is a right-tailed test or an upper test hence we use a one sample t-test for left tail. T-test is
used since population standard deviation is unknown. It is computed in PhStat and the result are
as shown below:
Null Hypothesis m= 20
Level of Significance 0.05
Sample Size 49
Sample Mean 18.19
Sample Standard Deviation 21.39611982
Standard Error of the Mean 3.0566
Degrees of Freedom 48
t Test Statistic -0.5914
Upper-Tail Test Calculations Area
Upper Critical Value 1.6772 For one-tailed tests:
p -Value 0.7215 T.DIST.RT value 0.278498591
Do not reject the null hypothesis 1-T.DIST.RT value 0.721501409
Data
Intermediate Calculations
Using critical value approach, the test statistic (-0.5914) is less than the critical value (1.6772)
hence we fail to reject the null hypothesis. Alternatively, using p-value approach the p-value
Document Page
STATISTICS 6
(0.7215) is greater than the significance level (0.05) giving sufficient evidence not to reject the
null hypothesis. Therefore, we conclude that on average, the P/E ratio of all companies in the
ASX 50 is not more than 20.
Question 8
Solution
The null and the alternative hypothesis are stated as below.
Null hypothesis Ho : p=0.25
Alternative hypothesis Hi :μ <25
This is a left-tailed test or a lower tail test. It is computed in PhStat and the result are as shown
below.
Hypothesis test for proportion
Null Hypothesis p = 0.25
Level of Significance 0.05
Number of Items of Interest 14
Sample Size 50
Sample Proportion 0.28
Standard Error 0.0612
Z Test Statistic 0.4899
Lower-Tail Test
Lower Critical Value -1.6449
p -Value 0.6879
Do not reject the null hypothesis
Data
Intermediate Calculations
Using critical value approach, the test statistic (0.4899) is less than the critical value (1.6449)
hence we fail to reject the null hypothesis. The negative sign in critical value indicate direction.
Using p-value approach, the p-value (0.6879) is greater than the significance level (0.05) giving
sufficient evidence not to reject the null hypothesis (Rugg & Petre, 2017). Therefore, we
conclude that not less than 25% of all companies have dividend yield that is 10% or more.
Document Page
STATISTICS 7
References
Levie, P.R. (2012). Advanced excel for scientific data analysis (2nd ed). New York, NY: Oxford
University Press.
Rugg, G., & Petre, M. (2017). A gentle guide to research methods. Maidenhead: Open
University Press.
chevron_up_icon
1 out of 7
circle_padding
hide_on_mobile
zoom_out_icon
[object Object]