Report: Economic Analysis of China's Growth and Factors
VerifiedAdded on 2022/10/01
|10
|1331
|265
Report
AI Summary
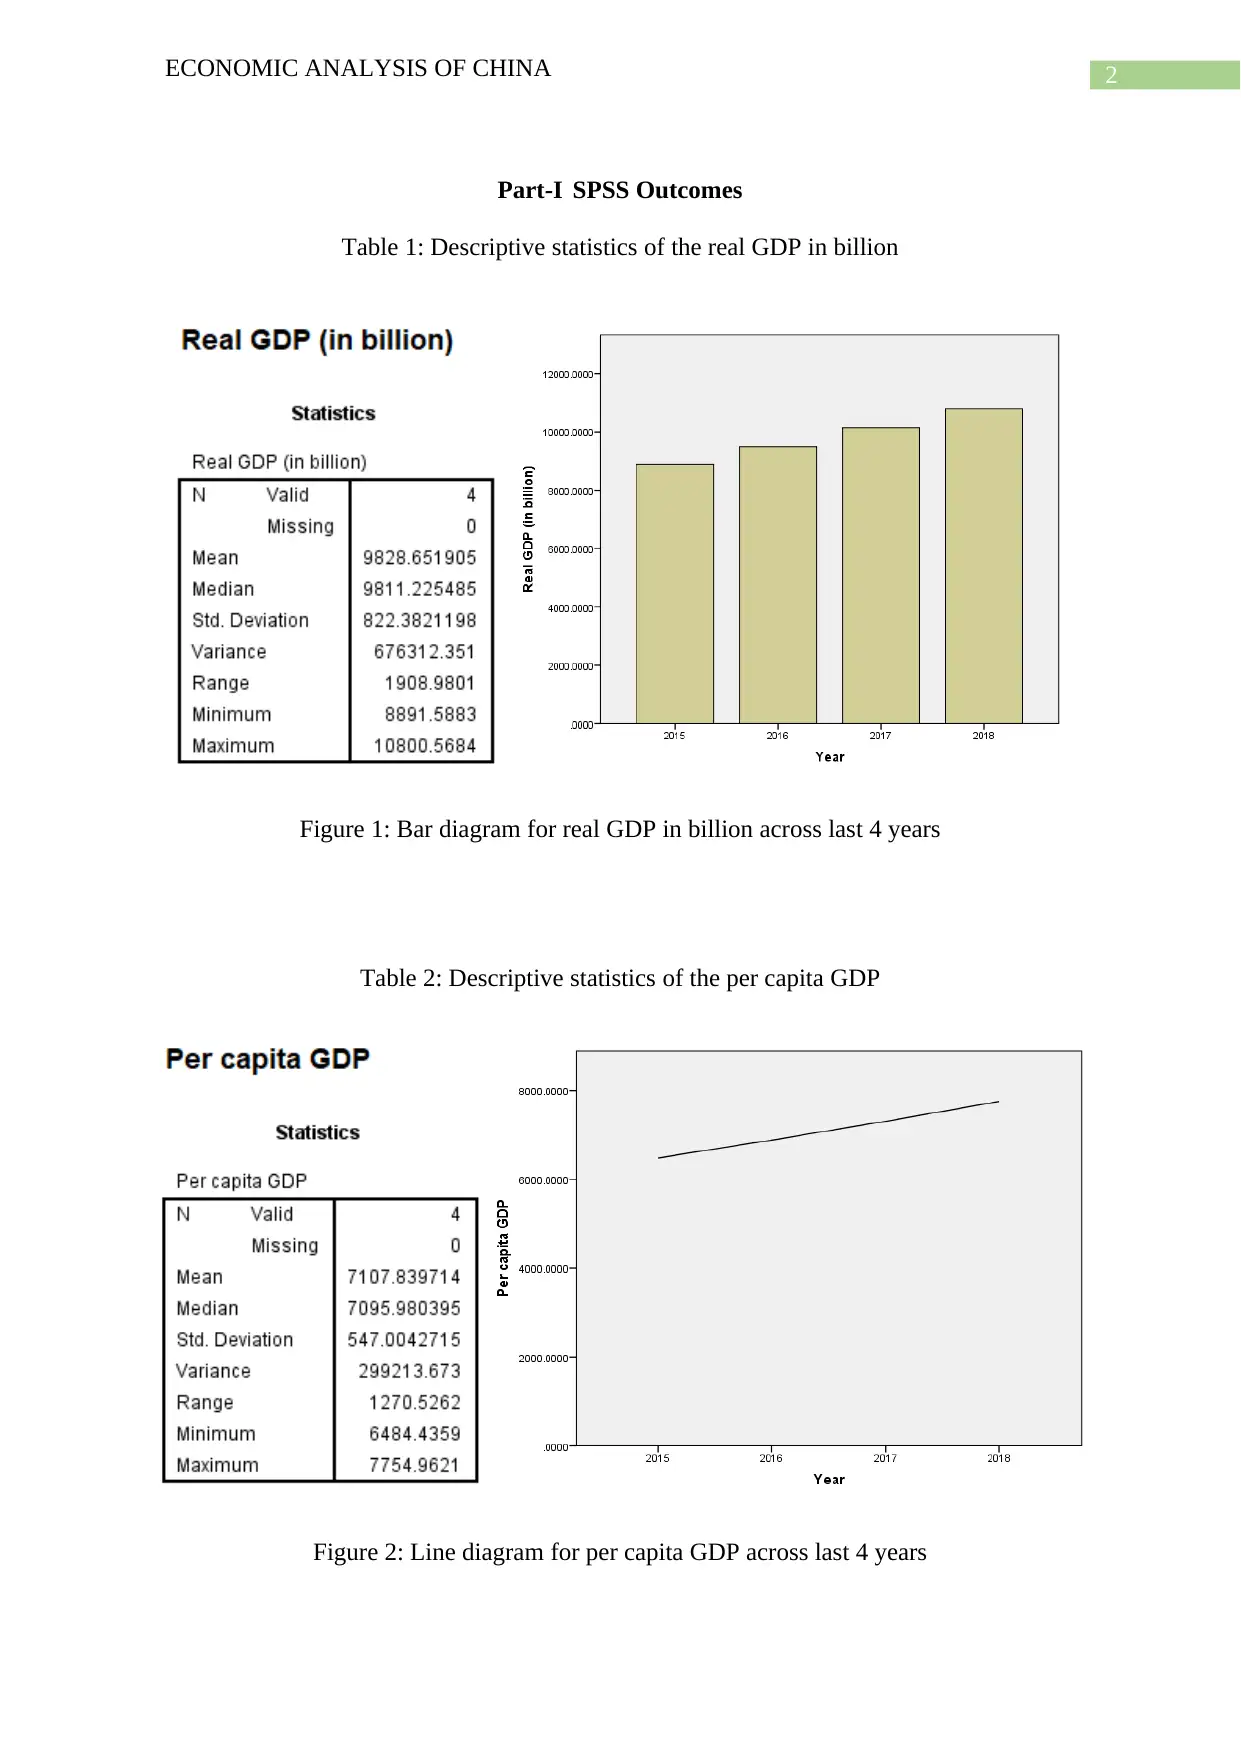
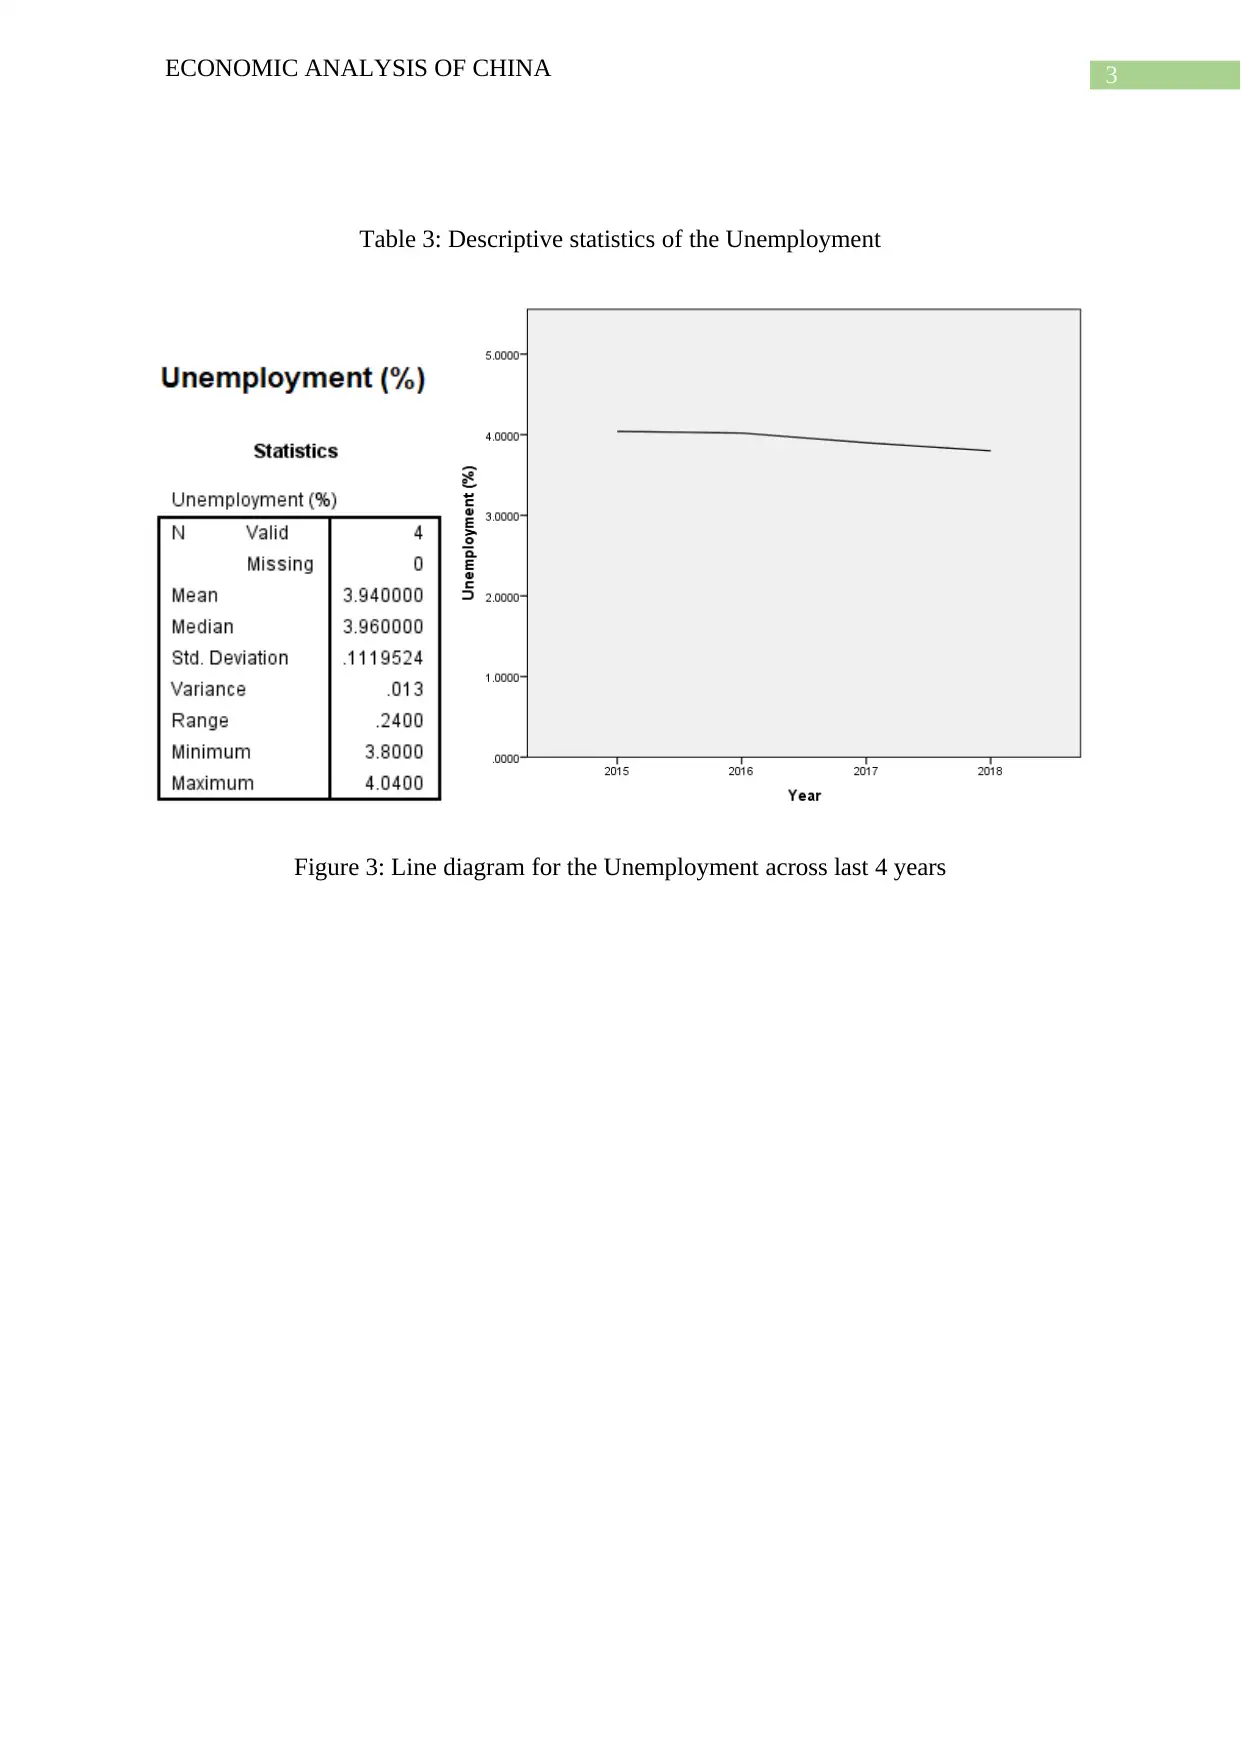
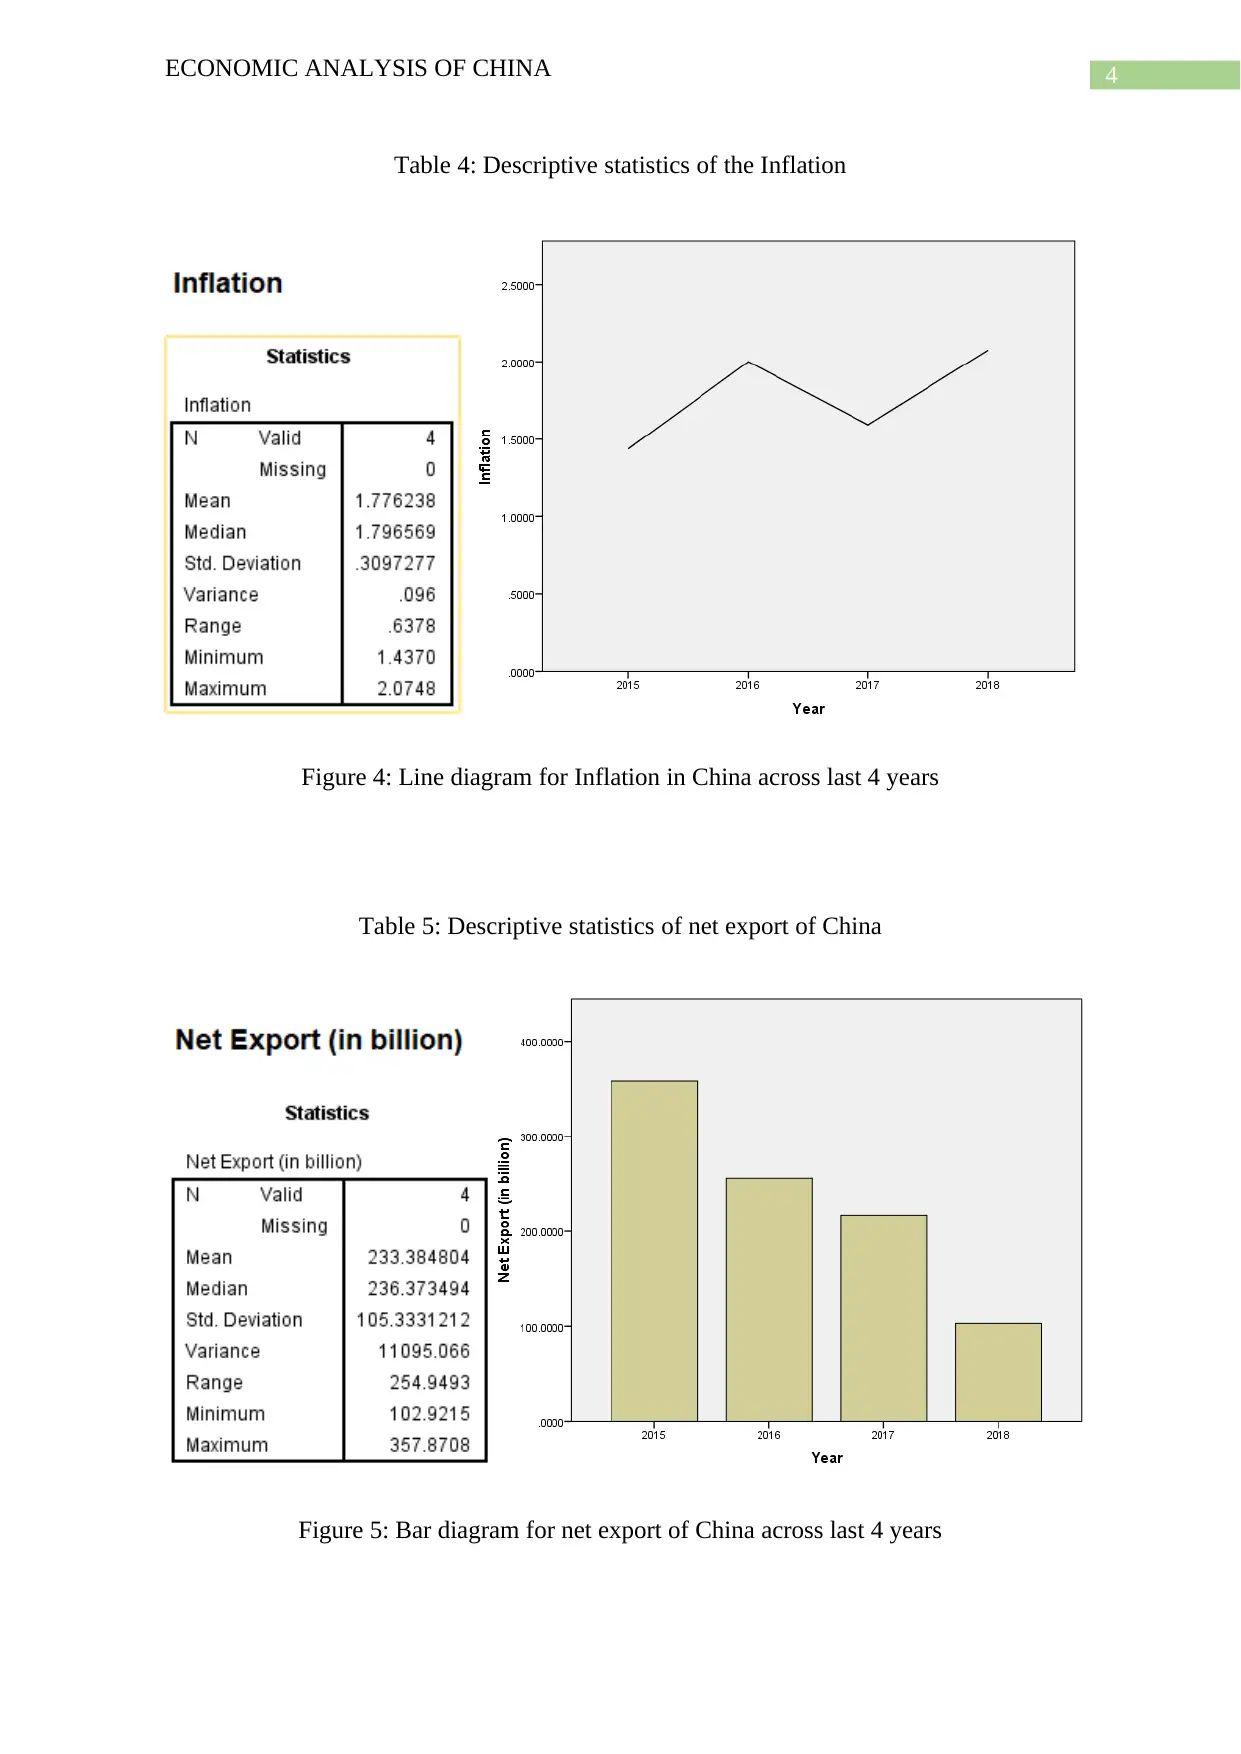
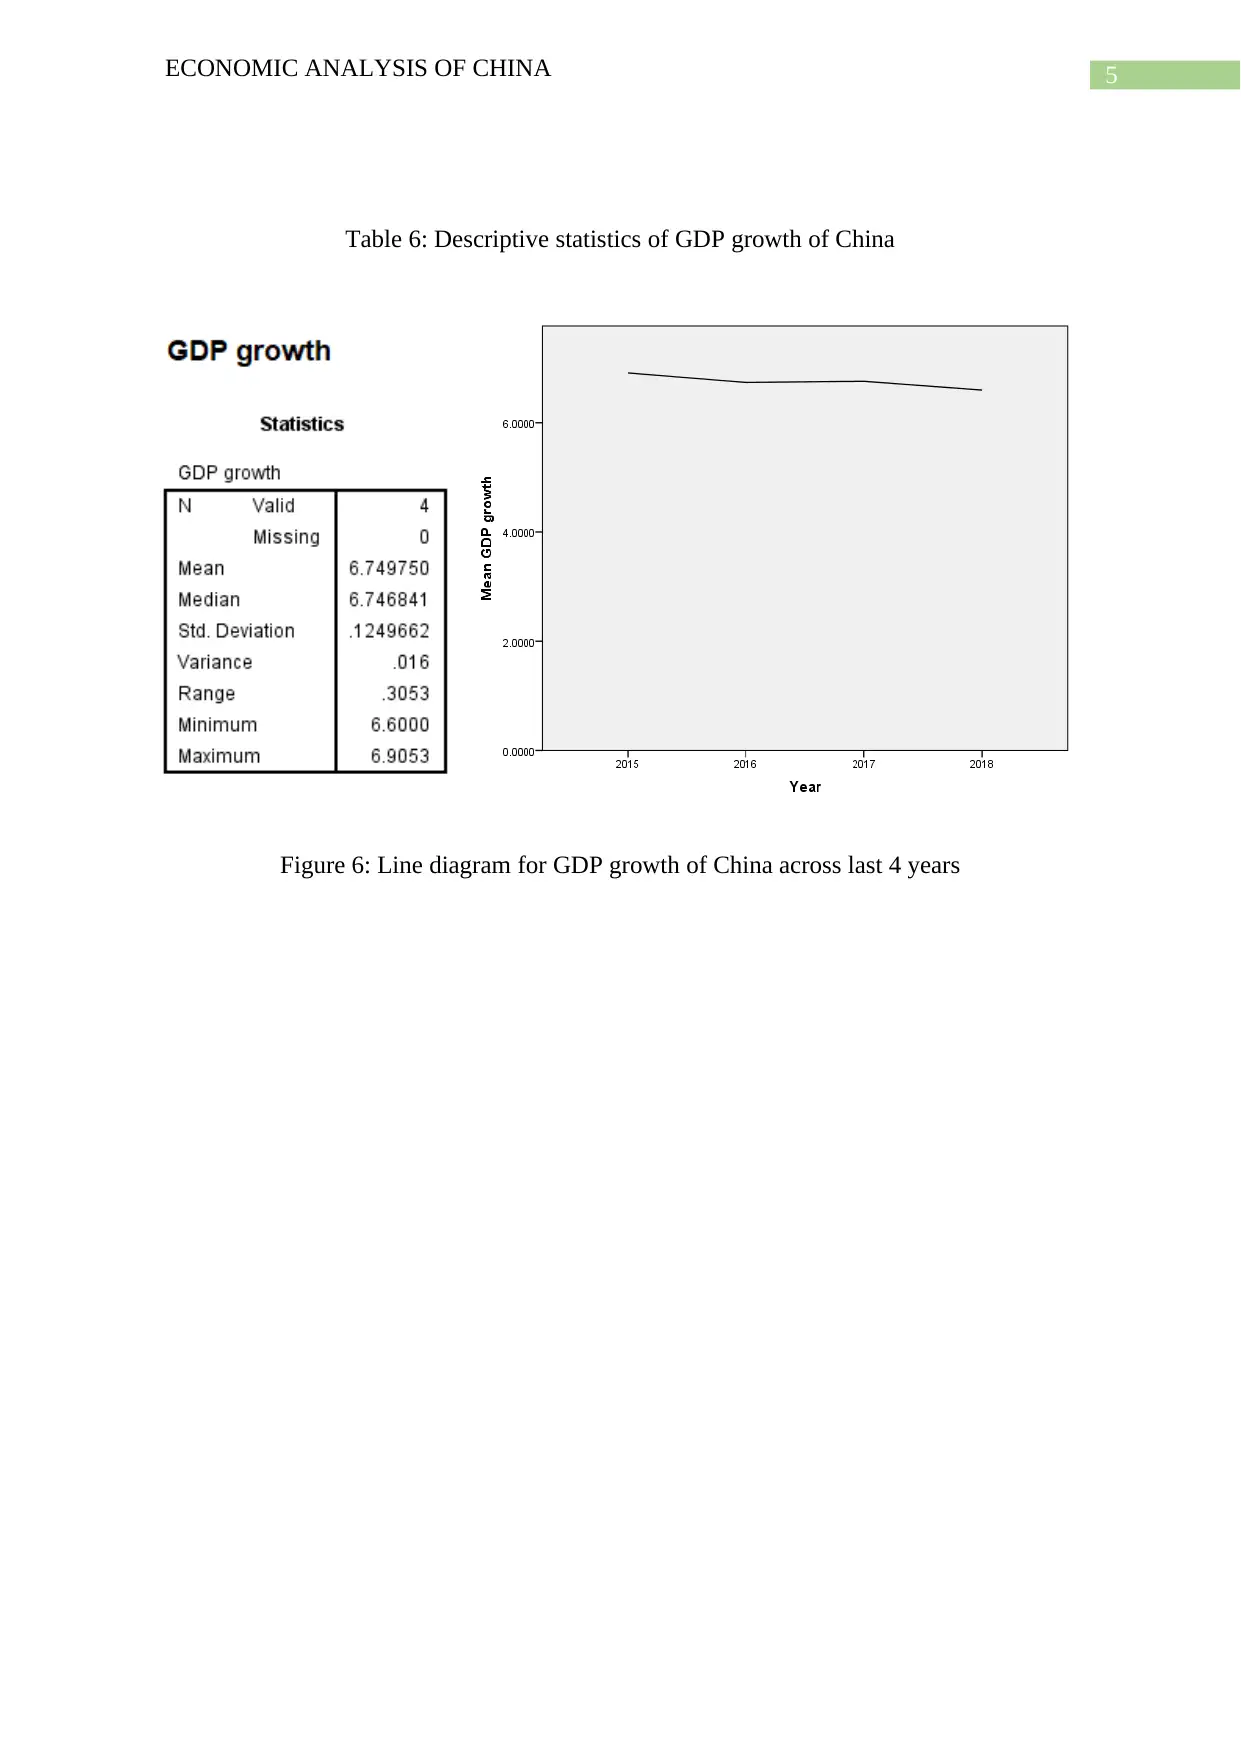
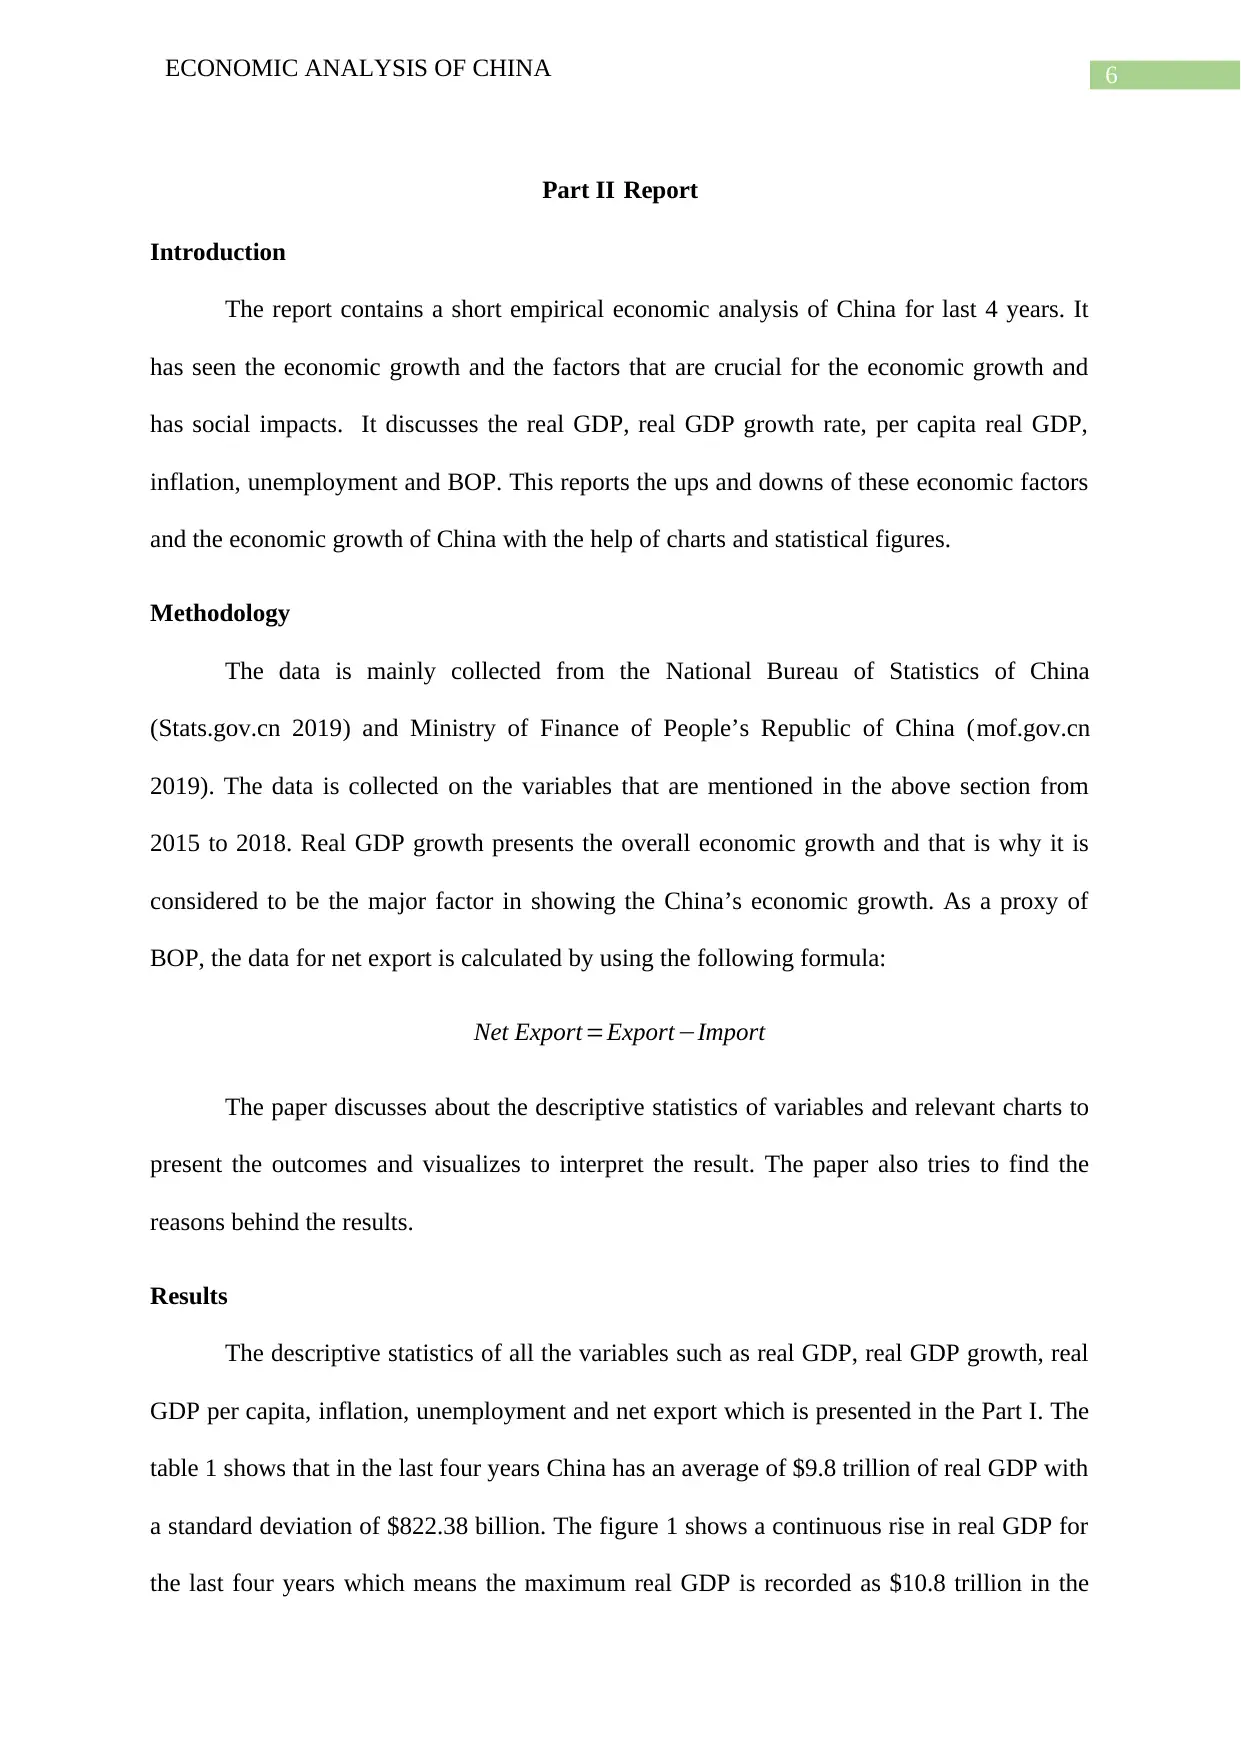
This report provides an empirical economic analysis of China from 2015 to 2018, examining factors crucial for economic growth and their social impacts. It analyzes real GDP, GDP growth rate, per capita GDP, inflation, unemployment, and Balance of Payments (BOP), using data from the National Bureau of Statistics of China and the Ministry of Finance. The report presents descriptive statistics and charts, exploring trends and underlying reasons. It highlights the role of foreign investment, innovative planning, and trade tensions in shaping China's economic landscape. The analysis concludes with a discussion of the impacts of the US-China trade war and other factors, such as money supply and inflation, and China's efforts to address economic challenges by encouraging start-ups, promoting domestic products, and controlling inflation.

Running head: ECONOMIC ANALYSIS OF CHINA
Economic Analysis of China
Name of the Student:
Name of the University:
Author Note:
Economic Analysis of China
Name of the Student:
Name of the University:
Author Note:
Paraphrase This Document
Need a fresh take? Get an instant paraphrase of this document with our AI Paraphraser

1ECONOMIC ANALYSIS OF CHINA
Table of Contents
Part-I SPSS Outcomes...........................................................................................................2
Part II Report.........................................................................................................................6
Introduction............................................................................................................................6
Methodology..........................................................................................................................6
Results....................................................................................................................................6
Discussion..............................................................................................................................7
Conclusion..............................................................................................................................8
Reference................................................................................................................................9

2ECONOMIC ANALYSIS OF CHINA
Part-I SPSS Outcomes
Table 1: Descriptive statistics of the real GDP in billion
Figure 1: Bar diagram for real GDP in billion across last 4 years
Table 2: Descriptive statistics of the per capita GDP
Figure 2: Line diagram for per capita GDP across last 4 years
Part-I SPSS Outcomes
Table 1: Descriptive statistics of the real GDP in billion
Figure 1: Bar diagram for real GDP in billion across last 4 years
Table 2: Descriptive statistics of the per capita GDP
Figure 2: Line diagram for per capita GDP across last 4 years
⊘ This is a preview!⊘
Do you want full access?
Subscribe today to unlock all pages.

Trusted by 1+ million students worldwide

3ECONOMIC ANALYSIS OF CHINA
Table 3: Descriptive statistics of the Unemployment
Figure 3: Line diagram for the Unemployment across last 4 years
Table 3: Descriptive statistics of the Unemployment
Figure 3: Line diagram for the Unemployment across last 4 years
Paraphrase This Document
Need a fresh take? Get an instant paraphrase of this document with our AI Paraphraser

4ECONOMIC ANALYSIS OF CHINA
Table 4: Descriptive statistics of the Inflation
Figure 4: Line diagram for Inflation in China across last 4 years
Table 5: Descriptive statistics of net export of China
Figure 5: Bar diagram for net export of China across last 4 years
Table 4: Descriptive statistics of the Inflation
Figure 4: Line diagram for Inflation in China across last 4 years
Table 5: Descriptive statistics of net export of China
Figure 5: Bar diagram for net export of China across last 4 years

5ECONOMIC ANALYSIS OF CHINA
Table 6: Descriptive statistics of GDP growth of China
Figure 6: Line diagram for GDP growth of China across last 4 years
Table 6: Descriptive statistics of GDP growth of China
Figure 6: Line diagram for GDP growth of China across last 4 years
⊘ This is a preview!⊘
Do you want full access?
Subscribe today to unlock all pages.

Trusted by 1+ million students worldwide

6ECONOMIC ANALYSIS OF CHINA
Part II Report
Introduction
The report contains a short empirical economic analysis of China for last 4 years. It
has seen the economic growth and the factors that are crucial for the economic growth and
has social impacts. It discusses the real GDP, real GDP growth rate, per capita real GDP,
inflation, unemployment and BOP. This reports the ups and downs of these economic factors
and the economic growth of China with the help of charts and statistical figures.
Methodology
The data is mainly collected from the National Bureau of Statistics of China
(Stats.gov.cn 2019) and Ministry of Finance of People’s Republic of China (mof.gov.cn
2019). The data is collected on the variables that are mentioned in the above section from
2015 to 2018. Real GDP growth presents the overall economic growth and that is why it is
considered to be the major factor in showing the China’s economic growth. As a proxy of
BOP, the data for net export is calculated by using the following formula:
Net Export=Export−Import
The paper discusses about the descriptive statistics of variables and relevant charts to
present the outcomes and visualizes to interpret the result. The paper also tries to find the
reasons behind the results.
Results
The descriptive statistics of all the variables such as real GDP, real GDP growth, real
GDP per capita, inflation, unemployment and net export which is presented in the Part I. The
table 1 shows that in the last four years China has an average of $9.8 trillion of real GDP with
a standard deviation of $822.38 billion. The figure 1 shows a continuous rise in real GDP for
the last four years which means the maximum real GDP is recorded as $10.8 trillion in the
Paraphrase This Document
Need a fresh take? Get an instant paraphrase of this document with our AI Paraphraser

7ECONOMIC ANALYSIS OF CHINA
year of 2018. The real GDP in 2018 is $1.9 trillion higher than the real GDP in 2015. Table 2
shows the average real GDP per capita is $7107.84 for the last four years with standard
deviation of $547. The figure 2 shows a continuous growth in real GDP per capita for last
four years. In these last four years, per capita GDP has grown by $1270.53. The table 3
presents an average of 3.94% of unemployment rate for the last four years. The figure 3
presents a slight kink line at the point of year 2016 and then it falls with greater rate.
However, it seen that the unemployment rate has fallen by 0.24% in the last 4 years. Table 4
demonstrates the average inflation rate which is 1.78% for the last four years with standard
deviation of 0.31%. The figure 4 shows ups and downs in the inflation rate for last four years.
In the year of 2016 and 2018 it has been increased and then decreased. In these last four
years, inflation rate has risen by 0.64%. The table 5 presents an average of $233.38 billion of
net export for the last four years. The figure 5 presents that net export falls year by year and
in the year 2018 it becomes only $102.92 billion. However, it is seen that the net export has
fallen by $254.95 billion in the last 4 years. The table 6 presents an average of 6.75% of GDP
growth rate for the last four years. The figure 6 presents a slight kink line at the point of year
2016 and 2017. However, it is seen that the GDP growth rate has fallen by 0.31% in the last 4
years.
Discussion
The large amount of capital investment funded by the foreign investment is the major
factor which is responsible for growth in GDP. $1.35 trillion in FDI stock is attracted by
China by the end of 2016 which makes China the largest FDI recipient. The Chinese firms
have invested $324 billion in EU and this is the 31.03% of the China’s outbound FDI (Wang
2018). Moreover, innovative planning like “Made in China 2025”are there to support the
economic growth by rising GDP. Due to tension in US-China trade, a large number of
employees are fired from the manufacturing sector and it has an impact in reducing the net

8ECONOMIC ANALYSIS OF CHINA
export which worsen the BOP of China (SHAN 2017). A continuous fall in steel export from
2015 to 2018 is one of the major reasons in reduction of export.
Conclusion
The developing Chinese economy is going well till the economic growth and GDP per
capita is growing over time. However, due to some major economic changes like, US China
trade war and sacking employees in manufacturing sector raises the unemployment rate and
BOP is negatively influenced which is weakening the Chinese economy. Behind the inflation
in china money supply has the major role. In china, excess money supply attacks the share
prices and real estate business which leads to the inflationary situation (Kuang and Liu 2015).
However, China is taking steps to improve the economic situation by encouraging the youth
for start-ups, rising the domestic products to get rid of form the excess and unnecessary
imports and focusing on the production of labour intensive goods. They are trying to control
the inflation by adjusting the forex rate, discount rate and reserve ratio (Jiang 2016).
⊘ This is a preview!⊘
Do you want full access?
Subscribe today to unlock all pages.

Trusted by 1+ million students worldwide

9ECONOMIC ANALYSIS OF CHINA
Reference
Jiang, D., 2016. Inflation and inflation uncertainty in China. Applied Economics, 48(41),
pp.3935-3943.
Kuang, W. and Liu, P., 2015. Inflation and house prices: theory and evidence from 35 major
cities in China. International Real Estate Review, 18(1), pp.217-240.
mof.gov.cn, 2019. [online] Available at: http://www.mof.gov.cn/index.htm [Accessed 15 Oct.
2019].
SHAN, W., 2017. Explaining Unemployment among Uighurs in China. East Asian Policy,
9(03), pp.85-95.
Stats.gov.cn, 2019. National Bureau of Statistics of China. [online] Stats.gov.cn. Available
at: http://www.stats.gov.cn/english/ [Accessed 15 Oct. 2019].
Wang, X., 2018, August. The Role of Processing Trade and FDI in China's Economic
Growth. In 2018 2nd International Conference on Education Science and Economic
Management (ICESEM 2018). Atlantis Press.
1 out of 10
Related Documents

Your All-in-One AI-Powered Toolkit for Academic Success.
+13062052269
info@desklib.com
Available 24*7 on WhatsApp / Email
Unlock your academic potential
Copyright © 2020–2025 A2Z Services. All Rights Reserved. Developed and managed by ZUCOL.