Germany's Economic Performance: Analysis of Key Indicators
VerifiedAdded on 2023/04/08
|15
|2331
|462
Report
AI Summary
This report provides a comprehensive economic analysis of Germany, examining key indicators such as GDP growth, inflation rates, and unemployment levels. The analysis spans from 2008 to 2019, highlighting trends in GDP (constant price), real annual GDP growth, and GDP per capita. The report delves into the contributions of various sectors, including agriculture, manufacturing, and services, to Germany's GDP. Furthermore, it explores the labor market, analyzing unemployment rates and discussing the impact of government policies like the Hartz Reforms. The report also examines inflation, its causes (demand-pull and cost-push), and the different types of inflation experienced in Germany. It references data from sources like Trading Economics, OECD, Fred Economic Data, and Statista to support its findings, providing a detailed overview of the German economic landscape.
Economics Assignment
Students Name
Institution
Students Name
Institution
Paraphrase This Document
Need a fresh take? Get an instant paraphrase of this document with our AI Paraphraser
Germany 1
Introduction
Primarily, the economic growth of Germany is progressive and enviable by most
economies. Due to the increased employment levels over the recent past owing to the growth of
the service, manufacturing and agriculture sectors. Also, the implementation of reduced
unemployment benefits has, in turn, encourage more employment initiatives. Similar to other
countries, Germany has experienced structural, frictional and cyclical forms of unemployment
over the respective years. Alongside unemployment, Germany has shown signs of hyperinflation,
creeping, walking and galloping types of inflation which have been caused by demand –pull
factors and cost-push factors..Also, the appreciation of the Euro has helped stabilize the prices of
services and commodities hence reducing the rate of inflation.
Worth noting, the German economy is considered powerful in the Europe region with an
estimated export value of 1.547 trillion US dollars in the years 2018(Workman, 2019).
Particularly, machinery, automotive, electrical equipment and machinery, optical, technical and
medical apparatus plus pharmaceuticals form the top five list of Germany s’s exports (Workman,
2018). On the importation front, Germany ‘s value of imports in the year 2018 amounted to
1.287 trillion US dollars thus goes to show Germany exports more than it imports. Namely,
Germany imports Machinery, electrical machinery and equipment, vehicles, mineral fuels and
pharmaceuticals as its top five goods (Wits, 2008). Notably, among Germany’s biggest
companies are the Volkswagen Group and Merck KgaA.
Germany 2
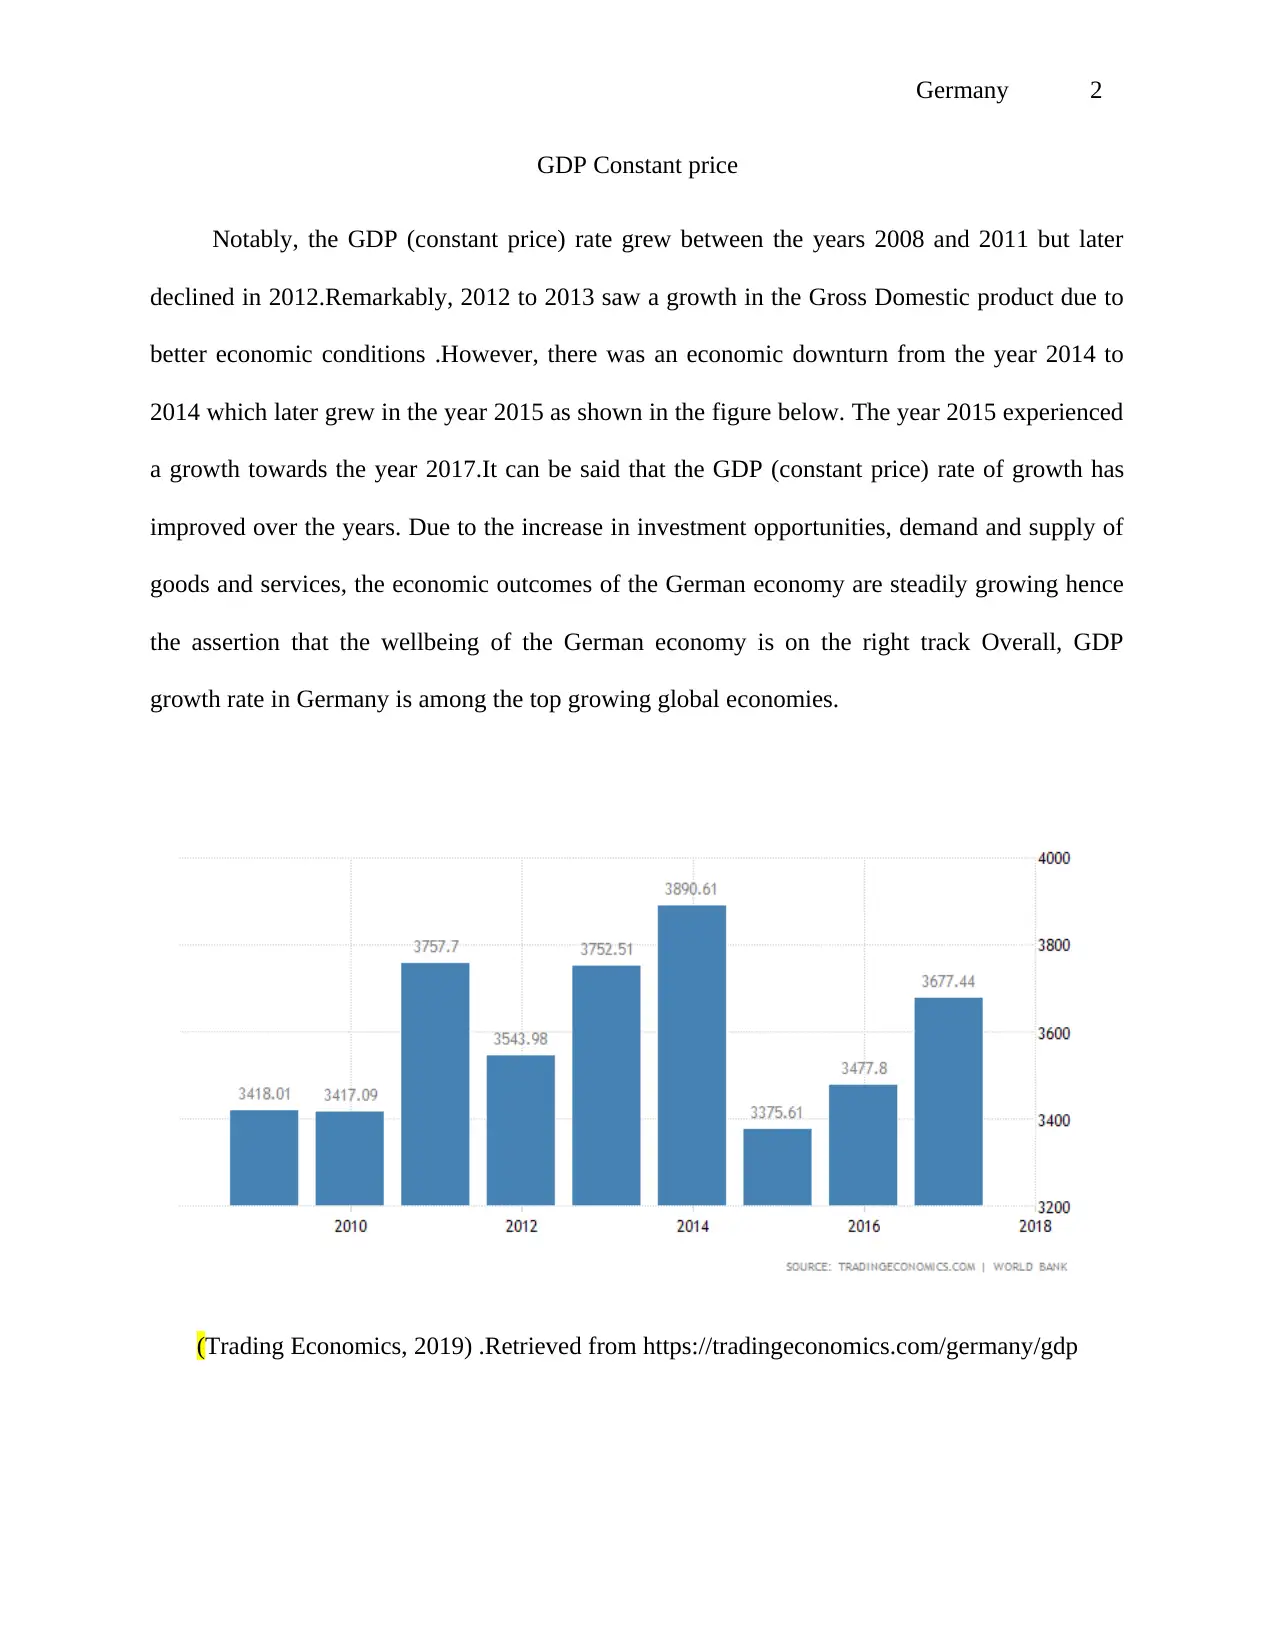
GDP Constant price
Notably, the GDP (constant price) rate grew between the years 2008 and 2011 but later
declined in 2012.Remarkably, 2012 to 2013 saw a growth in the Gross Domestic product due to
better economic conditions .However, there was an economic downturn from the year 2014 to
2014 which later grew in the year 2015 as shown in the figure below. The year 2015 experienced
a growth towards the year 2017.It can be said that the GDP (constant price) rate of growth has
improved over the years. Due to the increase in investment opportunities, demand and supply of
goods and services, the economic outcomes of the German economy are steadily growing hence
the assertion that the wellbeing of the German economy is on the right track Overall, GDP
growth rate in Germany is among the top growing global economies.
(Trading Economics, 2019) .Retrieved from https://tradingeconomics.com/germany/gdp
⊘ This is a preview!⊘
Do you want full access?
Subscribe today to unlock all pages.
Trusted by 1+ million students worldwide
Germany 3
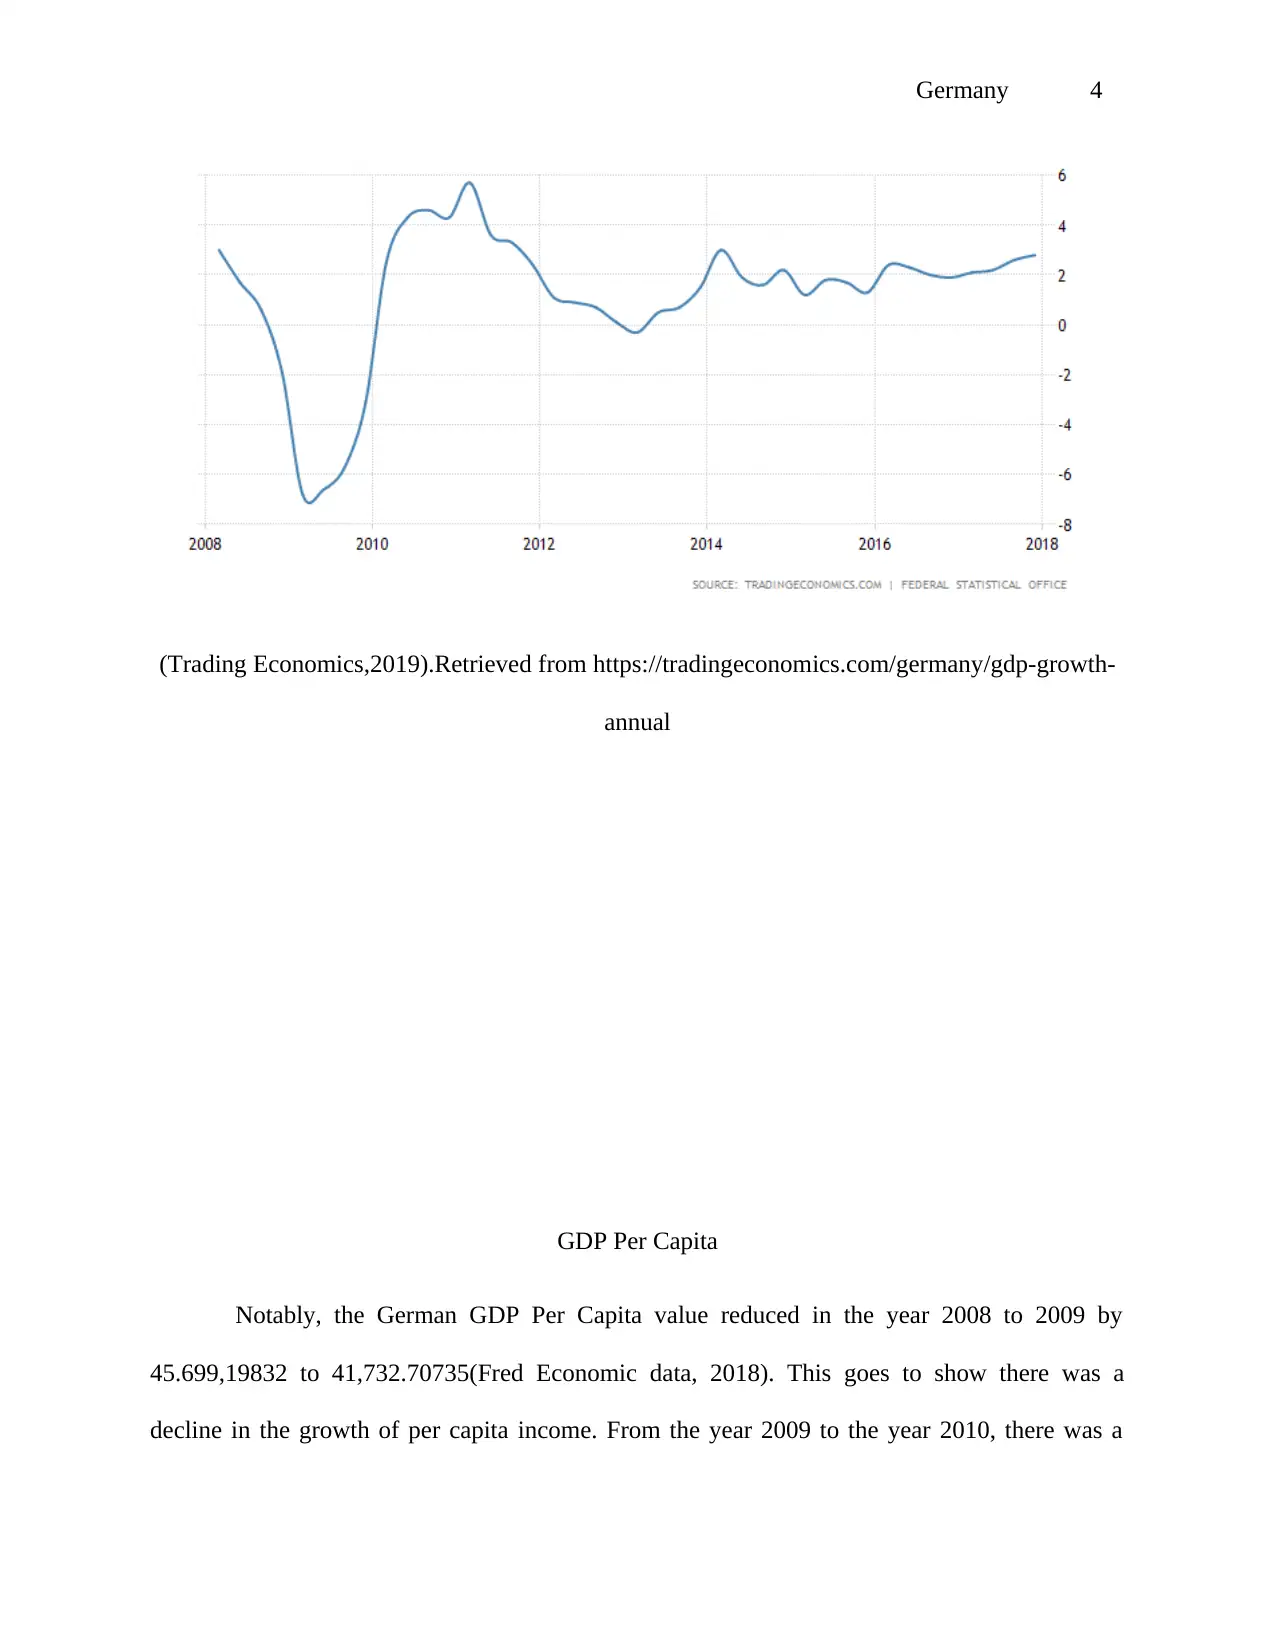
Real Annual GDP growth Rate
Primarily, Real Gross domestic growth implies the annual rate of growth of the GDP using
domestic currency at the market price. Currently, the real GDP growth for the year 2018 was 1.9
percent. Despite the fluctuation, Germany ‘s economy is among the top five countries with a
steady economic growth pattern since the year 2009(OECD,2018). However, there was an
increase between the years 2000-18 estimated at 1.9 percent (Knoema, 2019).Worth noting,the
German economy grew by 2.01 % between 1971 and 2018.As illustrated in the below graph,the
German economy declined between the years 2007 -09.This was due to the effects of the 2007-
09 global financial crisis.However since the year 2009 and early 2011,the economy grew
significantly.There was stagnanted decline in economy growth between the year 2012-13.The
year 2014 experienced a slight growth and decline which extended to the year 2016 when the
economy began to grow steadily till the year 2018.Overall,the German annual GDP keeps
growing.
Paraphrase This Document
Need a fresh take? Get an instant paraphrase of this document with our AI Paraphraser
Germany 4
(Trading Economics,2019).Retrieved from https://tradingeconomics.com/germany/gdp-growth-
annual
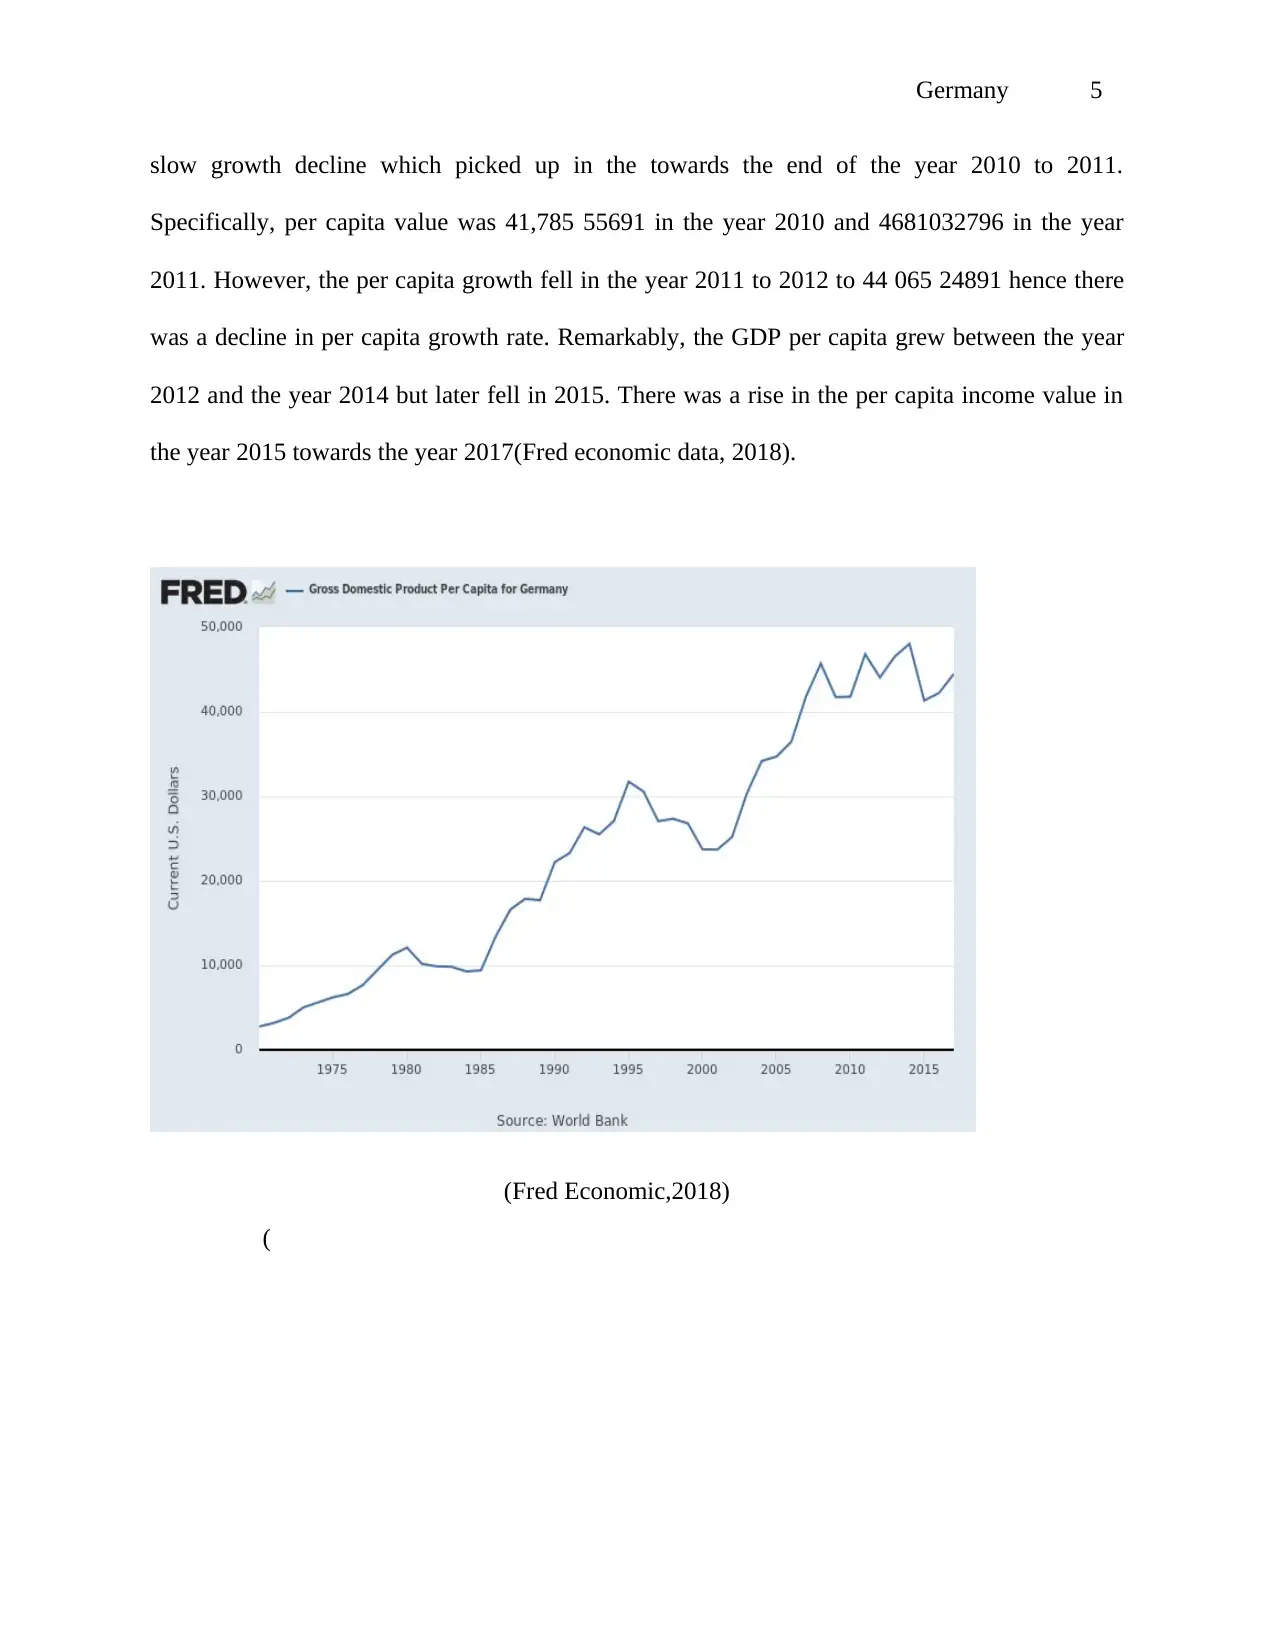
GDP Per Capita
Notably, the German GDP Per Capita value reduced in the year 2008 to 2009 by
45.699,19832 to 41,732.70735(Fred Economic data, 2018). This goes to show there was a
decline in the growth of per capita income. From the year 2009 to the year 2010, there was a
(Trading Economics,2019).Retrieved from https://tradingeconomics.com/germany/gdp-growth-
annual
GDP Per Capita
Notably, the German GDP Per Capita value reduced in the year 2008 to 2009 by
45.699,19832 to 41,732.70735(Fred Economic data, 2018). This goes to show there was a
decline in the growth of per capita income. From the year 2009 to the year 2010, there was a
Germany 5
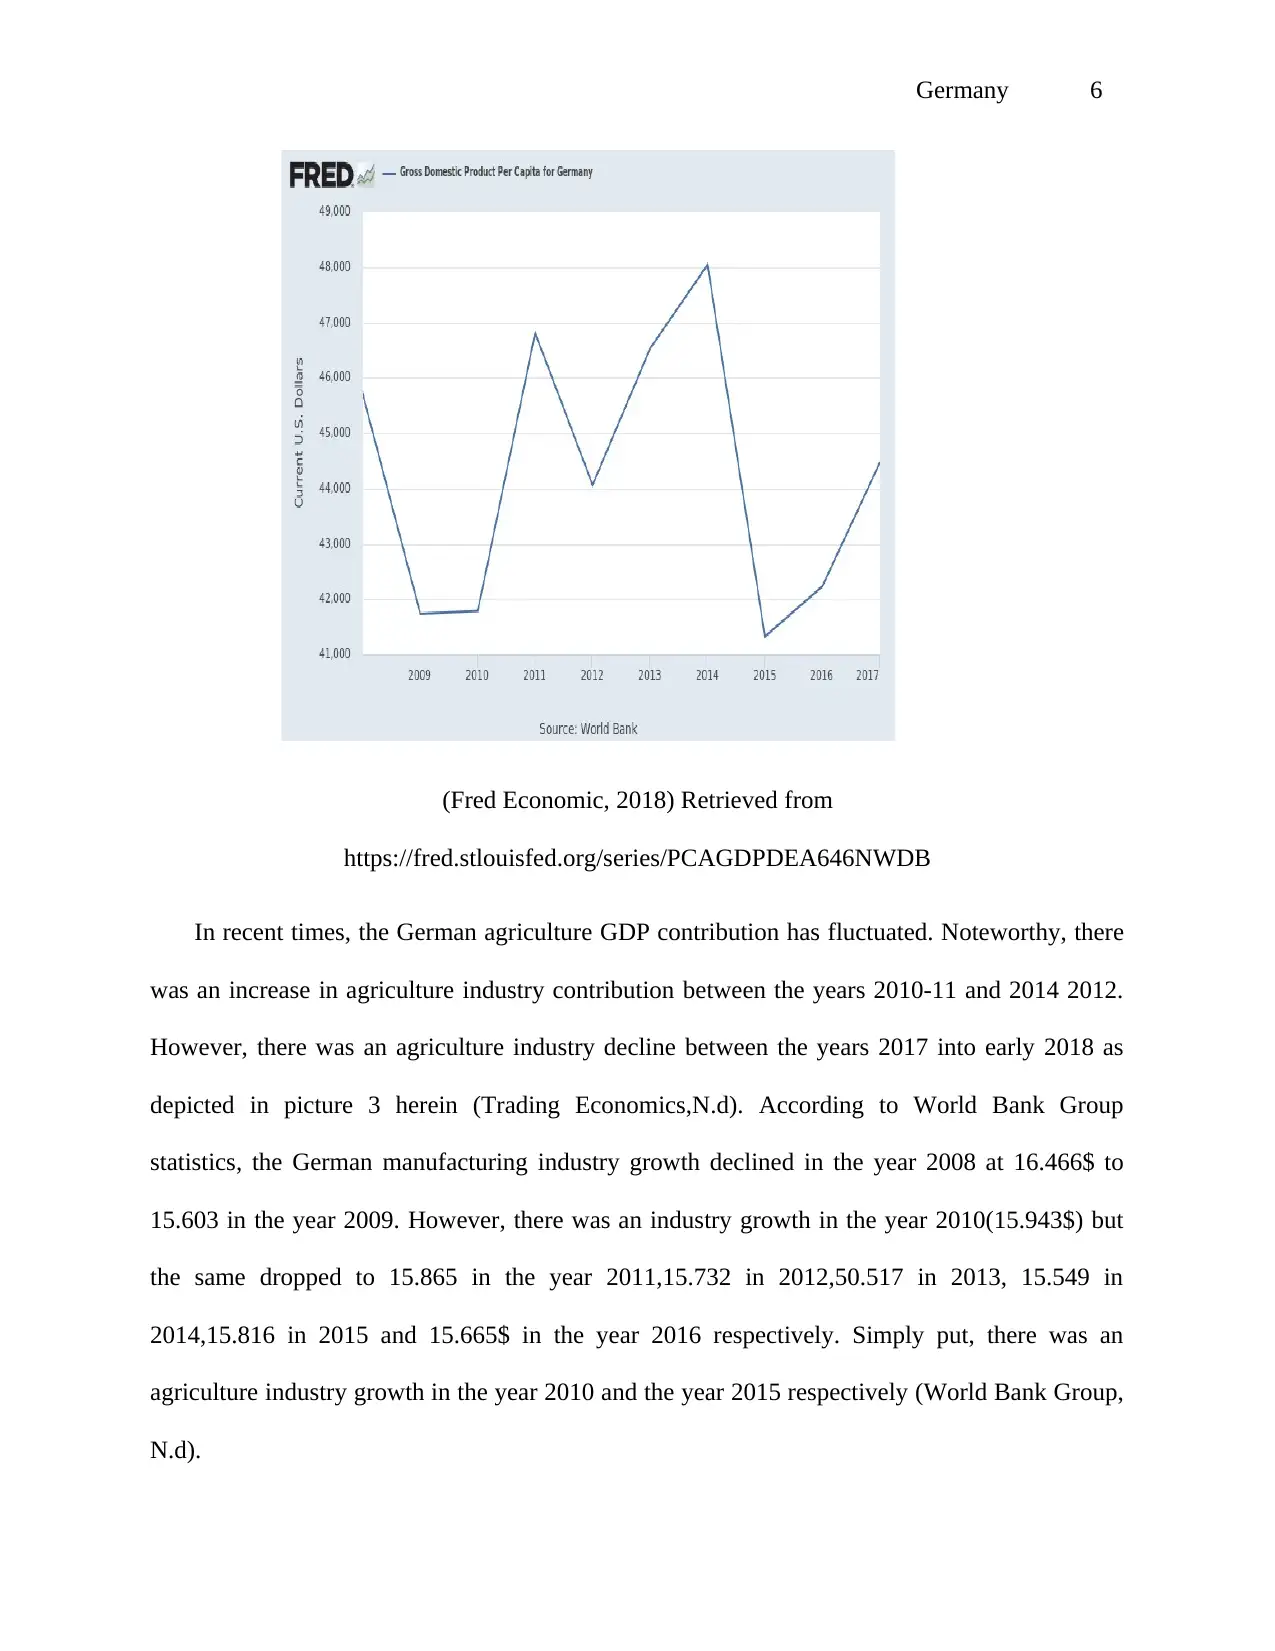
slow growth decline which picked up in the towards the end of the year 2010 to 2011.
Specifically, per capita value was 41,785 55691 in the year 2010 and 4681032796 in the year
2011. However, the per capita growth fell in the year 2011 to 2012 to 44 065 24891 hence there
was a decline in per capita growth rate. Remarkably, the GDP per capita grew between the year
2012 and the year 2014 but later fell in 2015. There was a rise in the per capita income value in
the year 2015 towards the year 2017(Fred economic data, 2018).
(Fred Economic,2018)
(
⊘ This is a preview!⊘
Do you want full access?
Subscribe today to unlock all pages.
Trusted by 1+ million students worldwide
Germany 6
(Fred Economic, 2018) Retrieved from
https://fred.stlouisfed.org/series/PCAGDPDEA646NWDB
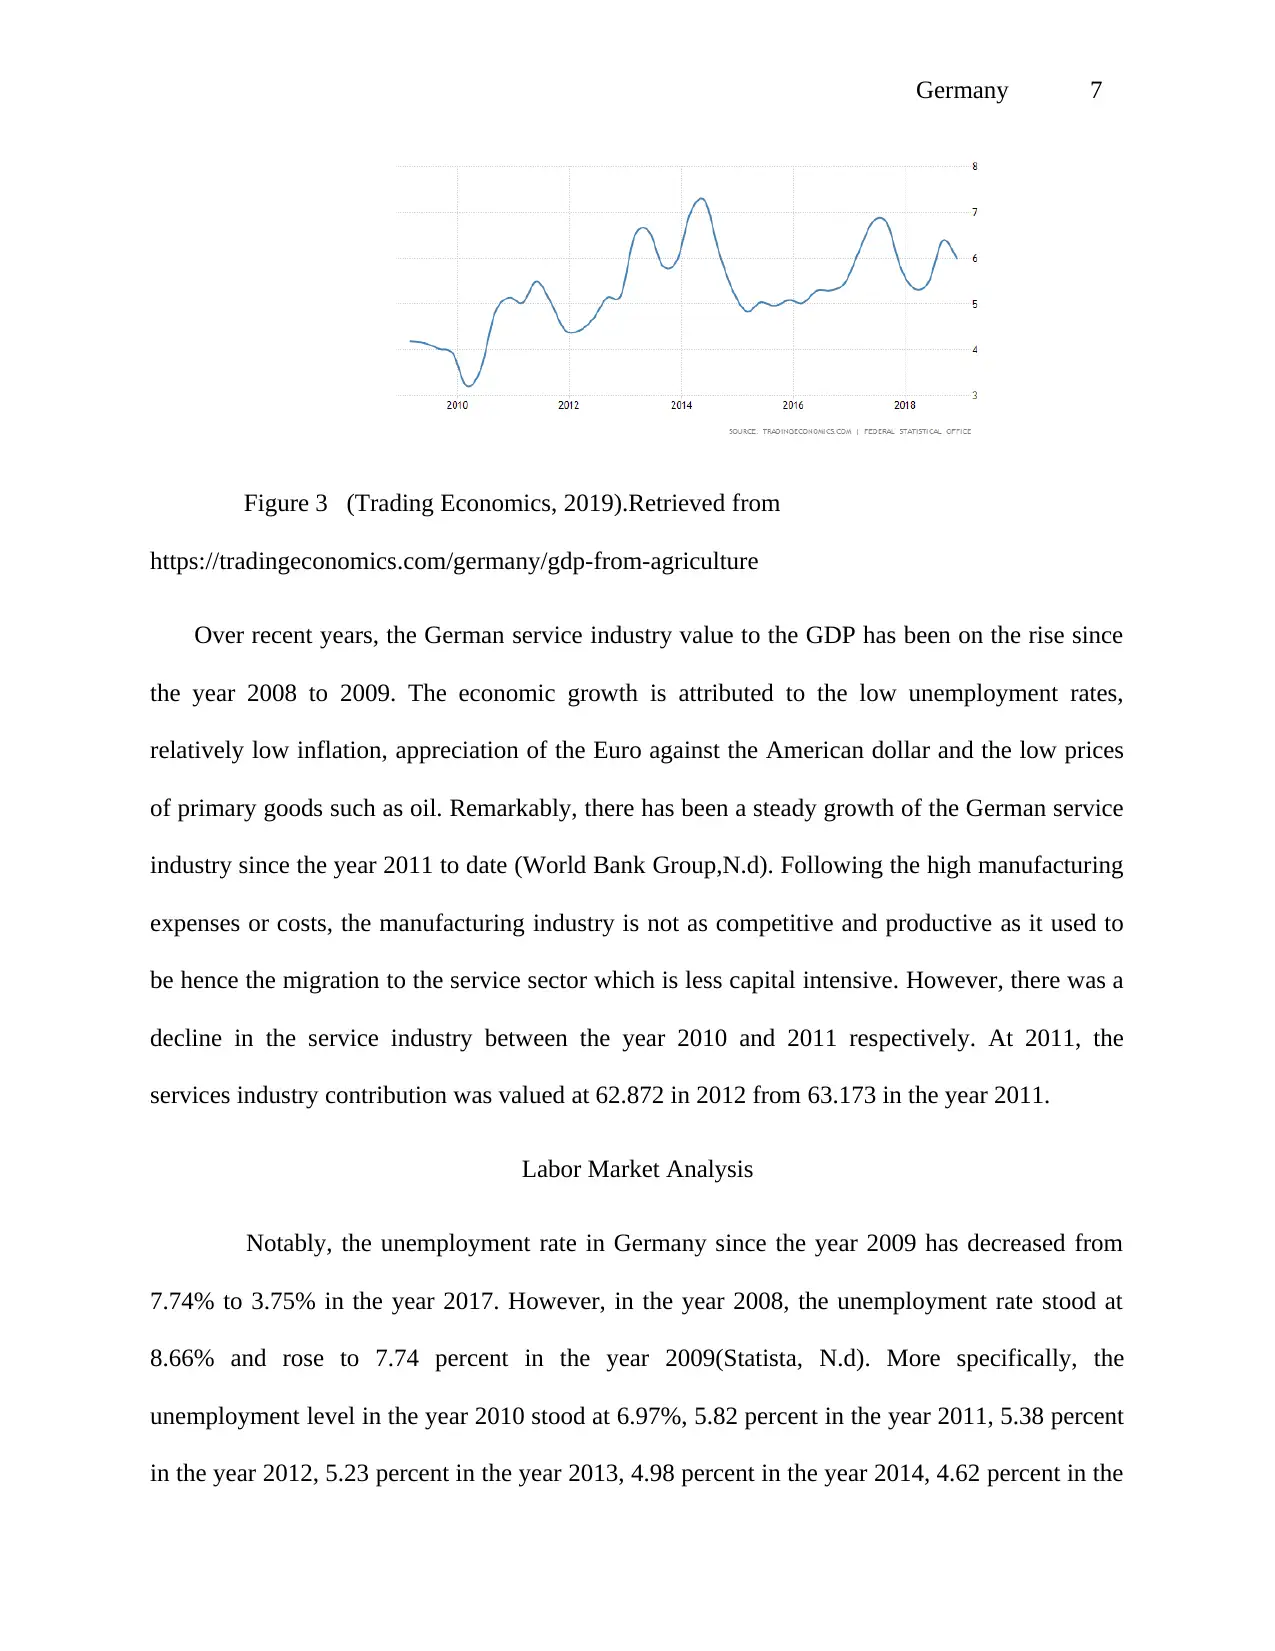
In recent times, the German agriculture GDP contribution has fluctuated. Noteworthy, there
was an increase in agriculture industry contribution between the years 2010-11 and 2014 2012.
However, there was an agriculture industry decline between the years 2017 into early 2018 as
depicted in picture 3 herein (Trading Economics,N.d). According to World Bank Group
statistics, the German manufacturing industry growth declined in the year 2008 at 16.466$ to
15.603 in the year 2009. However, there was an industry growth in the year 2010(15.943$) but
the same dropped to 15.865 in the year 2011,15.732 in 2012,50.517 in 2013, 15.549 in
2014,15.816 in 2015 and 15.665$ in the year 2016 respectively. Simply put, there was an
agriculture industry growth in the year 2010 and the year 2015 respectively (World Bank Group,
N.d).
(Fred Economic, 2018) Retrieved from
https://fred.stlouisfed.org/series/PCAGDPDEA646NWDB
In recent times, the German agriculture GDP contribution has fluctuated. Noteworthy, there
was an increase in agriculture industry contribution between the years 2010-11 and 2014 2012.
However, there was an agriculture industry decline between the years 2017 into early 2018 as
depicted in picture 3 herein (Trading Economics,N.d). According to World Bank Group
statistics, the German manufacturing industry growth declined in the year 2008 at 16.466$ to
15.603 in the year 2009. However, there was an industry growth in the year 2010(15.943$) but
the same dropped to 15.865 in the year 2011,15.732 in 2012,50.517 in 2013, 15.549 in
2014,15.816 in 2015 and 15.665$ in the year 2016 respectively. Simply put, there was an
agriculture industry growth in the year 2010 and the year 2015 respectively (World Bank Group,
N.d).
Paraphrase This Document
Need a fresh take? Get an instant paraphrase of this document with our AI Paraphraser
Germany 7
Figure 3 (Trading Economics, 2019).Retrieved from
https://tradingeconomics.com/germany/gdp-from-agriculture
Over recent years, the German service industry value to the GDP has been on the rise since
the year 2008 to 2009. The economic growth is attributed to the low unemployment rates,
relatively low inflation, appreciation of the Euro against the American dollar and the low prices
of primary goods such as oil. Remarkably, there has been a steady growth of the German service
industry since the year 2011 to date (World Bank Group,N.d). Following the high manufacturing
expenses or costs, the manufacturing industry is not as competitive and productive as it used to
be hence the migration to the service sector which is less capital intensive. However, there was a
decline in the service industry between the year 2010 and 2011 respectively. At 2011, the
services industry contribution was valued at 62.872 in 2012 from 63.173 in the year 2011.
Labor Market Analysis
Notably, the unemployment rate in Germany since the year 2009 has decreased from
7.74% to 3.75% in the year 2017. However, in the year 2008, the unemployment rate stood at
8.66% and rose to 7.74 percent in the year 2009(Statista, N.d). More specifically, the
unemployment level in the year 2010 stood at 6.97%, 5.82 percent in the year 2011, 5.38 percent
in the year 2012, 5.23 percent in the year 2013, 4.98 percent in the year 2014, 4.62 percent in the
Germany 8
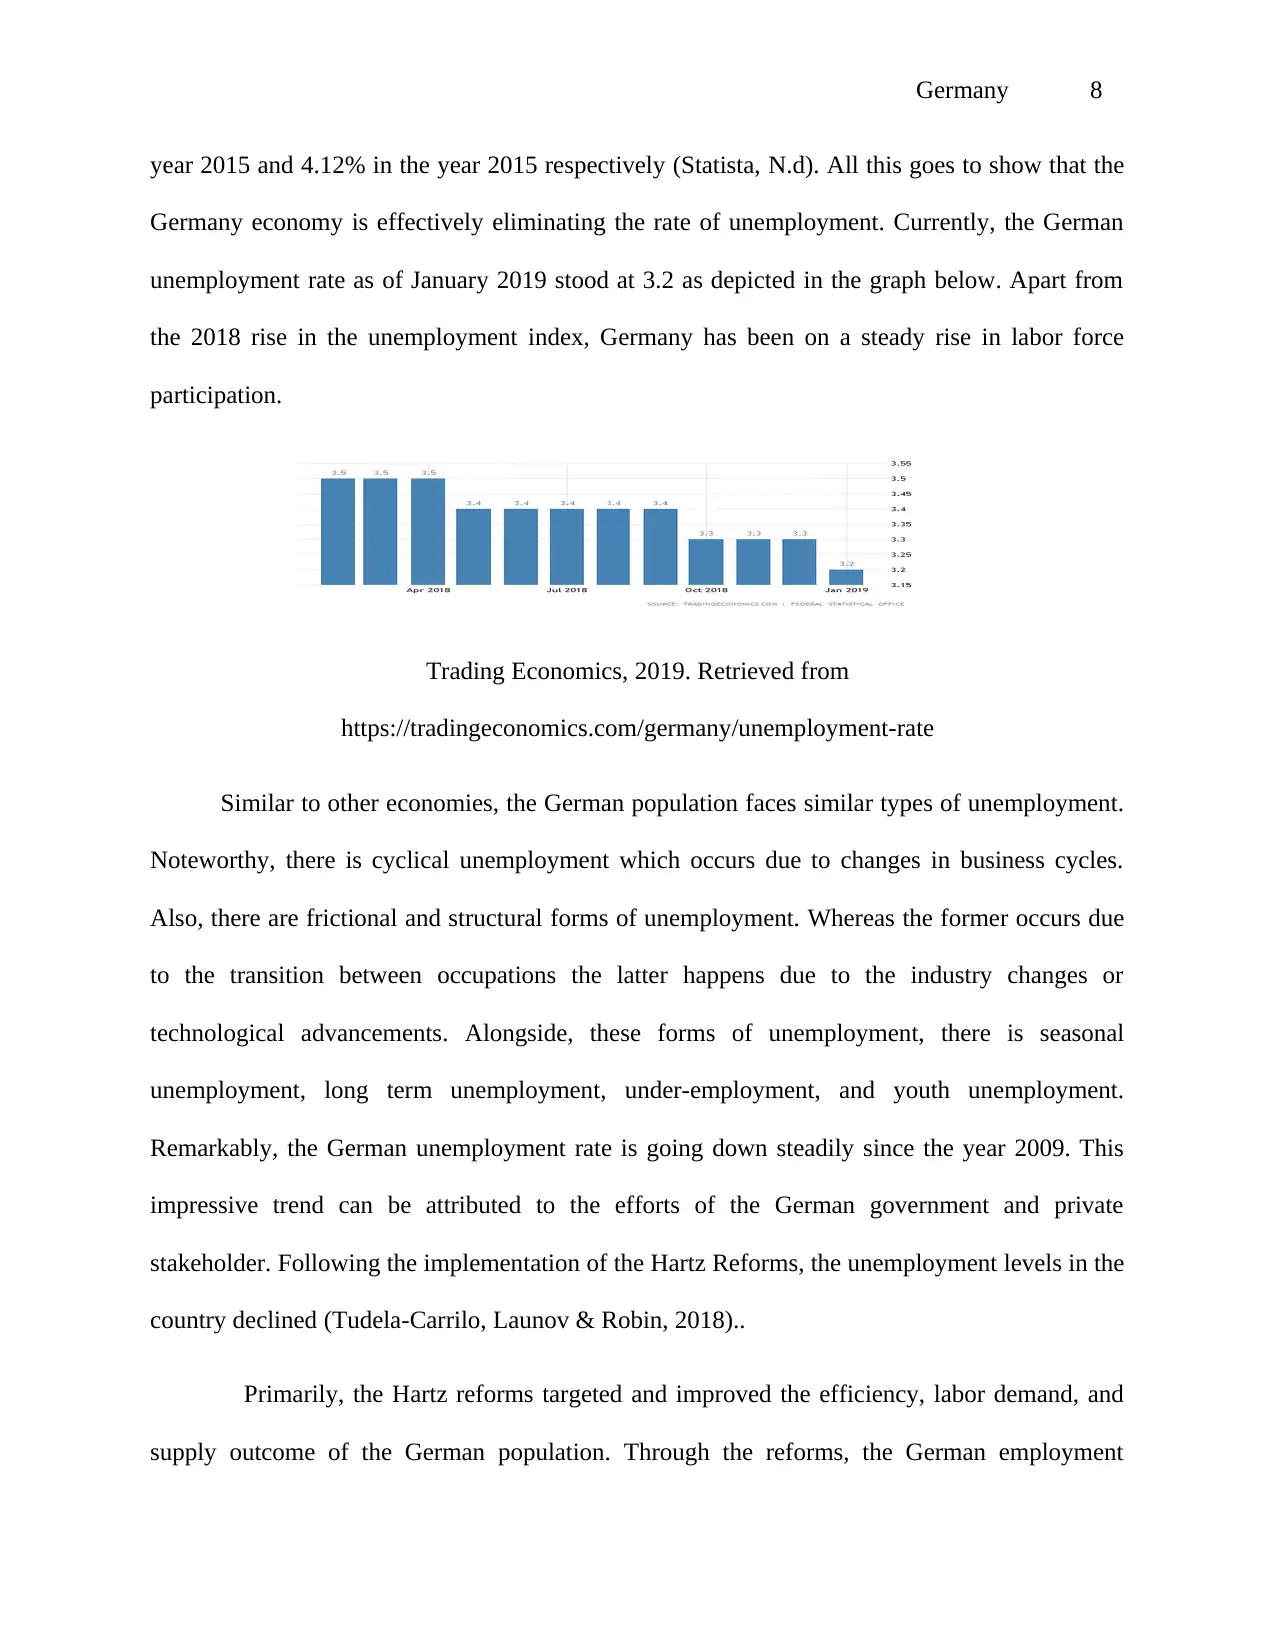
year 2015 and 4.12% in the year 2015 respectively (Statista, N.d). All this goes to show that the
Germany economy is effectively eliminating the rate of unemployment. Currently, the German
unemployment rate as of January 2019 stood at 3.2 as depicted in the graph below. Apart from
the 2018 rise in the unemployment index, Germany has been on a steady rise in labor force
participation.
Trading Economics, 2019. Retrieved from
https://tradingeconomics.com/germany/unemployment-rate
Similar to other economies, the German population faces similar types of unemployment.
Noteworthy, there is cyclical unemployment which occurs due to changes in business cycles.
Also, there are frictional and structural forms of unemployment. Whereas the former occurs due
to the transition between occupations the latter happens due to the industry changes or
technological advancements. Alongside, these forms of unemployment, there is seasonal
unemployment, long term unemployment, under-employment, and youth unemployment.
Remarkably, the German unemployment rate is going down steadily since the year 2009. This
impressive trend can be attributed to the efforts of the German government and private
stakeholder. Following the implementation of the Hartz Reforms, the unemployment levels in the
country declined (Tudela-Carrilo, Launov & Robin, 2018)..
Primarily, the Hartz reforms targeted and improved the efficiency, labor demand, and
supply outcome of the German population. Through the reforms, the German employment
⊘ This is a preview!⊘
Do you want full access?
Subscribe today to unlock all pages.
Trusted by 1+ million students worldwide
Germany 9
agency was made more efficient in its mandate to the unemployed German population.
Generally, the reforms discourage unemployment through harsh stances through the
Arbeitslonsenged II ( ALG II) benefits. According to the Eurostat statistic, the unemployment
rate in Germany has been reducing steadily as of 2008, the unemployment rate stood at 7.
Percent and at 2018 the average unemployment rate stood at 5.7 percent (Eurostat, 2018).
Majorly, there was higher unemployment among the youth. Undoubtedly, the German police
requiring employers to shorten working hours for workers during downturn business cycles has
helped keep many Germans in employment.
In addition, the German government has implemented short working programs as an
alternate choice for insurance/benefits for the unemployed. These initiatives have created
encouraged employment rather than retrenchment and layoffs which contribute to
unemployment. Subsequently, the fact that the German government adds 10 % of total wages in
the event that there is work sharing helps to keep most of the Germans employed. Also, the
implementation of hour banks has created more employment opportunities (Baker,2013).In an
effort to eliminated high unemployment rates, the German government reduced the benefits for
the long-term unemployed and placed tighter search for jobs and acceptance obligations on its
citizens hence the increase in labor participation in the country.
Price level analysis
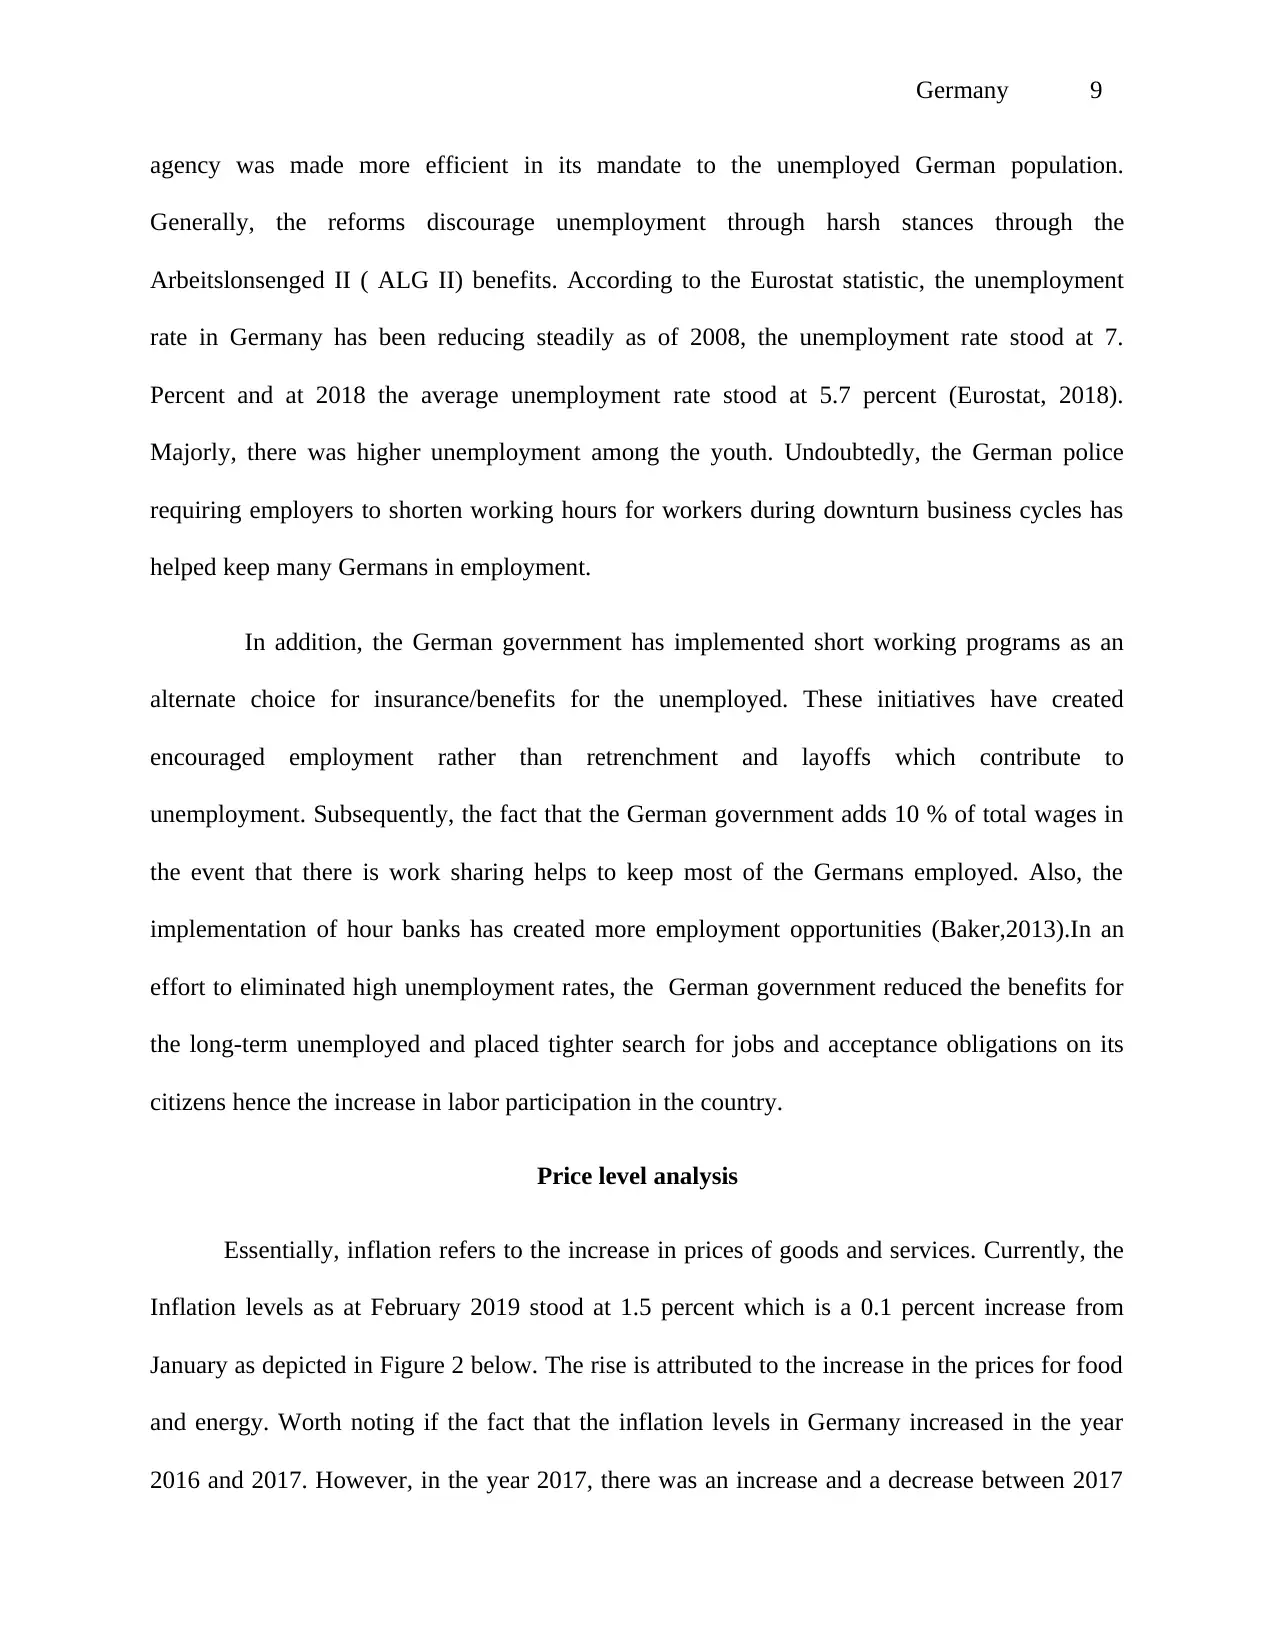
Essentially, inflation refers to the increase in prices of goods and services. Currently, the
Inflation levels as at February 2019 stood at 1.5 percent which is a 0.1 percent increase from
January as depicted in Figure 2 below. The rise is attributed to the increase in the prices for food
and energy. Worth noting if the fact that the inflation levels in Germany increased in the year
2016 and 2017. However, in the year 2017, there was an increase and a decrease between 2017
agency was made more efficient in its mandate to the unemployed German population.
Generally, the reforms discourage unemployment through harsh stances through the
Arbeitslonsenged II ( ALG II) benefits. According to the Eurostat statistic, the unemployment
rate in Germany has been reducing steadily as of 2008, the unemployment rate stood at 7.
Percent and at 2018 the average unemployment rate stood at 5.7 percent (Eurostat, 2018).
Majorly, there was higher unemployment among the youth. Undoubtedly, the German police
requiring employers to shorten working hours for workers during downturn business cycles has
helped keep many Germans in employment.
In addition, the German government has implemented short working programs as an
alternate choice for insurance/benefits for the unemployed. These initiatives have created
encouraged employment rather than retrenchment and layoffs which contribute to
unemployment. Subsequently, the fact that the German government adds 10 % of total wages in
the event that there is work sharing helps to keep most of the Germans employed. Also, the
implementation of hour banks has created more employment opportunities (Baker,2013).In an
effort to eliminated high unemployment rates, the German government reduced the benefits for
the long-term unemployed and placed tighter search for jobs and acceptance obligations on its
citizens hence the increase in labor participation in the country.
Price level analysis
Essentially, inflation refers to the increase in prices of goods and services. Currently, the
Inflation levels as at February 2019 stood at 1.5 percent which is a 0.1 percent increase from
January as depicted in Figure 2 below. The rise is attributed to the increase in the prices for food
and energy. Worth noting if the fact that the inflation levels in Germany increased in the year
2016 and 2017. However, in the year 2017, there was an increase and a decrease between 2017
Paraphrase This Document
Need a fresh take? Get an instant paraphrase of this document with our AI Paraphraser
Germany 10
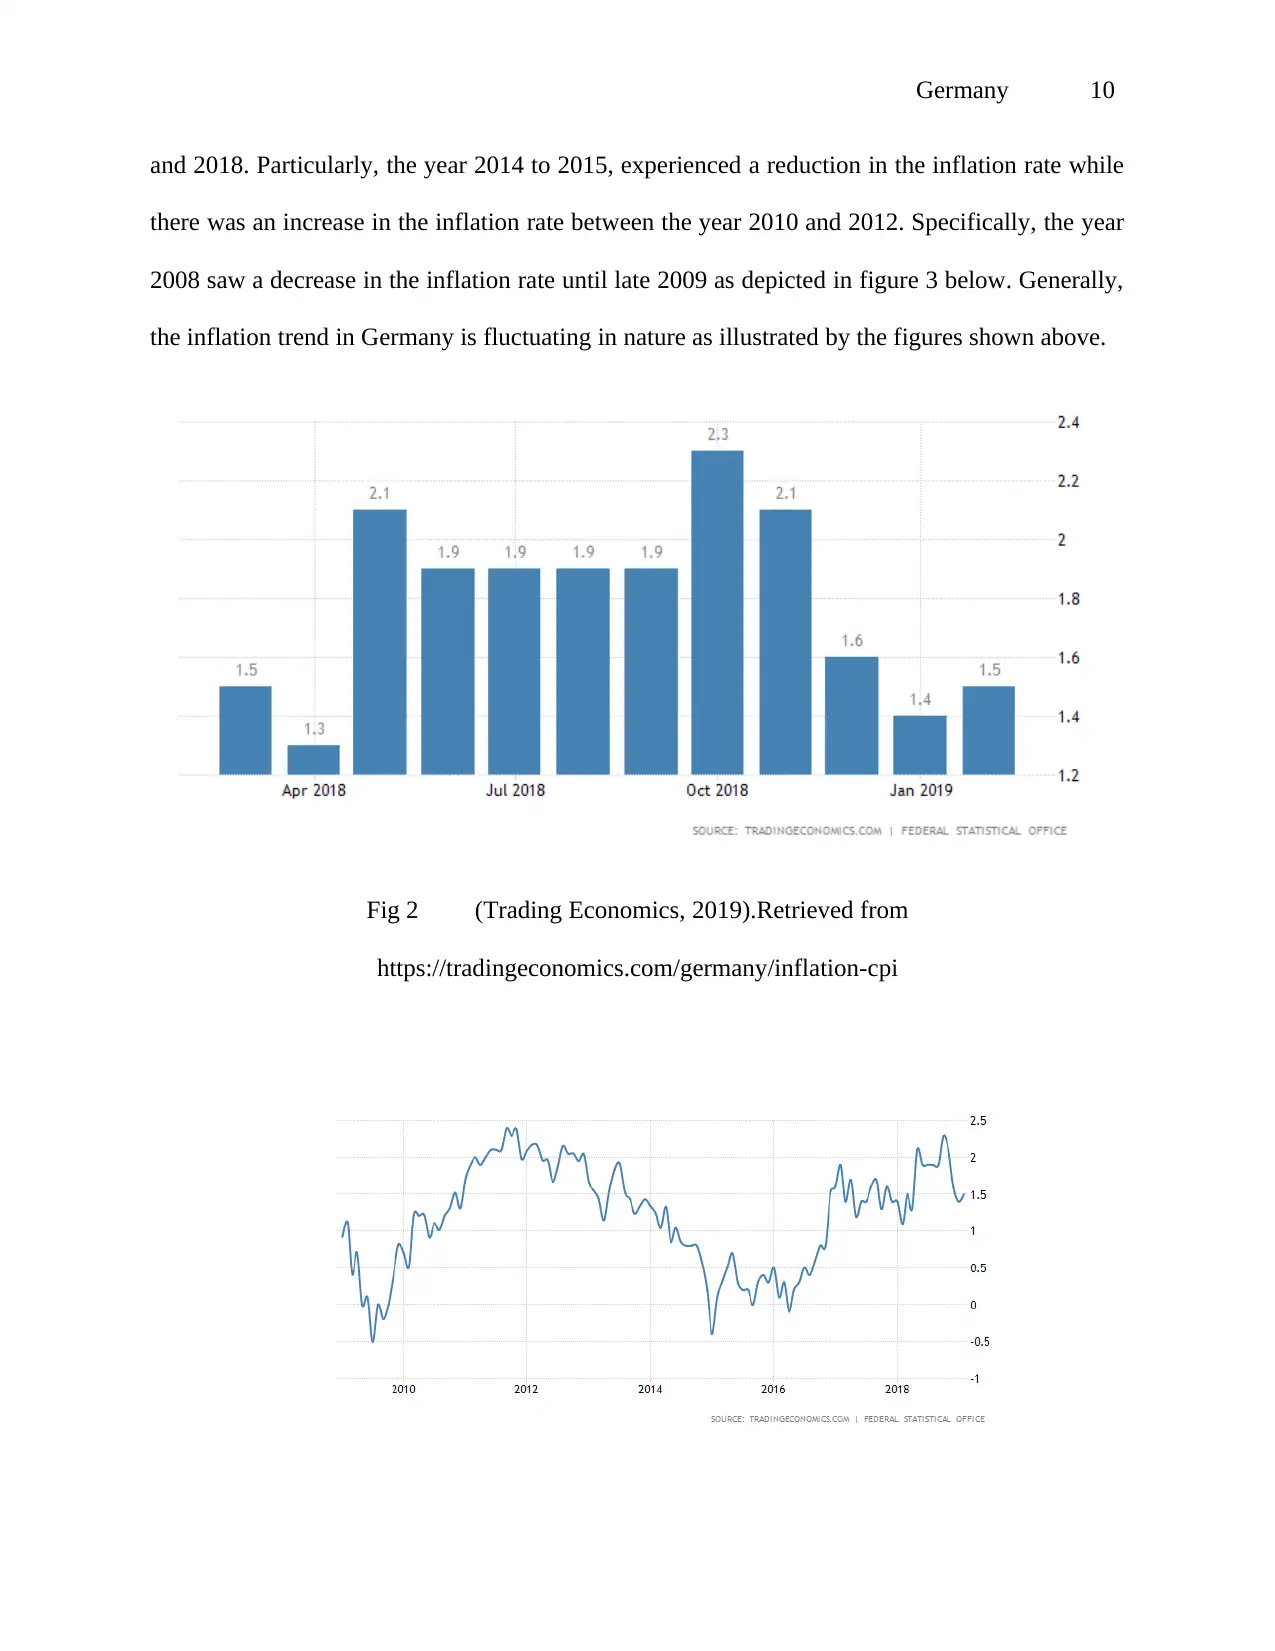
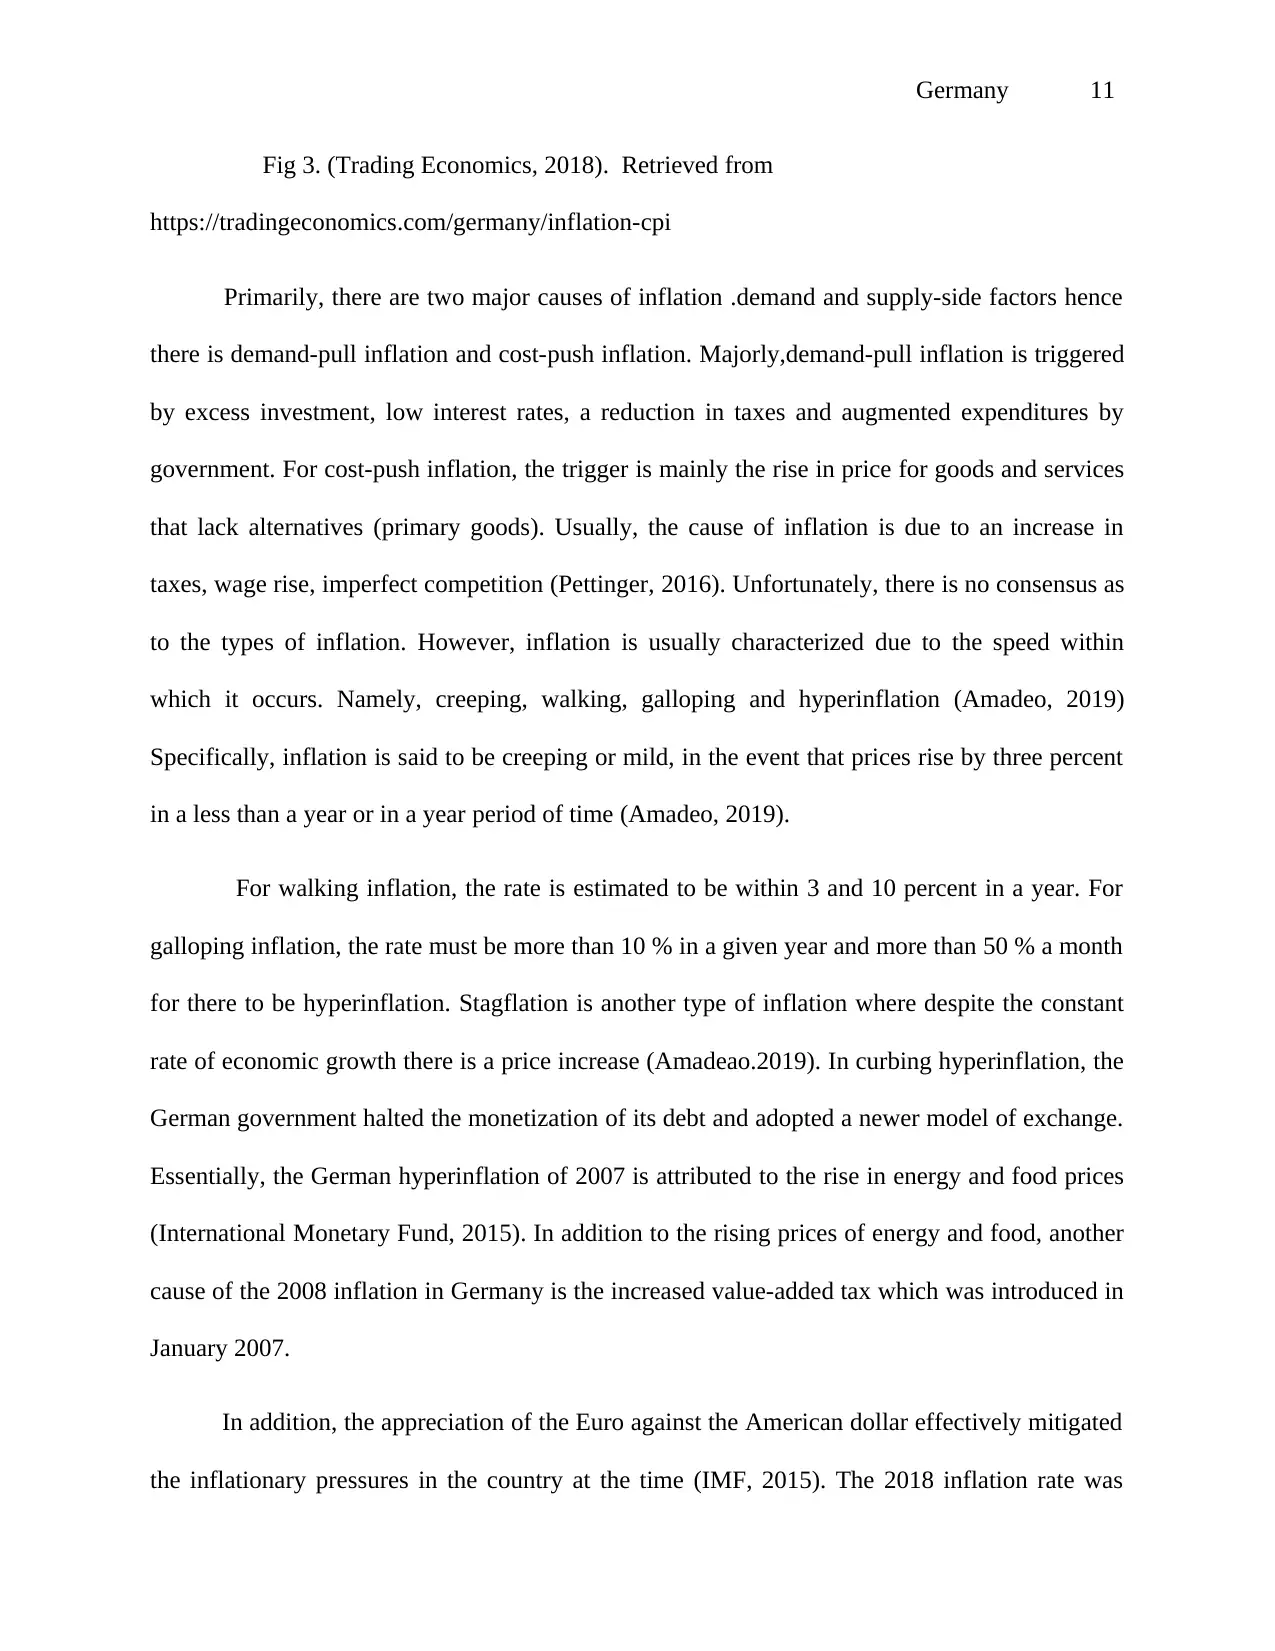
and 2018. Particularly, the year 2014 to 2015, experienced a reduction in the inflation rate while
there was an increase in the inflation rate between the year 2010 and 2012. Specifically, the year
2008 saw a decrease in the inflation rate until late 2009 as depicted in figure 3 below. Generally,
the inflation trend in Germany is fluctuating in nature as illustrated by the figures shown above.
Fig 2 (Trading Economics, 2019).Retrieved from
https://tradingeconomics.com/germany/inflation-cpi
Germany 11
Fig 3. (Trading Economics, 2018). Retrieved from
https://tradingeconomics.com/germany/inflation-cpi
Primarily, there are two major causes of inflation .demand and supply-side factors hence
there is demand-pull inflation and cost-push inflation. Majorly,demand-pull inflation is triggered
by excess investment, low interest rates, a reduction in taxes and augmented expenditures by
government. For cost-push inflation, the trigger is mainly the rise in price for goods and services
that lack alternatives (primary goods). Usually, the cause of inflation is due to an increase in
taxes, wage rise, imperfect competition (Pettinger, 2016). Unfortunately, there is no consensus as
to the types of inflation. However, inflation is usually characterized due to the speed within
which it occurs. Namely, creeping, walking, galloping and hyperinflation (Amadeo, 2019)
Specifically, inflation is said to be creeping or mild, in the event that prices rise by three percent
in a less than a year or in a year period of time (Amadeo, 2019).
For walking inflation, the rate is estimated to be within 3 and 10 percent in a year. For
galloping inflation, the rate must be more than 10 % in a given year and more than 50 % a month
for there to be hyperinflation. Stagflation is another type of inflation where despite the constant
rate of economic growth there is a price increase (Amadeao.2019). In curbing hyperinflation, the
German government halted the monetization of its debt and adopted a newer model of exchange.
Essentially, the German hyperinflation of 2007 is attributed to the rise in energy and food prices
(International Monetary Fund, 2015). In addition to the rising prices of energy and food, another
cause of the 2008 inflation in Germany is the increased value-added tax which was introduced in
January 2007.
In addition, the appreciation of the Euro against the American dollar effectively mitigated
the inflationary pressures in the country at the time (IMF, 2015). The 2018 inflation rate was
⊘ This is a preview!⊘
Do you want full access?
Subscribe today to unlock all pages.
Trusted by 1+ million students worldwide
1 out of 15
Related Documents


Your All-in-One AI-Powered Toolkit for Academic Success.
+13062052269
info@desklib.com
Available 24*7 on WhatsApp / Email
![[object Object]](/_next/static/media/star-bottom.7253800d.svg)
Unlock your academic potential
Copyright © 2020–2026 A2Z Services. All Rights Reserved. Developed and managed by ZUCOL.