An Economic Growth Analysis of Singapore: Econometrics Report
VerifiedAdded on 2023/03/30
|17
|3111
|213
Report
AI Summary
This report presents an econometric analysis of Singapore's economic growth, examining the influence of various factors on GDP per capita from 1988 to 2017. The study investigates the relationships between GDP growth and variables including population growth, real interest rates, inflation, foreign direct investment, and exports. A literature review explores the theoretical basis for these relationships, followed by an empirical analysis using regression models. The analysis includes descriptive statistics, an interpretation of estimated parameters, and hypothesis testing to assess the significance of each variable's impact on economic growth. The results of the regression analysis reveal the positive or negative impact of each variable on the economic growth. The report also addresses multicollinearity and concludes with a summary of findings and recommendations for future research. The research uses data from the World Bank to evaluate the economic growth in Singapore.
Running head: AN ECONOMIC GROWTH ANALYSIS OF SINGAPORE
An Economic Growth Analysis of Singapore
Name of the Student:
Name of the University:
Author Note:
An Economic Growth Analysis of Singapore
Name of the Student:
Name of the University:
Author Note:
Paraphrase This Document
Need a fresh take? Get an instant paraphrase of this document with our AI Paraphraser
1AN ECONOMIC GROWTH ANALYSIS OF SINGAPORE
Table of Contents
1. Introduction............................................................................................................................3
1.1 Background of the study..................................................................................................3
1.2 Problem statement............................................................................................................3
1.3 Research aim....................................................................................................................3
1.4 Data source.......................................................................................................................3
1.5 Research question.............................................................................................................4
2. Literature Review...................................................................................................................4
2.1 Relationship between growth of GDP per capita and growth of population...................4
2.2 Relationship between growth of GDP per capita and real interest rate...........................4
2.3 Relationship between growth of GDP per capita and inflation........................................5
2.4 Relationship between growth of GDP per capita and export...........................................5
2.5 Relationship between growth of GDP per capita and FDI...............................................5
3. Empirical Analysis.................................................................................................................6
3.1 Econometric Model..........................................................................................................6
3.2 Descriptive statistics.........................................................................................................6
3.3 Interpretation of estimated parameters.............................................................................7
3.3 Regression analysis..........................................................................................................7
4. Hypothesis Testing.................................................................................................................9
5. Multicolinearity....................................................................................................................11
5.1 Simple Correlation Coefficient......................................................................................11
5.2 Variance Inflation Factor...............................................................................................12

2AN ECONOMIC GROWTH ANALYSIS OF SINGAPORE
6. Conclusion............................................................................................................................12
7. Reference..............................................................................................................................14
6. Conclusion............................................................................................................................12
7. Reference..............................................................................................................................14
⊘ This is a preview!⊘
Do you want full access?
Subscribe today to unlock all pages.
Trusted by 1+ million students worldwide
3AN ECONOMIC GROWTH ANALYSIS OF SINGAPORE
1. Introduction
1.1 Background of the study
Economic growth of a country is defined as the growth of per capita gross domestic
product. Growth of per capita gross domestic product can be interpreted by the growth rate of
population, interest rate, inflation (consumer price index), foreign direct investment and
export of the country. The average gross domestic product for an individual of an economy
depends on the fiscal policy and monetary policy to control the economy by raising the GDP,
allocating money and time to achieve the targeted level of GDP. The availability of resources
reflects the economic growth. Economic growth can be measured by the growth of GDP per
capita.
1.2 Problem statement
The interest rate is one of the crucial factors that can determine the per capita GDP
growth (Semuel and Nurina 2015). Population is used to define the per capita GDP so the
growth rate of population is also an important factor. Foreign direct investment is another
factor which is significant in measuring the economic growth (Iamsiraroj and Ulubaşoğlu
2015). The inflation rate can influence the economic growth negatively (Aghion et al. 2017).
The above mentioned research results confirms that the economic growth depends on real
interest rate, inflation and foreign direct investment.
1.3 Research aim
The research is focused towards the influences of the variable on the economic
growth of Singapore. The variables are inflation, population growth rate, real interest rate,
foreign direct investment and export of Singapore.
Paraphrase This Document
Need a fresh take? Get an instant paraphrase of this document with our AI Paraphraser
4AN ECONOMIC GROWTH ANALYSIS OF SINGAPORE
1.4 Data source
The data for this study is collected economic indicator wise from the World Bank and
data of Singapore is extracted for the analysis (Data.worldbank.org, 2019). The indicators are
population, interest rate, inflation (consumer price index), foreign direct investment and
export of the country. The indicators are redefined and used in calculating new variables like
growth rate of population from the variable population according to the needs of the study.
The data is collected from the year 1988 to 2017 for each indicator. Thus, the analysis is
based on the above mentioned variables for 30 years.
1.5 Research question
Singapore is highly developed economy that has been marked as more open
economy. Over the last few decades Singapore is growing economically that can be seen by
the economic stability in the meantime of global crisis in 2008. The aim is to check whether
the mentioned variables are able or not to predict the economy by taking fiscal and monetary
decisions to boost the economy.
2. Literature Review
2.1 Relationship between growth of GDP per capita and growth of population
GDP per capita is a good indicator of an economic growth and status. GDP per capita
is defined by the average economic output for each individual. It is derived by dividing the
country’s gross domestic product with the total population. So, if the growth of population is
positive then the growth of GDP per capita will be negative. A study based in UK presents a
result that the relation between population growth and economic growth is weak. The
improvement of productivity is not significant in case of improving the growth of economic
output (Piketty 2014). This is because of increasing population growth which implies that the
economic growth is dependent on labour intensive industries (Berry 2014).
5AN ECONOMIC GROWTH ANALYSIS OF SINGAPORE
2.2 Relationship between growth of GDP per capita and real interest rate
The real interest is the interest rate adjusted with the current inflation. Interest rate
influence the GDP of an economy indirectly. It depends on the money supply and impacts the
inflation. In this way, the rising interest rate lowers the real GDP and thus the GDP per capita
(Elmendorf and Sheiner 2017). The relation between potential growth and interest rate is
expected to be as weaker interest rate leads to weaker long-run growth by the CBO and
FOMC participants (Leduc and Rudebusch 2014).
2.3 Relationship between growth of GDP per capita and inflation
The inflation means the price level has gone up which reduces the purchasing power
of consumption and thus reduces the GDP (Iancu 2017). Keeping the other factors constant, it
can be said that the inflation can reduce the GDP per capita (Baharumshah, Slesman and
Wohar 2016). An empirical study concluded that there exist a relation between economic
growth and inflation (Santaeulàlia-Llopis and Zheng 2018).
2.4 Relationship between growth of GDP per capita and export
Granger causality test shows that GDP causes to raise the export but the export does
not cause to change the GDP (Bakari and Krit 2017). A study shows that the export of India
cannot influence the growth of GDP and it claims that the large domestic market of the
county is the reason (Ashwarya 2017). So, here the effect of export is incorporated to check
the impact of export through a linear regression.
2.5 Relationship between growth of GDP per capita and FDI
Foreign direct investment have been proved that it accelerates the economic growth of
countries especially in under developing countries. There are several studies that concludes
that the FDI plays an ambiguous role in contributing to the economic growth of an economy
(Sengupta and Puri 2018). The empirical results of the research confirm that there exists a
⊘ This is a preview!⊘
Do you want full access?
Subscribe today to unlock all pages.
Trusted by 1+ million students worldwide
6AN ECONOMIC GROWTH ANALYSIS OF SINGAPORE
causal effect of FDI on growth for the specific countries that has been considered for the
research (Vogiatzoglou and Thi 2016). The study was also confirmed by the other empirical
studies (Tan and Tang 2016).
3. Empirical Analysis
3.1 Econometric Model
The research is based on the economic growth of Singapore presented by growth rate
of GDP (GDP) as a function of growth of population (GRPOP), real interest rate (RINR),
inflation (CPI), foreign direct investment (LDINV) and export (LEXPORT) of the country.
Therefore the function is:
GDP=f (GRPOP , RINR , CPI , LDINV , LEXPORT )
The regression model is used to measure the economic growth using the economic
data of Singapore. The econometric model which is used in the research is presented below:
GDP=β1 CPIt + β2 GRPOPt + β3 RINRt +β4 LDINV t + β5 LEXPORT t +εt
β1, β2, β3, β4 and β5 are the coefficient of the independent variable
CPIt , GRPOPt , RINRt , LDINV t∧LEXPORT t
3.2 Descriptive statistics
It is important to mention that the variables FDI and export are reduced to its log
value to reduce the variance of the variable and outlier effects of the variable on the growth
of GDP per capita.
The below table presents the descriptive statistics of the dependent variable and
independent variables. It presents the location, shape and spread of the variables.
Table 1: Summary Statistics of the Variables
Paraphrase This Document
Need a fresh take? Get an instant paraphrase of this document with our AI Paraphraser
7AN ECONOMIC GROWTH ANALYSIS OF SINGAPORE
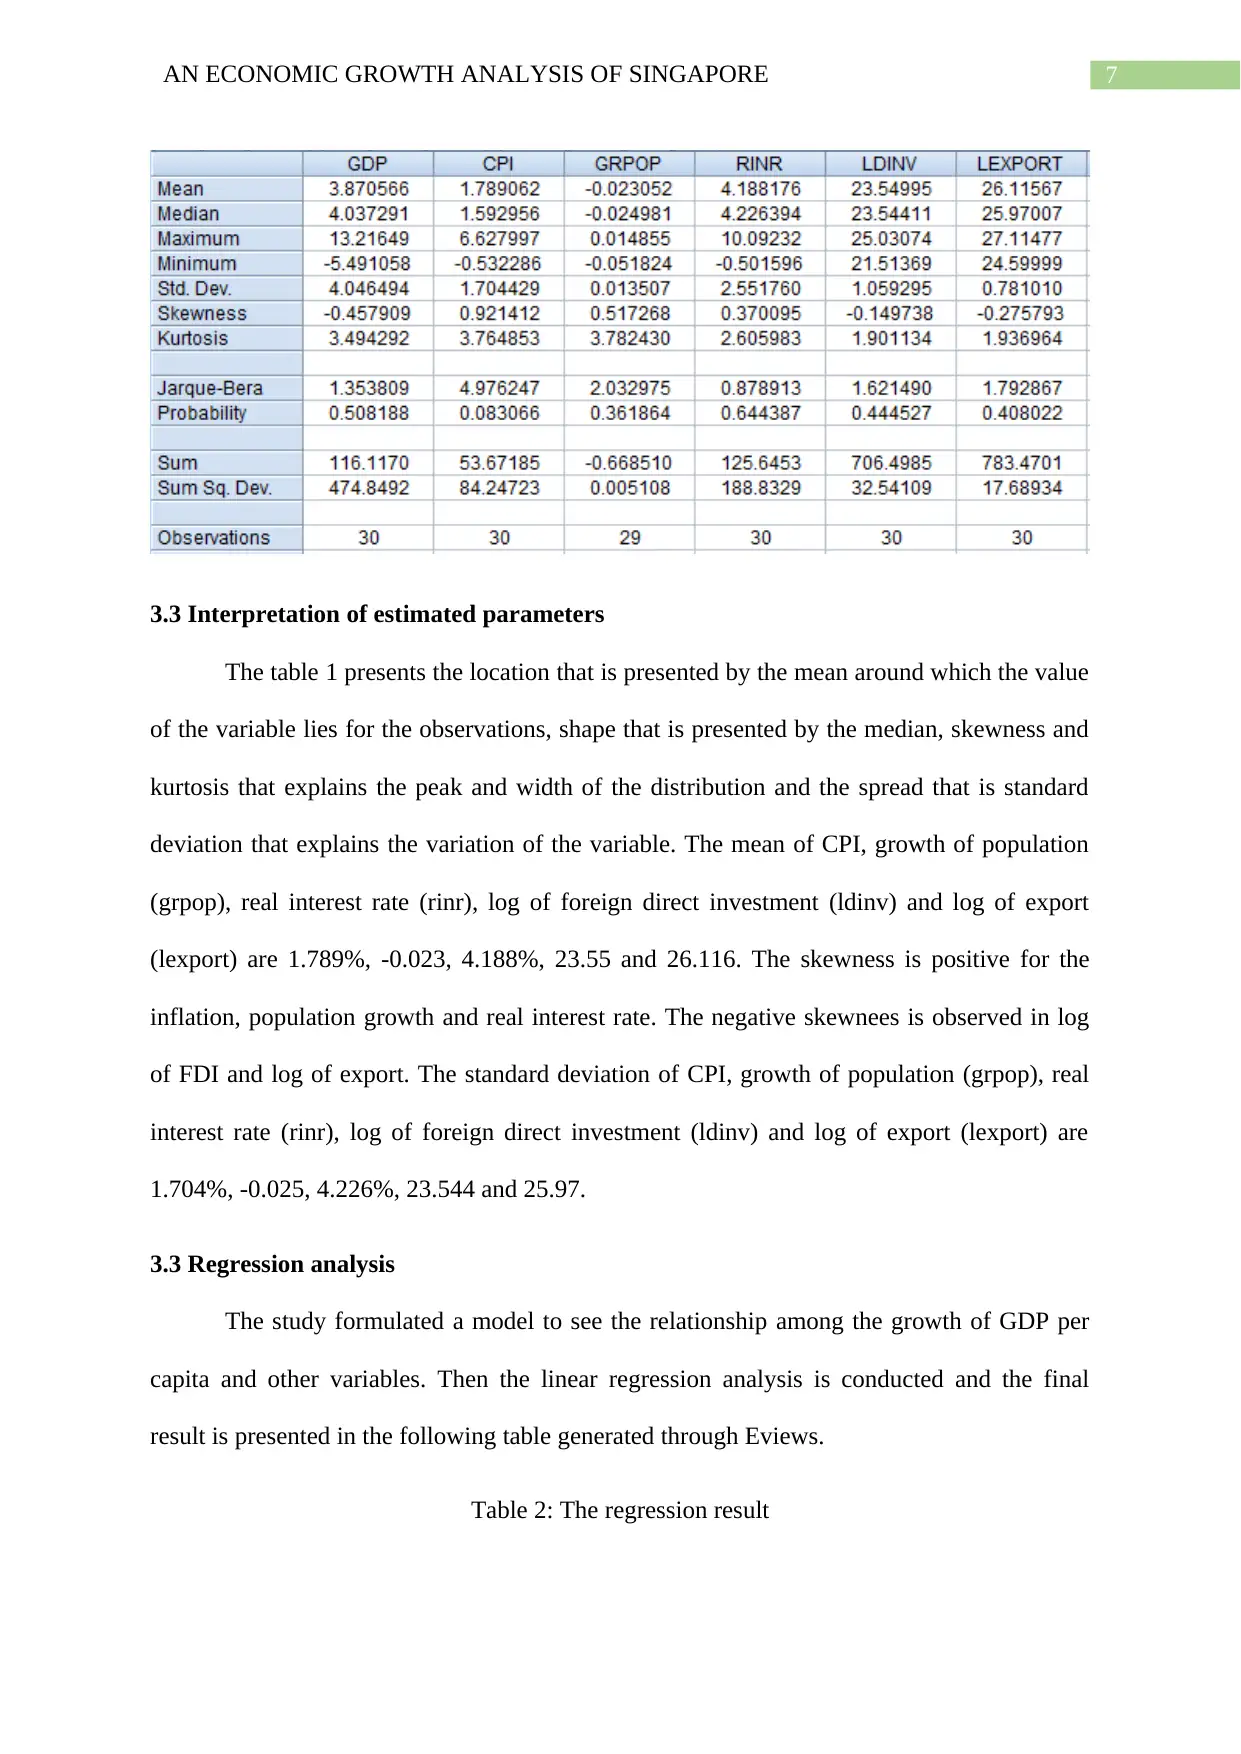
3.3 Interpretation of estimated parameters
The table 1 presents the location that is presented by the mean around which the value
of the variable lies for the observations, shape that is presented by the median, skewness and
kurtosis that explains the peak and width of the distribution and the spread that is standard
deviation that explains the variation of the variable. The mean of CPI, growth of population
(grpop), real interest rate (rinr), log of foreign direct investment (ldinv) and log of export
(lexport) are 1.789%, -0.023, 4.188%, 23.55 and 26.116. The skewness is positive for the
inflation, population growth and real interest rate. The negative skewnees is observed in log
of FDI and log of export. The standard deviation of CPI, growth of population (grpop), real
interest rate (rinr), log of foreign direct investment (ldinv) and log of export (lexport) are
1.704%, -0.025, 4.226%, 23.544 and 25.97.
3.3 Regression analysis
The study formulated a model to see the relationship among the growth of GDP per
capita and other variables. Then the linear regression analysis is conducted and the final
result is presented in the following table generated through Eviews.
Table 2: The regression result
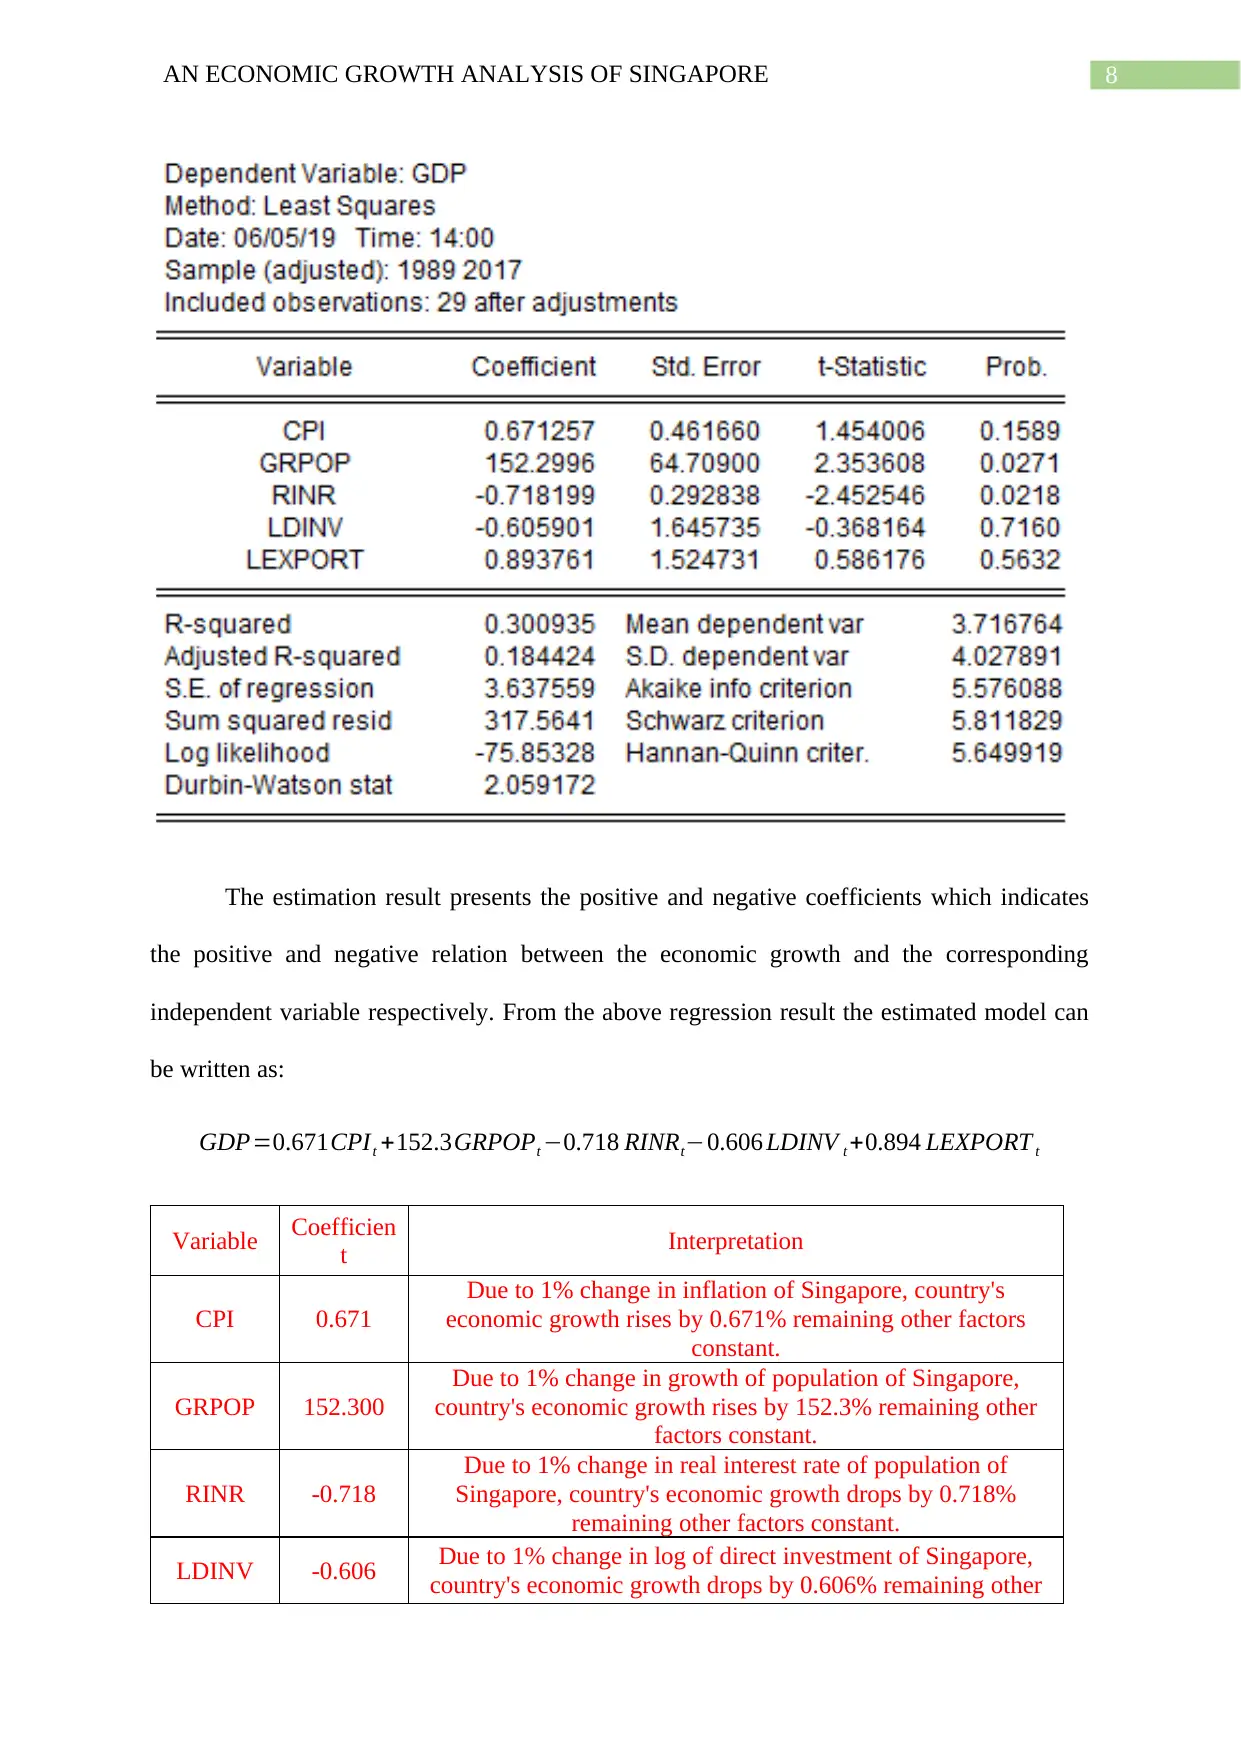
8AN ECONOMIC GROWTH ANALYSIS OF SINGAPORE
The estimation result presents the positive and negative coefficients which indicates
the positive and negative relation between the economic growth and the corresponding
independent variable respectively. From the above regression result the estimated model can
be written as:
GDP=0.671CPIt +152.3GRPOPt −0.718 RINRt−0.606 LDINV t +0.894 LEXPORT t
Variable Coefficien
t Interpretation
CPI 0.671
Due to 1% change in inflation of Singapore, country's
economic growth rises by 0.671% remaining other factors
constant.
GRPOP 152.300
Due to 1% change in growth of population of Singapore,
country's economic growth rises by 152.3% remaining other
factors constant.
RINR -0.718
Due to 1% change in real interest rate of population of
Singapore, country's economic growth drops by 0.718%
remaining other factors constant.
LDINV -0.606 Due to 1% change in log of direct investment of Singapore,
country's economic growth drops by 0.606% remaining other
⊘ This is a preview!⊘
Do you want full access?
Subscribe today to unlock all pages.
Trusted by 1+ million students worldwide
9AN ECONOMIC GROWTH ANALYSIS OF SINGAPORE
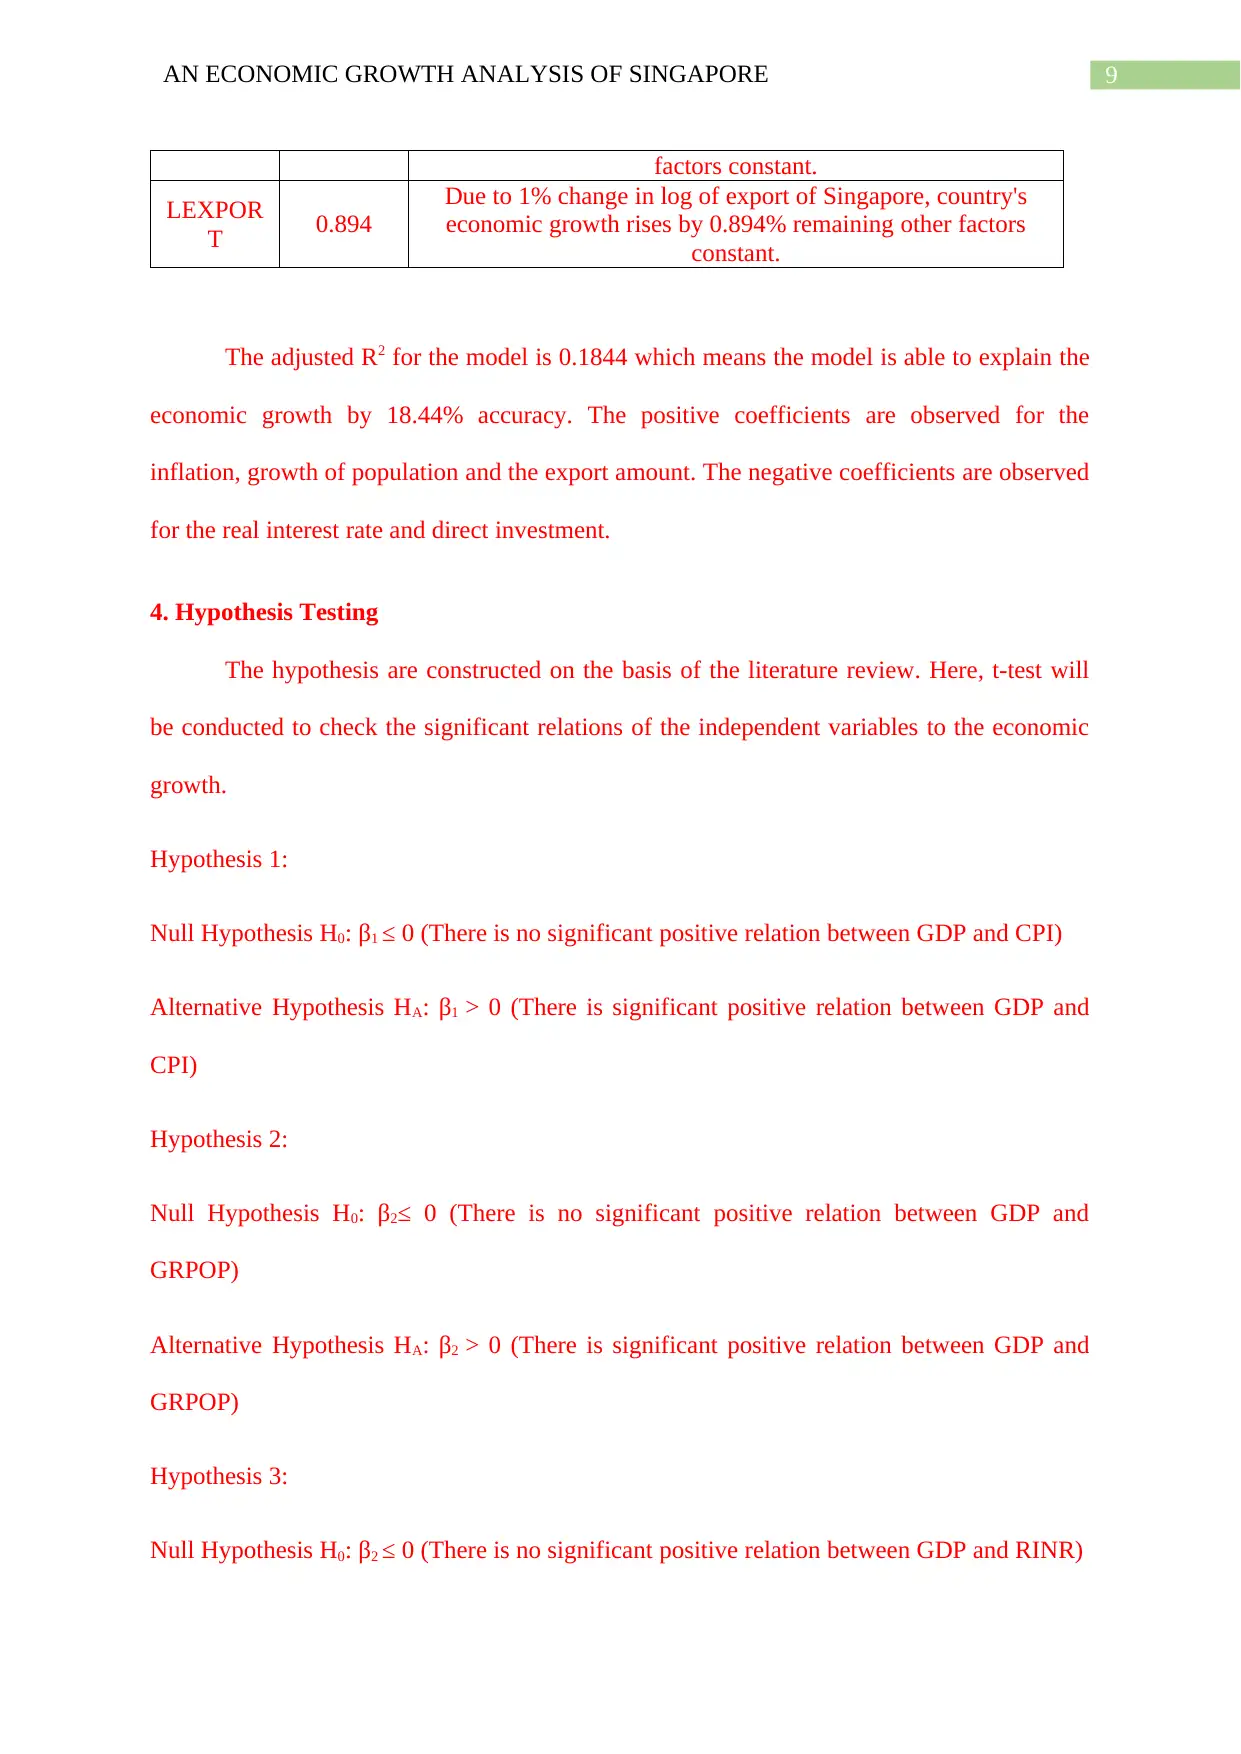
factors constant.
LEXPOR
T 0.894
Due to 1% change in log of export of Singapore, country's
economic growth rises by 0.894% remaining other factors
constant.
The adjusted R2 for the model is 0.1844 which means the model is able to explain the
economic growth by 18.44% accuracy. The positive coefficients are observed for the
inflation, growth of population and the export amount. The negative coefficients are observed
for the real interest rate and direct investment.
4. Hypothesis Testing
The hypothesis are constructed on the basis of the literature review. Here, t-test will
be conducted to check the significant relations of the independent variables to the economic
growth.
Hypothesis 1:
Null Hypothesis H0: β1 ≤ 0 (There is no significant positive relation between GDP and CPI)
Alternative Hypothesis HA: β1 > 0 (There is significant positive relation between GDP and
CPI)
Hypothesis 2:
Null Hypothesis H0: β2≤ 0 (There is no significant positive relation between GDP and
GRPOP)
Alternative Hypothesis HA: β2 > 0 (There is significant positive relation between GDP and
GRPOP)
Hypothesis 3:
Null Hypothesis H0: β2 ≤ 0 (There is no significant positive relation between GDP and RINR)
Paraphrase This Document
Need a fresh take? Get an instant paraphrase of this document with our AI Paraphraser
10AN ECONOMIC GROWTH ANALYSIS OF SINGAPORE
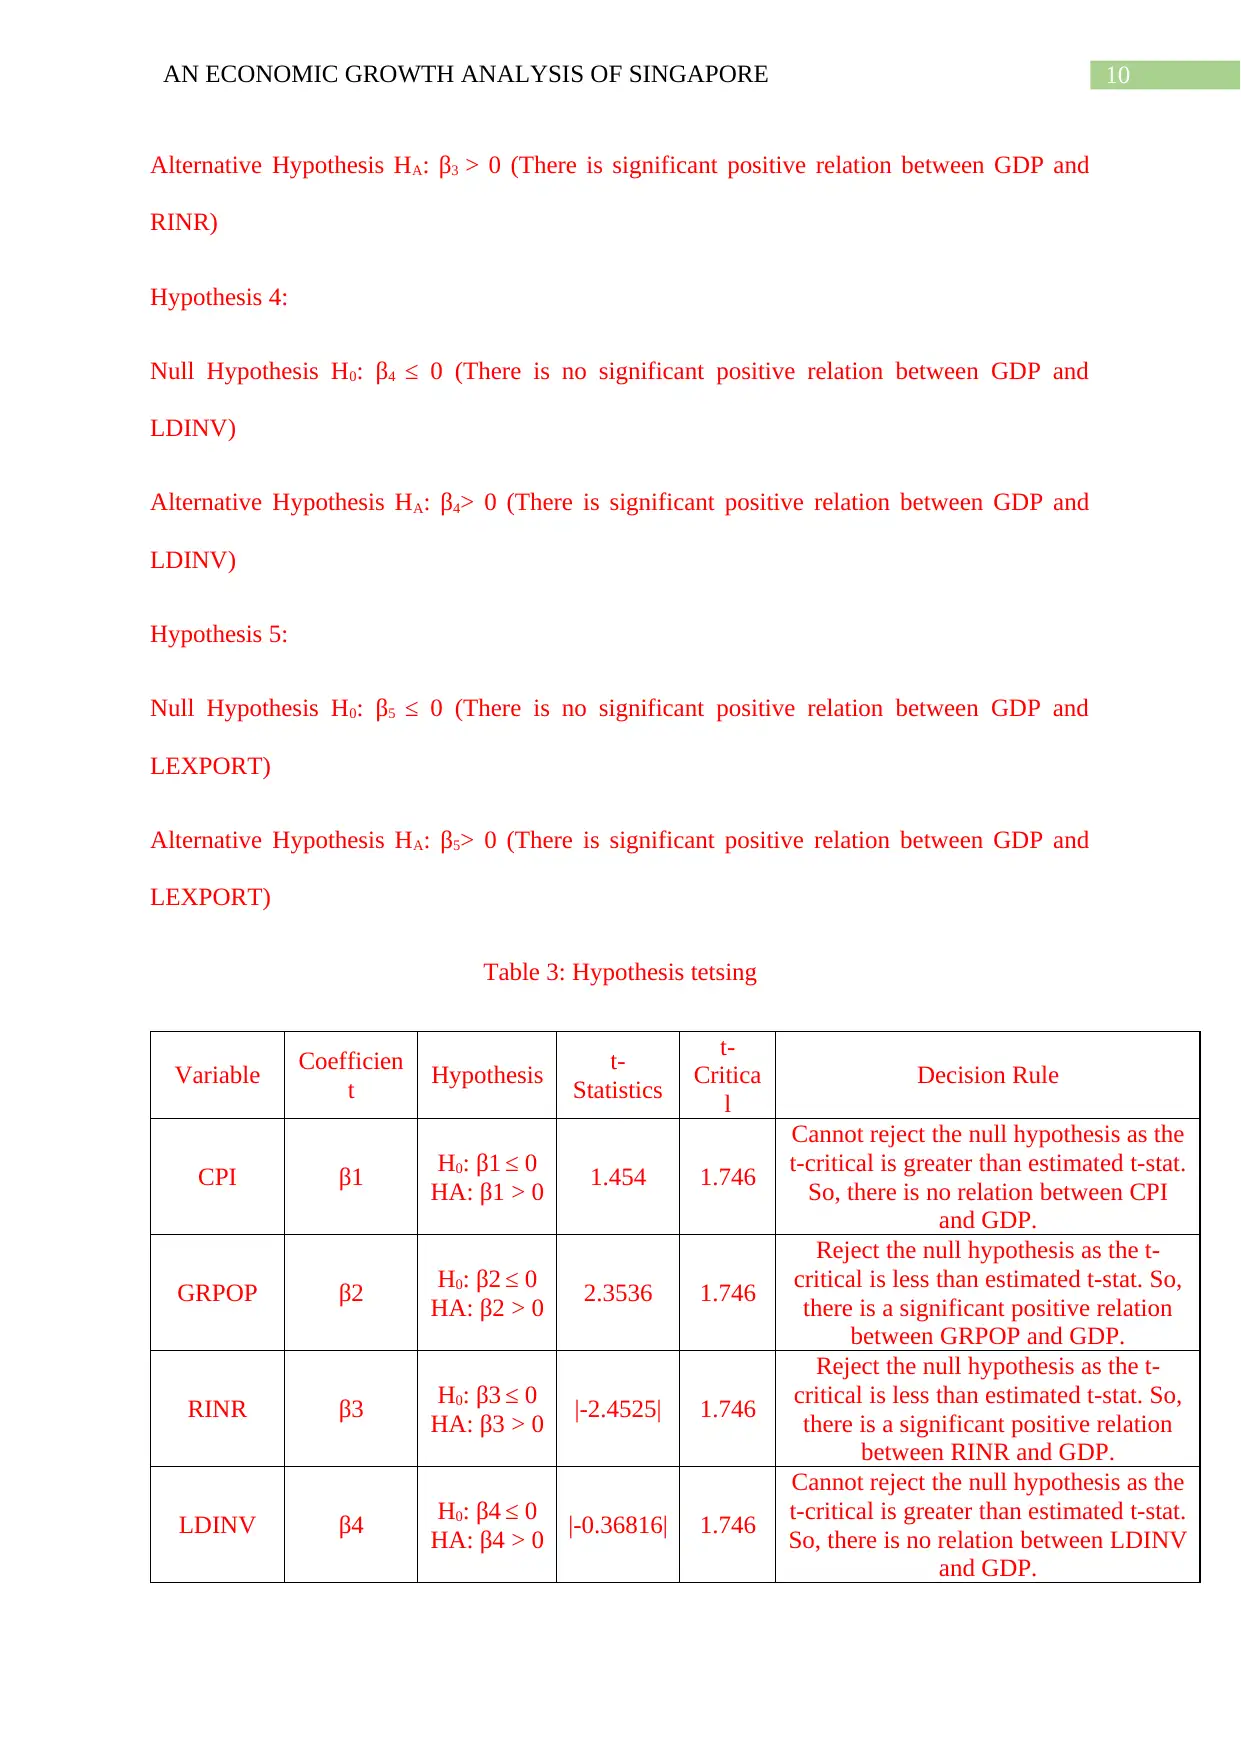
Alternative Hypothesis HA: β3 > 0 (There is significant positive relation between GDP and
RINR)
Hypothesis 4:
Null Hypothesis H0: β4 ≤ 0 (There is no significant positive relation between GDP and
LDINV)
Alternative Hypothesis HA: β4> 0 (There is significant positive relation between GDP and
LDINV)
Hypothesis 5:
Null Hypothesis H0: β5 ≤ 0 (There is no significant positive relation between GDP and
LEXPORT)
Alternative Hypothesis HA: β5> 0 (There is significant positive relation between GDP and
LEXPORT)
Table 3: Hypothesis tetsing
Variable Coefficien
t Hypothesis t-
Statistics
t-
Critica
l
Decision Rule
CPI β1 H0: β1 ≤ 0
HA: β1 > 0 1.454 1.746
Cannot reject the null hypothesis as the
t-critical is greater than estimated t-stat.
So, there is no relation between CPI
and GDP.
GRPOP β2 H0: β2 ≤ 0
HA: β2 > 0 2.3536 1.746
Reject the null hypothesis as the t-
critical is less than estimated t-stat. So,
there is a significant positive relation
between GRPOP and GDP.
RINR β3 H0: β3 ≤ 0
HA: β3 > 0 |-2.4525| 1.746
Reject the null hypothesis as the t-
critical is less than estimated t-stat. So,
there is a significant positive relation
between RINR and GDP.
LDINV β4 H0: β4 ≤ 0
HA: β4 > 0 |-0.36816| 1.746
Cannot reject the null hypothesis as the
t-critical is greater than estimated t-stat.
So, there is no relation between LDINV
and GDP.
11AN ECONOMIC GROWTH ANALYSIS OF SINGAPORE
LEXPOR
T β5 H0: β5 ≤ 0
HA: β5 > 0 0.5862 1.746
Cannot reject the null hypothesis as the
t-critical is greater than estimated t-stat.
So, there is no relation between
LEXPORT and GDP.
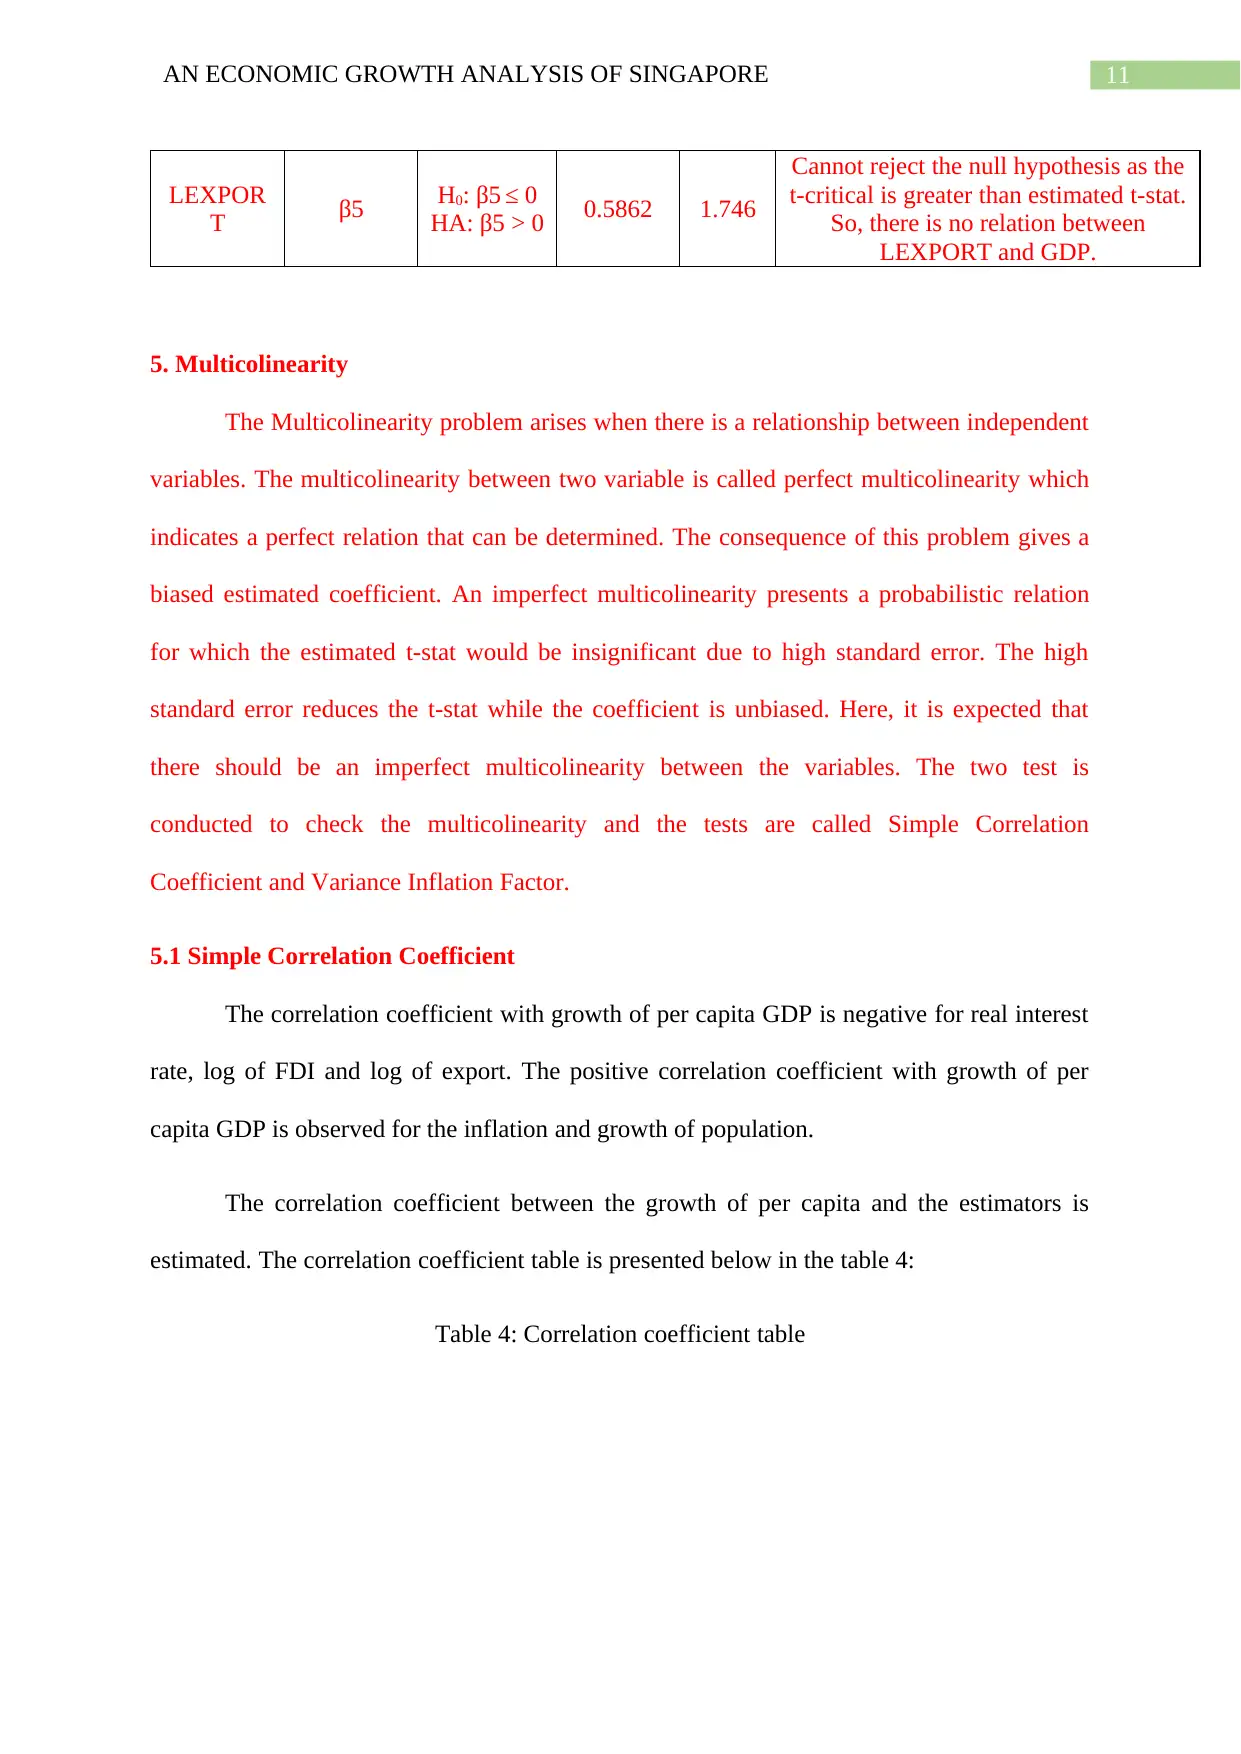
5. Multicolinearity
The Multicolinearity problem arises when there is a relationship between independent
variables. The multicolinearity between two variable is called perfect multicolinearity which
indicates a perfect relation that can be determined. The consequence of this problem gives a
biased estimated coefficient. An imperfect multicolinearity presents a probabilistic relation
for which the estimated t-stat would be insignificant due to high standard error. The high
standard error reduces the t-stat while the coefficient is unbiased. Here, it is expected that
there should be an imperfect multicolinearity between the variables. The two test is
conducted to check the multicolinearity and the tests are called Simple Correlation
Coefficient and Variance Inflation Factor.
5.1 Simple Correlation Coefficient
The correlation coefficient with growth of per capita GDP is negative for real interest
rate, log of FDI and log of export. The positive correlation coefficient with growth of per
capita GDP is observed for the inflation and growth of population.
The correlation coefficient between the growth of per capita and the estimators is
estimated. The correlation coefficient table is presented below in the table 4:
Table 4: Correlation coefficient table
LEXPOR
T β5 H0: β5 ≤ 0
HA: β5 > 0 0.5862 1.746
Cannot reject the null hypothesis as the
t-critical is greater than estimated t-stat.
So, there is no relation between
LEXPORT and GDP.
5. Multicolinearity
The Multicolinearity problem arises when there is a relationship between independent
variables. The multicolinearity between two variable is called perfect multicolinearity which
indicates a perfect relation that can be determined. The consequence of this problem gives a
biased estimated coefficient. An imperfect multicolinearity presents a probabilistic relation
for which the estimated t-stat would be insignificant due to high standard error. The high
standard error reduces the t-stat while the coefficient is unbiased. Here, it is expected that
there should be an imperfect multicolinearity between the variables. The two test is
conducted to check the multicolinearity and the tests are called Simple Correlation
Coefficient and Variance Inflation Factor.
5.1 Simple Correlation Coefficient
The correlation coefficient with growth of per capita GDP is negative for real interest
rate, log of FDI and log of export. The positive correlation coefficient with growth of per
capita GDP is observed for the inflation and growth of population.
The correlation coefficient between the growth of per capita and the estimators is
estimated. The correlation coefficient table is presented below in the table 4:
Table 4: Correlation coefficient table
⊘ This is a preview!⊘
Do you want full access?
Subscribe today to unlock all pages.
Trusted by 1+ million students worldwide
1 out of 17
Related Documents


Your All-in-One AI-Powered Toolkit for Academic Success.
+13062052269
info@desklib.com
Available 24*7 on WhatsApp / Email
![[object Object]](/_next/static/media/star-bottom.7253800d.svg)
Unlock your academic potential
Copyright © 2020–2026 A2Z Services. All Rights Reserved. Developed and managed by ZUCOL.