Determination of Macroeconomic Performance of Australia and USA
VerifiedAdded on 2020/04/07
|16
|2970
|79
Report
AI Summary
This report provides a comprehensive analysis of the macroeconomic performance of Australia and the USA, focusing on the period from 1985 to 2015. The study examines key economic indicators including real GDP growth, yearly exchange rate movements, net exports growth rate, and interest rates to determine the extent to which the USA's economic performance affects Australia's economy. The report finds that while both economies are influenced by global events, Australia's economy is also affected by changes in the USA. The analysis includes graphical representations of the data and divides the study period into distinct phases to better understand trends. The report concludes by summarizing the key findings and highlighting the interdependencies between the two economies. This report, available on Desklib, aims to provide a comparative overview of the economic performances of Australia and the USA.
Running head: EVALUATION OF MACROECONOMIC PERFORMANCE
DETERMINATION OF MACROECONOMIC PERFORMANCE OF AUSTRALIA AND USA
Name of student:
Name of University:
Author note:
DETERMINATION OF MACROECONOMIC PERFORMANCE OF AUSTRALIA AND USA
Name of student:
Name of University:
Author note:
Paraphrase This Document
Need a fresh take? Get an instant paraphrase of this document with our AI Paraphraser
Running head: EVALUATION OF MACROECONOMIC PERFORMANCE
Executive summary
This report on Australian economy and USA economy shows that Australia is affected by
changes that occurred in USA. For evaluating the result this report considered the time period
from 1985 to 2015 and focused on factors that are GDP, interest rate, net export and yearly
exchange rate. Result from these indicators shows that Australia is affected by USA economy
and this resulted in expansion of economy. Although both countries performance are being
affected by global events which in turn affected the performance of the both economies.
Running head: EVALUATION OF MACROECONOMIC PERFORMANCE
Table of Contents
Introduction...................................................................................................................................4
Discussion...................................................................................................................................... 5
Real GDP growth of Australia and USA......................................................................................6
Yearly Exchange rate movement in Australia and USA..............................................................9
Net Exports growth rate of Australia and USA.........................................................................11
Interest rate of Australia and USA...........................................................................................12
Conclusion................................................................................................................................... 14
References................................................................................................................................... 15
⊘ This is a preview!⊘
Do you want full access?
Subscribe today to unlock all pages.
Trusted by 1+ million students worldwide
Running head: EVALUATION OF MACROECONOMIC PERFORMANCE
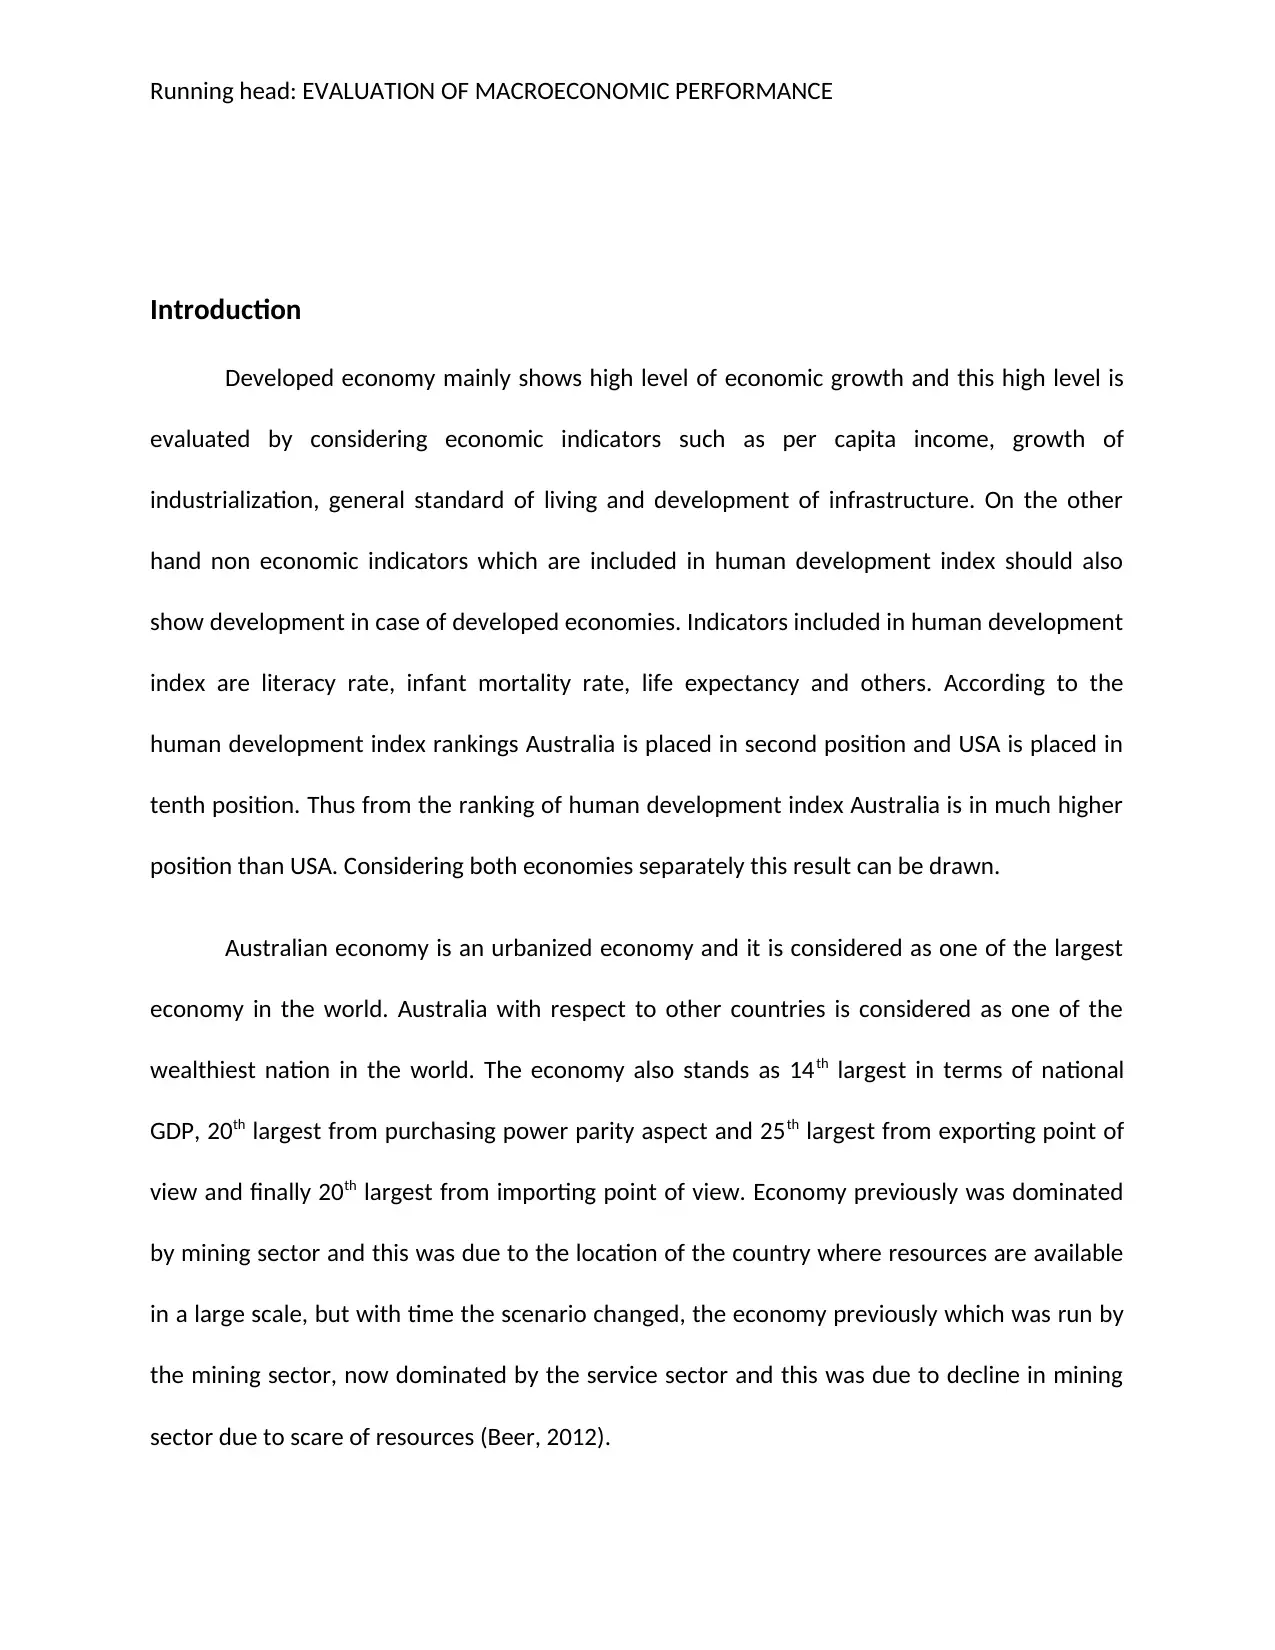
Introduction
Developed economy mainly shows high level of economic growth and this high level is
evaluated by considering economic indicators such as per capita income, growth of
industrialization, general standard of living and development of infrastructure. On the other
hand non economic indicators which are included in human development index should also
show development in case of developed economies. Indicators included in human development
index are literacy rate, infant mortality rate, life expectancy and others. According to the
human development index rankings Australia is placed in second position and USA is placed in
tenth position. Thus from the ranking of human development index Australia is in much higher
position than USA. Considering both economies separately this result can be drawn.
Australian economy is an urbanized economy and it is considered as one of the largest
economy in the world. Australia with respect to other countries is considered as one of the
wealthiest nation in the world. The economy also stands as 14th largest in terms of national
GDP, 20th largest from purchasing power parity aspect and 25th largest from exporting point of
view and finally 20th largest from importing point of view. Economy previously was dominated
by mining sector and this was due to the location of the country where resources are available
in a large scale, but with time the scenario changed, the economy previously which was run by
the mining sector, now dominated by the service sector and this was due to decline in mining
sector due to scare of resources (Beer, 2012).
Paraphrase This Document
Need a fresh take? Get an instant paraphrase of this document with our AI Paraphraser
Running head: EVALUATION OF MACROECONOMIC PERFORMANCE
USA economy is one of the world’s biggest economies. From the point of view of
purchasing power parity economy stands in the second position .From GDP growth point of
view economy is 7th highest as compared to other nations. Economy of USA is basically a mixed
one and has maintained GDP level with stability over the past decades. Now from availability of
natural resources point of view economy stands in the highest position. Productive level of the
economy is also high for which economy is being able to maintain stability in GDP growth and
able to achieve targeted goals over the years (Barnett and Morse, 2013).
Now if these two economies are compared then we can get idea about the
macroeconomic performance of these two economies. The main aim of this report is to find
whether USA’s real GDP growth affects Australian economy or not and this sphere of affect is
considered in terms of recession and expansion. The main reason to conduct this kind study is
USA and Australia trades with each other and if any change takes place in USA then it is obvious
that this change will impact Australian economy. Although, Australia compared to USA is a
smaller economy due to its geographical area.
The study mainly aims to compare and contrast and assess the results obtained. For
comparing Australia and USA, some of the significant factors are considered in this study and
they are economic factors such as real GDP growth rates, yearly exchange rate movements, net
exports growth rate and interest rate. After comparing these factors of both economies they
are evaluated to obtain result whether change in real GDP of USA affects, Australian economy.
Running head: EVALUATION OF MACROECONOMIC PERFORMANCE
Discussion
With urbanization Australian economy and USA economy has adopted many changes in
its economy. From development point of view, both economies have shown expansion in terms
of various indicators and these indicators in turn have shown its impact by driving country
towards path of development. Both economies participate in trade with each country and this
has contributed towards the growth of each economy, and this growth is mainly achieved
because one economy has comparative advantage in producing goods over the other. Both
economies goods and service bundle is a diversified one and both Australia and USA have
positive and negative side. In 1945 U.S first send the proposal of a free trade agreement to
Australia. Later, in 1980 both the countries initiated free trade agreement. Free trade
agreement mainly lays conditions on the subject of types of goods to be traded that are matter
of non discretionary treatment.
The purpose of this report is to provide a framework which shows whether change in
real GDP in USA impacts Australian economy by expanding it or contracting it. To assess the
macroeconomic performance of both countries time period chosen for this study is 1985 to
2015. To obtain the result four aspects of economic growth are considered which are real GDP
growth, net export growth, yearly exchange rate and interest rate.
Real GDP growth of Australia and USA
GDP growth rate is an important factor and is mainly used to show performance level of
any country. It mainly shows the growing pattern of economy and it is measured by comparing
one quarter of country’s GDP to its earlier quarter.GDP mainly includes four factors and these
⊘ This is a preview!⊘
Do you want full access?
Subscribe today to unlock all pages.
Trusted by 1+ million students worldwide
Running head: EVALUATION OF MACROECONOMIC PERFORMANCE
four factors are – the first component is personal consumption and this incorporates retail
sales, the second component is business investment and it incorporates construction and
inventory levels, the third component is the government spending and it incorporates social
security, this is generally regarded as largest component, defense spending and medical
benefits and finally last and the fourth component is net trade of goods and services
(Checherita-Westphal and Rother, 2012).
Real GDP growth rate is considered is as a significant indicator of economic health. This
growth rate response to four phases of business cycle which shows: expansion, peak,
contraction and trough. It mainly shows GDP given at constant prices. Thus GDP growth rate is
considered in this study for its powerful result about economy’s performance.
The Real GDP growth rate of Australia and USA over the period from 1985 to 2015 is
considered. The graph is plotted by considering dataset from World Bank reports. This time
period of thirty years is quite significant to capture the effect.
Paraphrase This Document
Need a fresh take? Get an instant paraphrase of this document with our AI Paraphraser
Running head: EVALUATION OF MACROECONOMIC PERFORMANCE
1985
1988
1991
1994
1997
2000
2003
2006
2009
2012
2015
-4
-2
0
2
4
6
8
Australia(GDP growth %)
USA(GDP growth %)
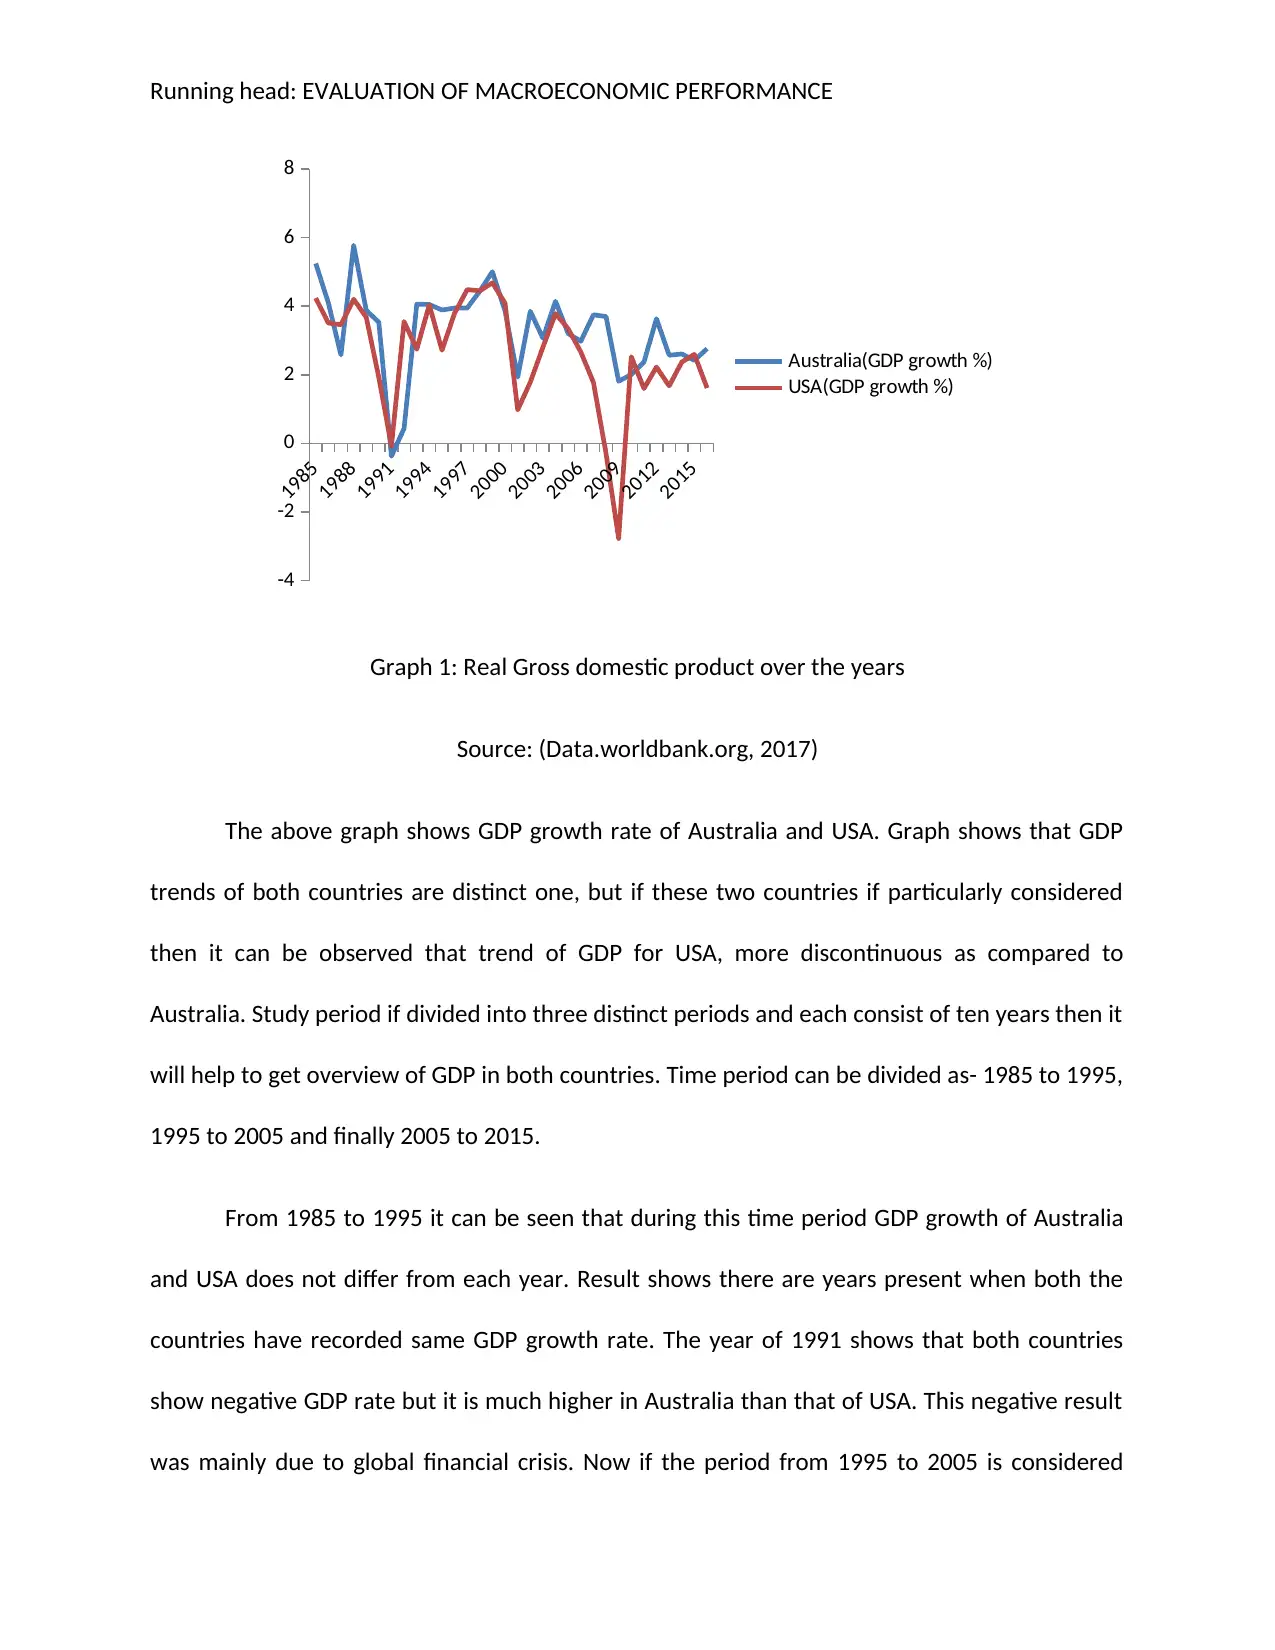
Graph 1: Real Gross domestic product over the years
Source: (Data.worldbank.org, 2017)
The above graph shows GDP growth rate of Australia and USA. Graph shows that GDP
trends of both countries are distinct one, but if these two countries if particularly considered
then it can be observed that trend of GDP for USA, more discontinuous as compared to
Australia. Study period if divided into three distinct periods and each consist of ten years then it
will help to get overview of GDP in both countries. Time period can be divided as- 1985 to 1995,
1995 to 2005 and finally 2005 to 2015.
From 1985 to 1995 it can be seen that during this time period GDP growth of Australia
and USA does not differ from each year. Result shows there are years present when both the
countries have recorded same GDP growth rate. The year of 1991 shows that both countries
show negative GDP rate but it is much higher in Australia than that of USA. This negative result
was mainly due to global financial crisis. Now if the period from 1995 to 2005 is considered
1985
1988
1991
1994
1997
2000
2003
2006
2009
2012
2015
-4
-2
0
2
4
6
8
Australia(GDP growth %)
USA(GDP growth %)
Graph 1: Real Gross domestic product over the years
Source: (Data.worldbank.org, 2017)
The above graph shows GDP growth rate of Australia and USA. Graph shows that GDP
trends of both countries are distinct one, but if these two countries if particularly considered
then it can be observed that trend of GDP for USA, more discontinuous as compared to
Australia. Study period if divided into three distinct periods and each consist of ten years then it
will help to get overview of GDP in both countries. Time period can be divided as- 1985 to 1995,
1995 to 2005 and finally 2005 to 2015.
From 1985 to 1995 it can be seen that during this time period GDP growth of Australia
and USA does not differ from each year. Result shows there are years present when both the
countries have recorded same GDP growth rate. The year of 1991 shows that both countries
show negative GDP rate but it is much higher in Australia than that of USA. This negative result
was mainly due to global financial crisis. Now if the period from 1995 to 2005 is considered
Running head: EVALUATION OF MACROECONOMIC PERFORMANCE
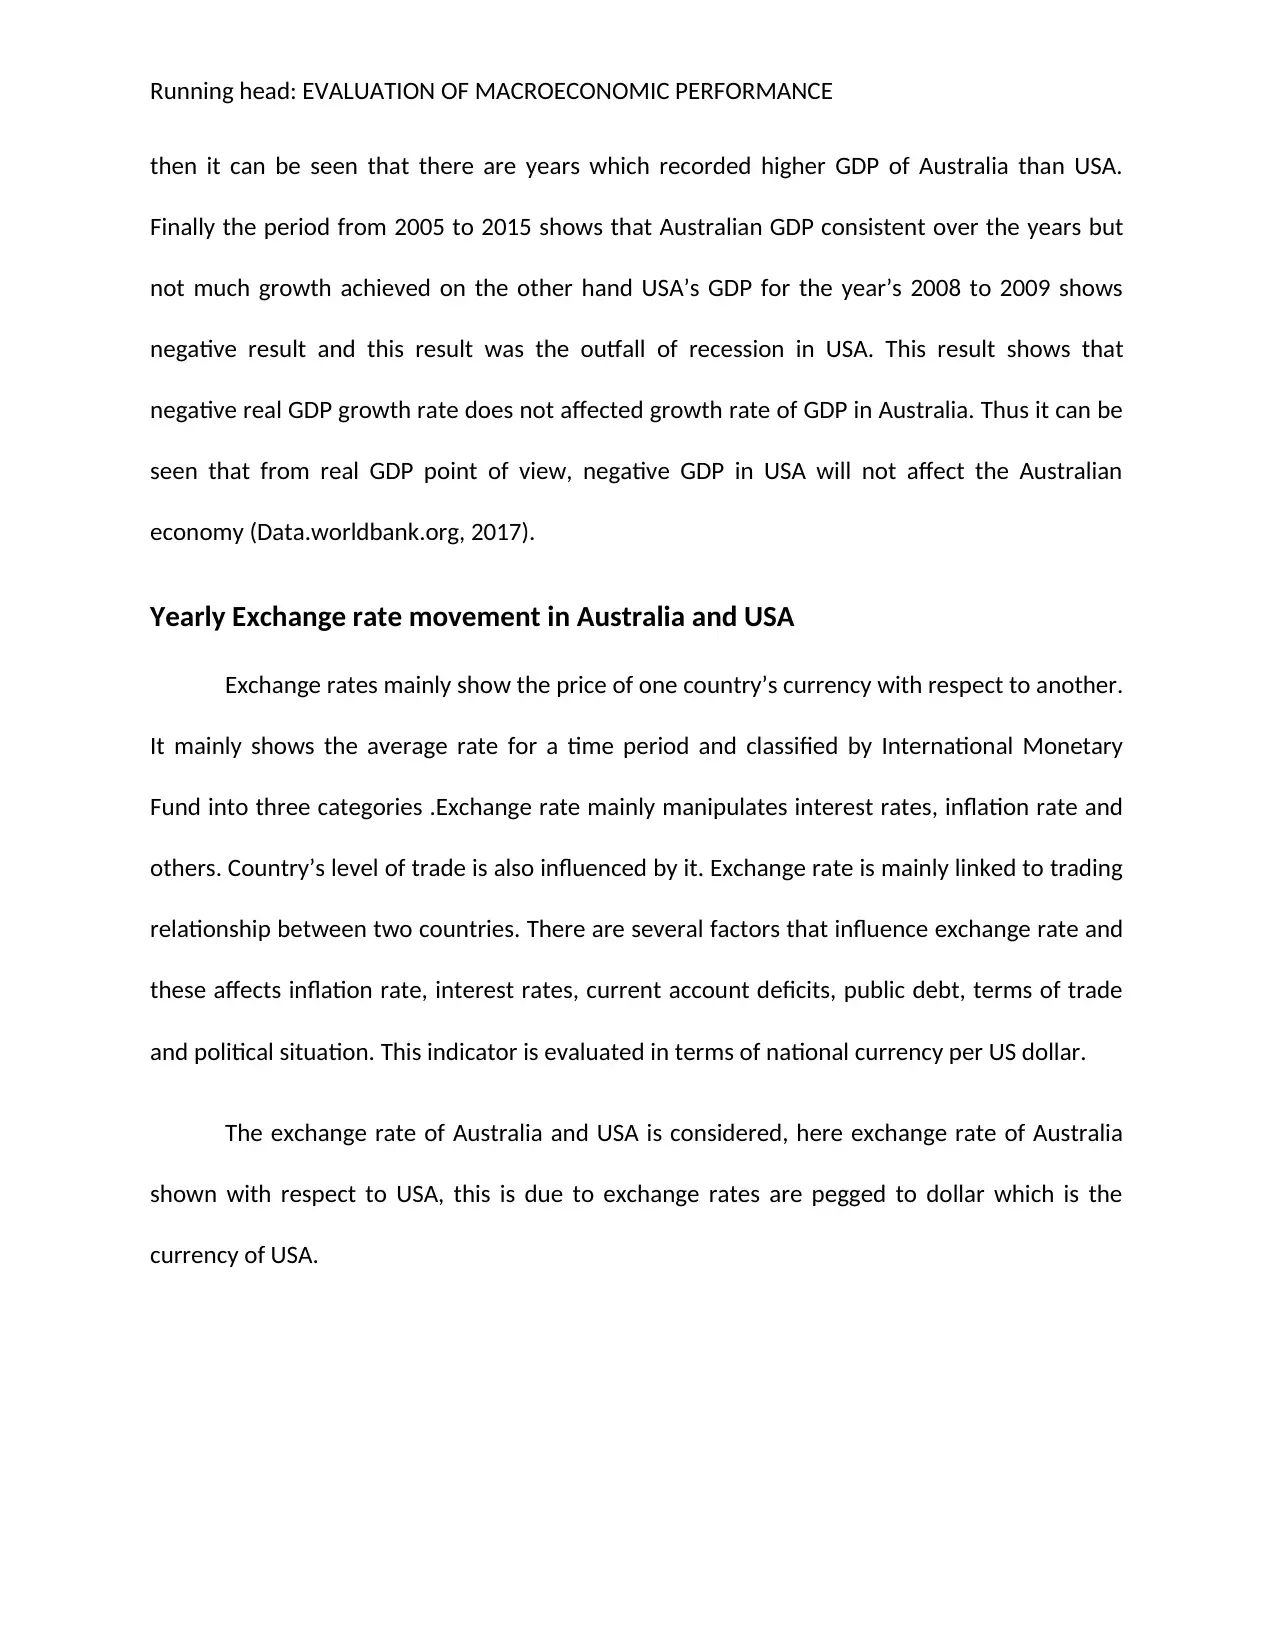
then it can be seen that there are years which recorded higher GDP of Australia than USA.
Finally the period from 2005 to 2015 shows that Australian GDP consistent over the years but
not much growth achieved on the other hand USA’s GDP for the year’s 2008 to 2009 shows
negative result and this result was the outfall of recession in USA. This result shows that
negative real GDP growth rate does not affected growth rate of GDP in Australia. Thus it can be
seen that from real GDP point of view, negative GDP in USA will not affect the Australian
economy (Data.worldbank.org, 2017).
Yearly Exchange rate movement in Australia and USA
Exchange rates mainly show the price of one country’s currency with respect to another.
It mainly shows the average rate for a time period and classified by International Monetary
Fund into three categories .Exchange rate mainly manipulates interest rates, inflation rate and
others. Country’s level of trade is also influenced by it. Exchange rate is mainly linked to trading
relationship between two countries. There are several factors that influence exchange rate and
these affects inflation rate, interest rates, current account deficits, public debt, terms of trade
and political situation. This indicator is evaluated in terms of national currency per US dollar.
The exchange rate of Australia and USA is considered, here exchange rate of Australia
shown with respect to USA, this is due to exchange rates are pegged to dollar which is the
currency of USA.
⊘ This is a preview!⊘
Do you want full access?
Subscribe today to unlock all pages.
Trusted by 1+ million students worldwide
Running head: EVALUATION OF MACROECONOMIC PERFORMANCE
1980 1985 1990 1995 2000 2005 2010 2015 2020
0
0.5
1
1.5
2
2.5
Australia (EXCH)
USA(EXCH)
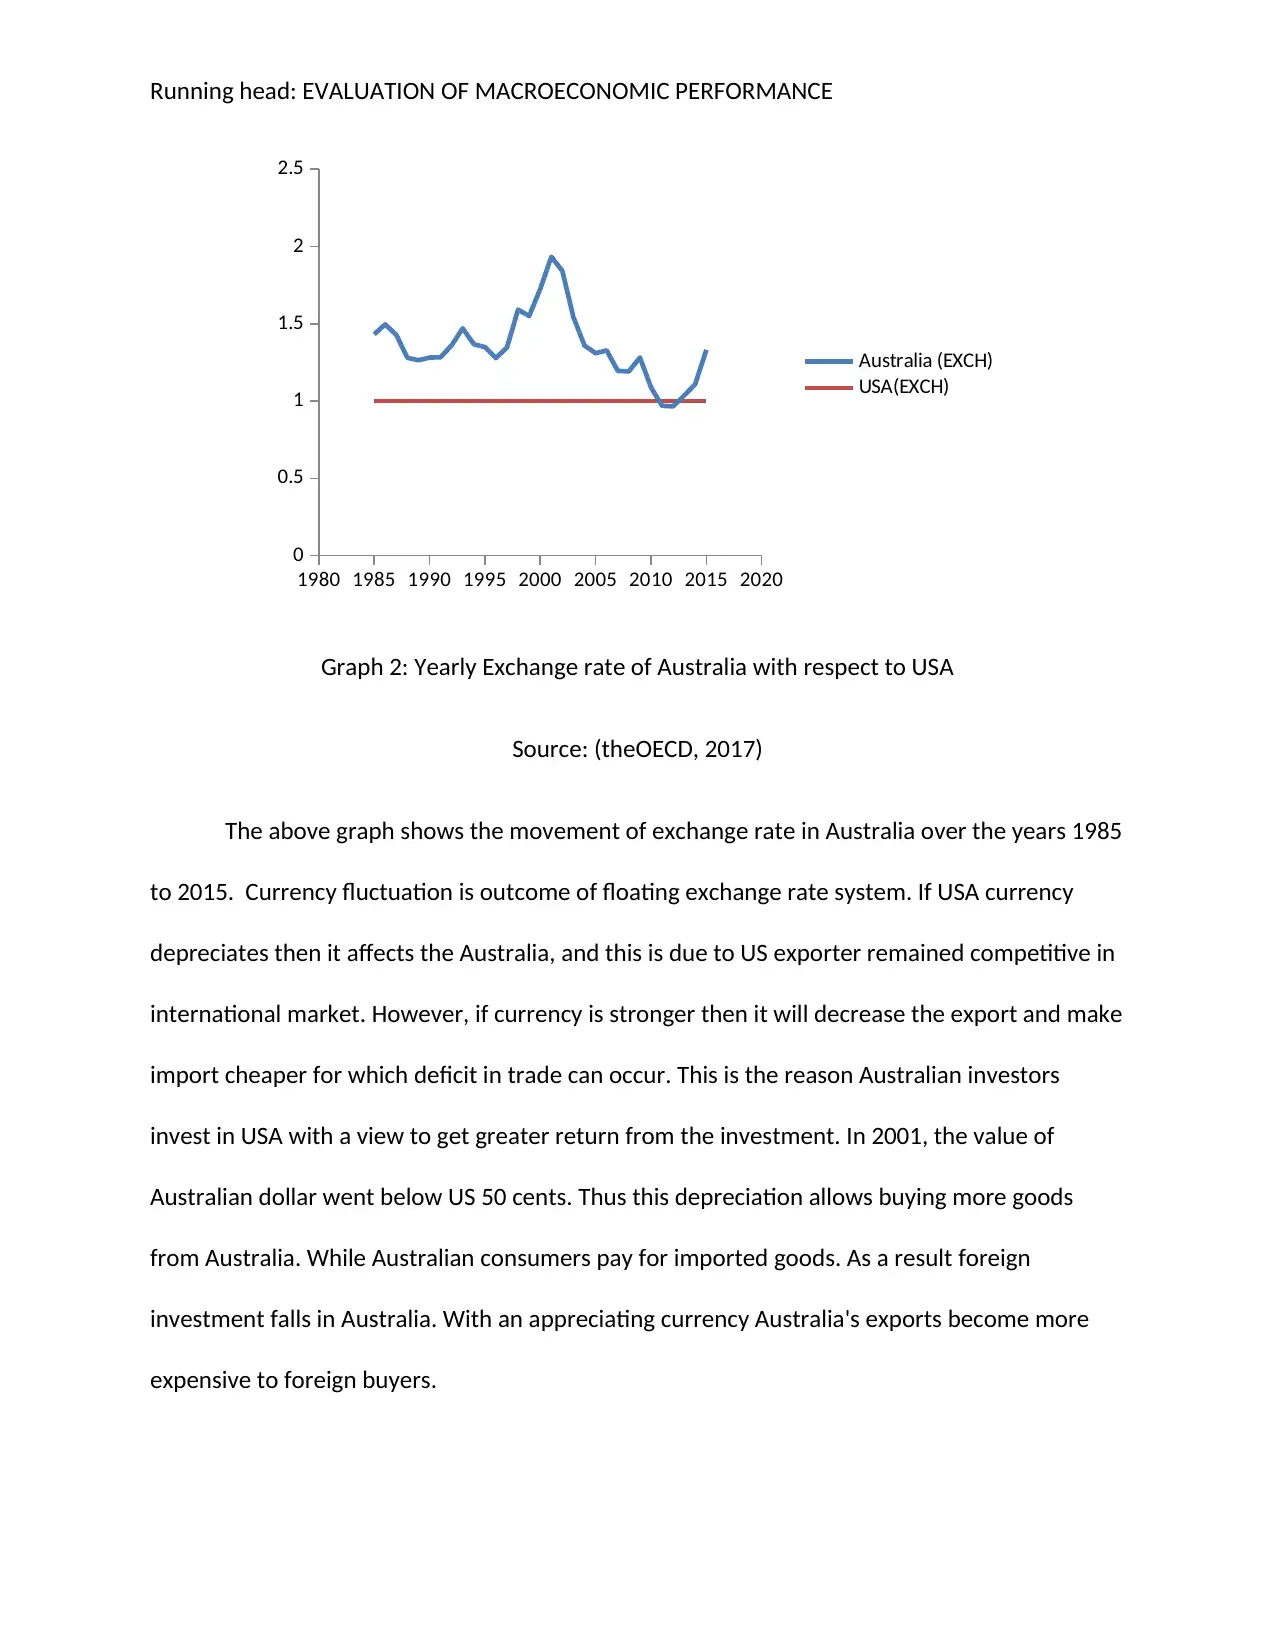
Graph 2: Yearly Exchange rate of Australia with respect to USA
Source: (theOECD, 2017)
The above graph shows the movement of exchange rate in Australia over the years 1985
to 2015. Currency fluctuation is outcome of floating exchange rate system. If USA currency
depreciates then it affects the Australia, and this is due to US exporter remained competitive in
international market. However, if currency is stronger then it will decrease the export and make
import cheaper for which deficit in trade can occur. This is the reason Australian investors
invest in USA with a view to get greater return from the investment. In 2001, the value of
Australian dollar went below US 50 cents. Thus this depreciation allows buying more goods
from Australia. While Australian consumers pay for imported goods. As a result foreign
investment falls in Australia. With an appreciating currency Australia's exports become more
expensive to foreign buyers.
1980 1985 1990 1995 2000 2005 2010 2015 2020
0
0.5
1
1.5
2
2.5
Australia (EXCH)
USA(EXCH)
Graph 2: Yearly Exchange rate of Australia with respect to USA
Source: (theOECD, 2017)
The above graph shows the movement of exchange rate in Australia over the years 1985
to 2015. Currency fluctuation is outcome of floating exchange rate system. If USA currency
depreciates then it affects the Australia, and this is due to US exporter remained competitive in
international market. However, if currency is stronger then it will decrease the export and make
import cheaper for which deficit in trade can occur. This is the reason Australian investors
invest in USA with a view to get greater return from the investment. In 2001, the value of
Australian dollar went below US 50 cents. Thus this depreciation allows buying more goods
from Australia. While Australian consumers pay for imported goods. As a result foreign
investment falls in Australia. With an appreciating currency Australia's exports become more
expensive to foreign buyers.
Paraphrase This Document
Need a fresh take? Get an instant paraphrase of this document with our AI Paraphraser
Running head: EVALUATION OF MACROECONOMIC PERFORMANCE
Net Exports growth rate of Australia and USA
Exports mainly manipulate the level of economic growth and balance of payments.
Exports level over the years increased and this is mainly due to low transport cost, economies
of scale and decrease in tariff. In the field of employment, economic growth and current
account deficit, export helps a lot to solve the problems faced by these fields (Dekker, Bloemhof
and Mallidis, 2012).
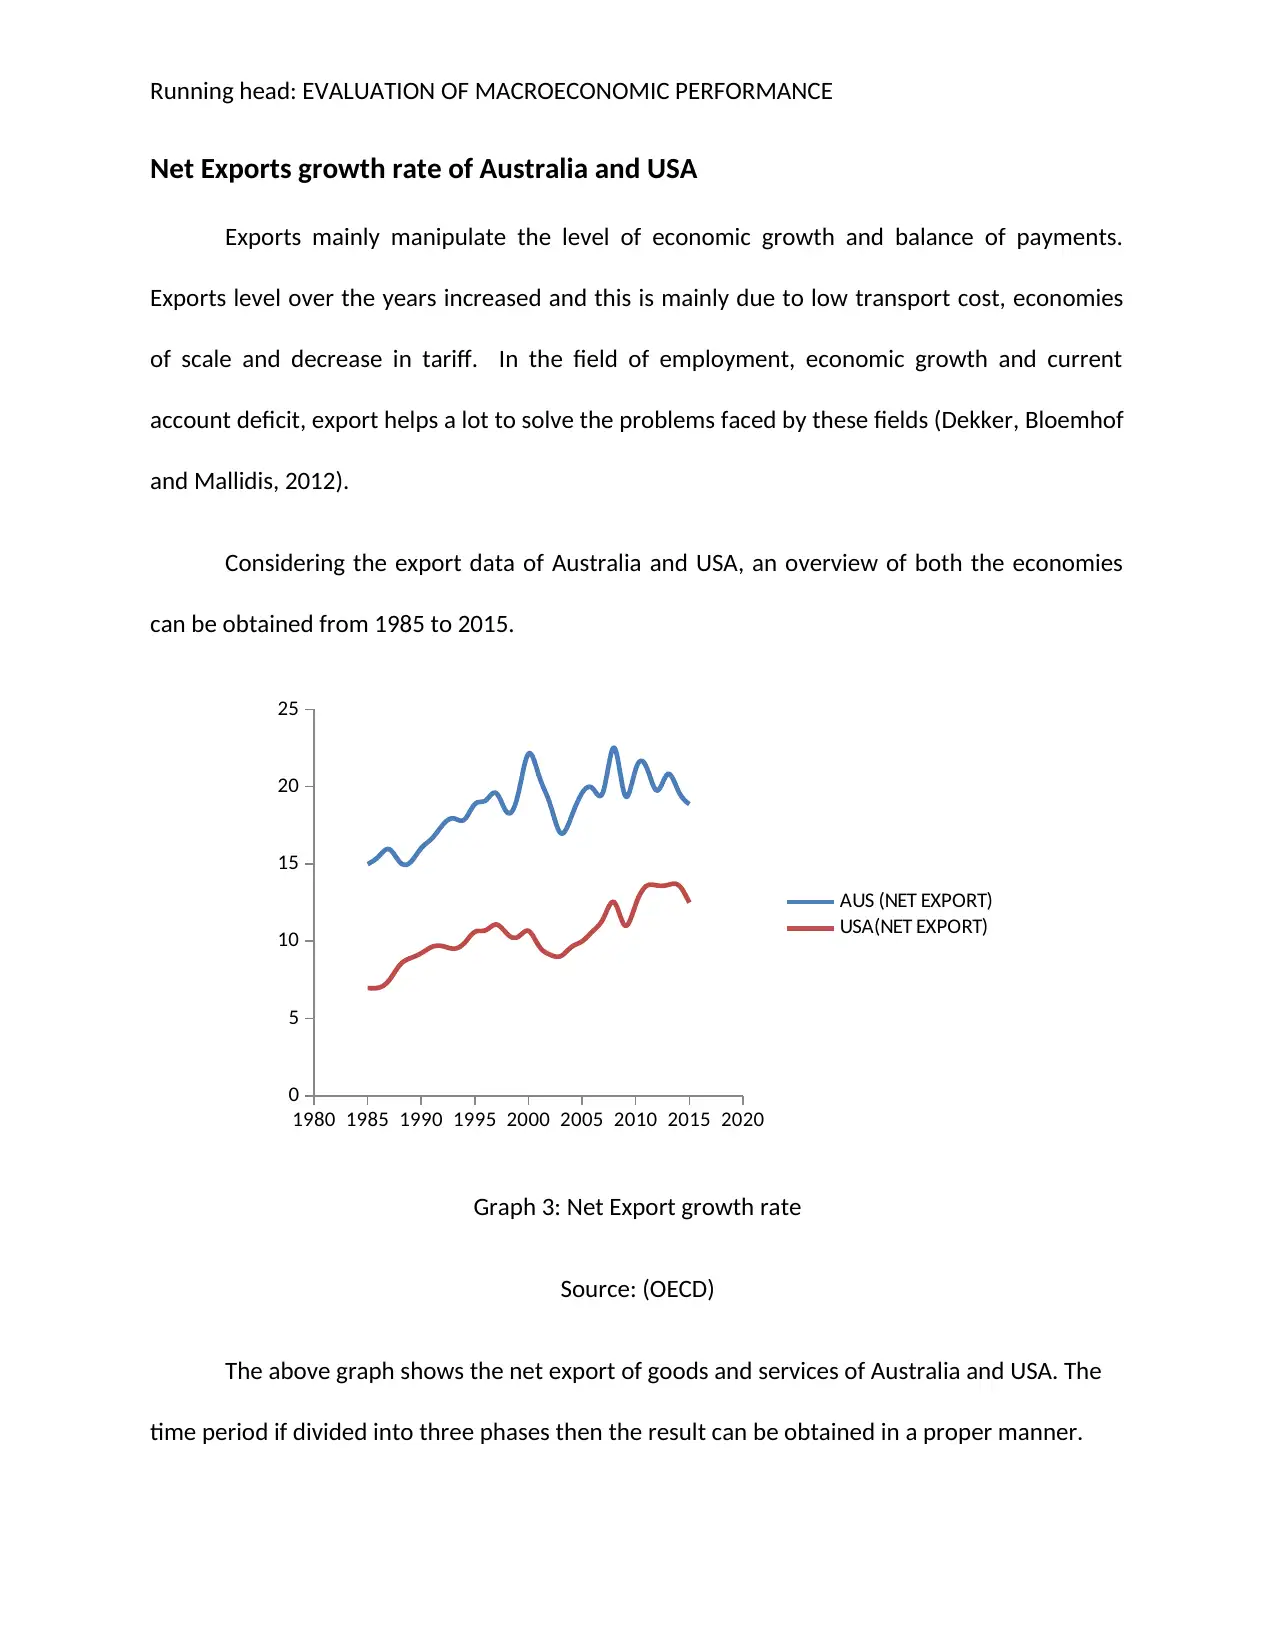
Considering the export data of Australia and USA, an overview of both the economies
can be obtained from 1985 to 2015.
1980 1985 1990 1995 2000 2005 2010 2015 2020
0
5
10
15
20
25
AUS (NET EXPORT)
USA(NET EXPORT)
Graph 3: Net Export growth rate
Source: (OECD)
The above graph shows the net export of goods and services of Australia and USA. The
time period if divided into three phases then the result can be obtained in a proper manner.
Net Exports growth rate of Australia and USA
Exports mainly manipulate the level of economic growth and balance of payments.
Exports level over the years increased and this is mainly due to low transport cost, economies
of scale and decrease in tariff. In the field of employment, economic growth and current
account deficit, export helps a lot to solve the problems faced by these fields (Dekker, Bloemhof
and Mallidis, 2012).
Considering the export data of Australia and USA, an overview of both the economies
can be obtained from 1985 to 2015.
1980 1985 1990 1995 2000 2005 2010 2015 2020
0
5
10
15
20
25
AUS (NET EXPORT)
USA(NET EXPORT)
Graph 3: Net Export growth rate
Source: (OECD)
The above graph shows the net export of goods and services of Australia and USA. The
time period if divided into three phases then the result can be obtained in a proper manner.
Running head: EVALUATION OF MACROECONOMIC PERFORMANCE
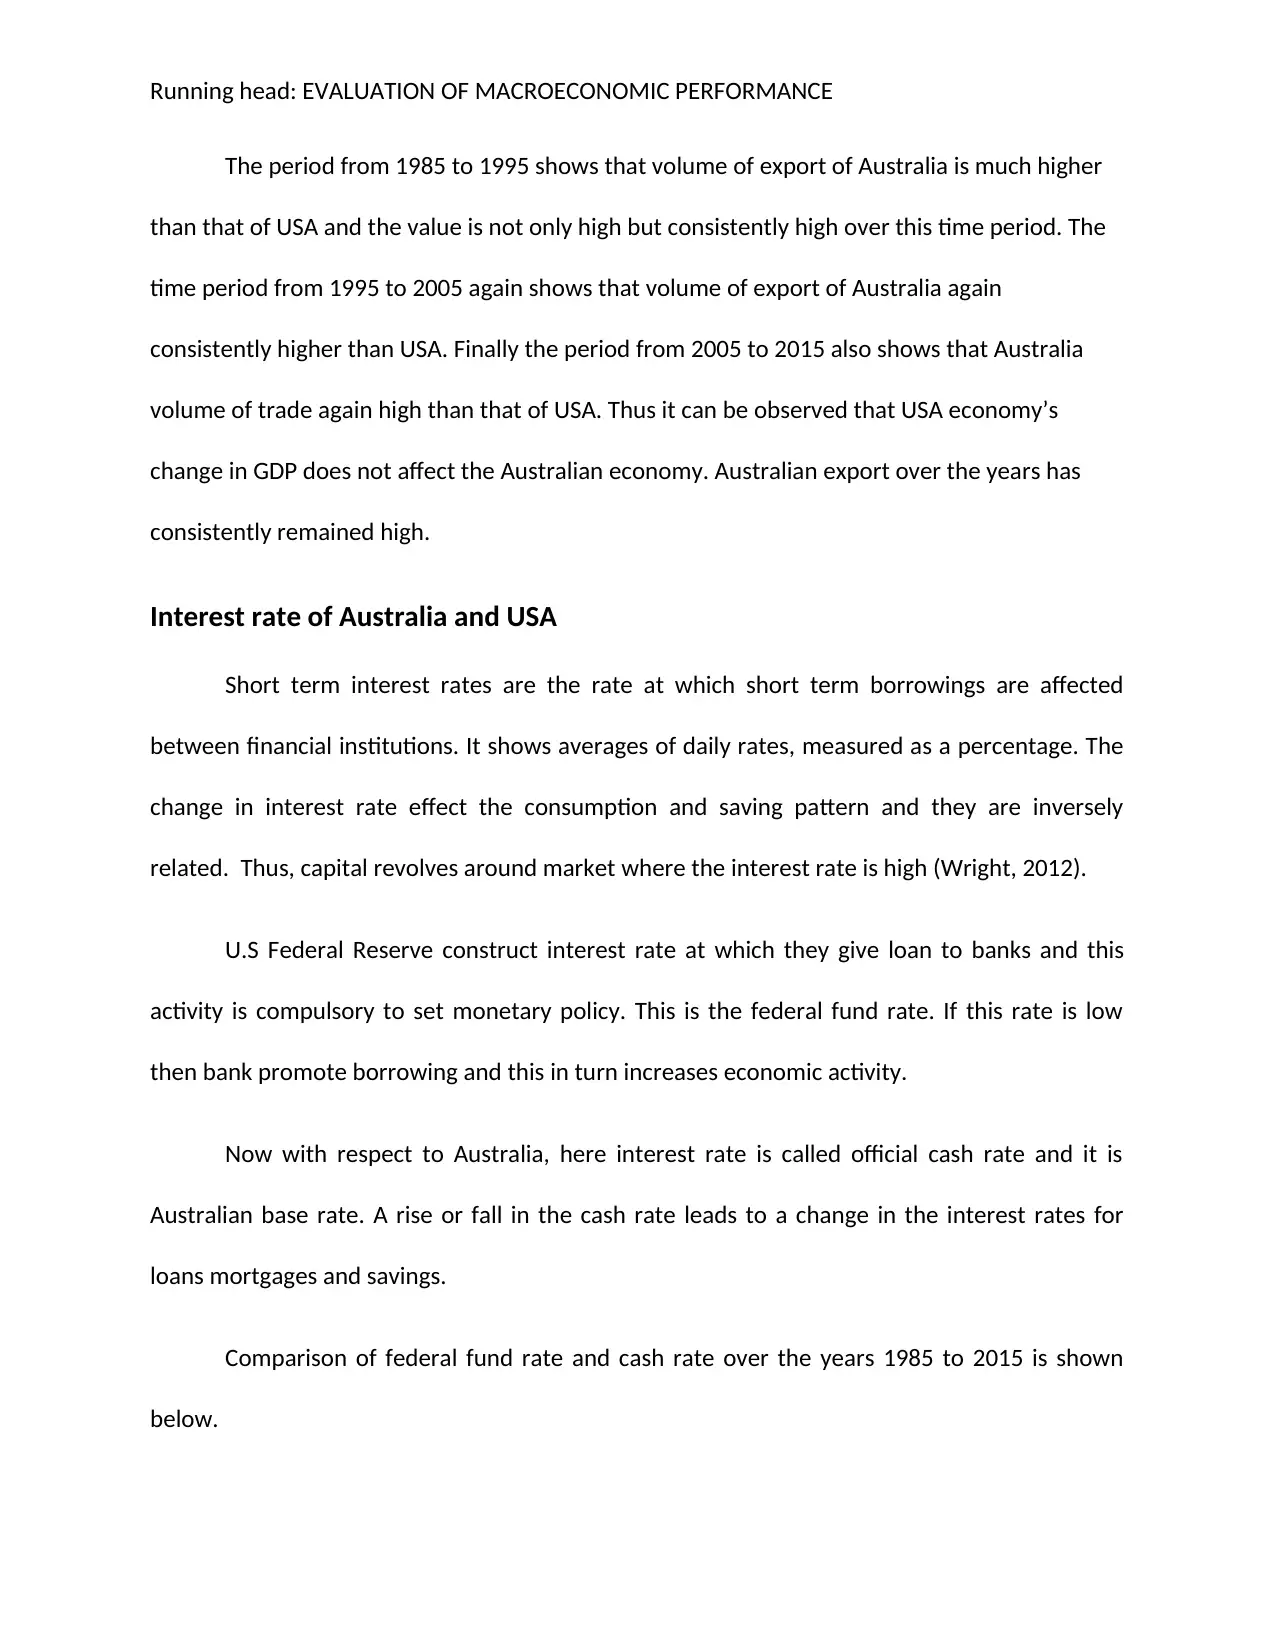
The period from 1985 to 1995 shows that volume of export of Australia is much higher
than that of USA and the value is not only high but consistently high over this time period. The
time period from 1995 to 2005 again shows that volume of export of Australia again
consistently higher than USA. Finally the period from 2005 to 2015 also shows that Australia
volume of trade again high than that of USA. Thus it can be observed that USA economy’s
change in GDP does not affect the Australian economy. Australian export over the years has
consistently remained high.
Interest rate of Australia and USA
Short term interest rates are the rate at which short term borrowings are affected
between financial institutions. It shows averages of daily rates, measured as a percentage. The
change in interest rate effect the consumption and saving pattern and they are inversely
related. Thus, capital revolves around market where the interest rate is high (Wright, 2012).
U.S Federal Reserve construct interest rate at which they give loan to banks and this
activity is compulsory to set monetary policy. This is the federal fund rate. If this rate is low
then bank promote borrowing and this in turn increases economic activity.
Now with respect to Australia, here interest rate is called official cash rate and it is
Australian base rate. A rise or fall in the cash rate leads to a change in the interest rates for
loans mortgages and savings.
Comparison of federal fund rate and cash rate over the years 1985 to 2015 is shown
below.
⊘ This is a preview!⊘
Do you want full access?
Subscribe today to unlock all pages.
Trusted by 1+ million students worldwide
1 out of 16
Related Documents


Your All-in-One AI-Powered Toolkit for Academic Success.
+13062052269
info@desklib.com
Available 24*7 on WhatsApp / Email
![[object Object]](/_next/static/media/star-bottom.7253800d.svg)
Unlock your academic potential
Copyright © 2020–2026 A2Z Services. All Rights Reserved. Developed and managed by ZUCOL.