Economics for Businesses: UK Food Demand, Supply, and Government
VerifiedAdded on 2022/12/26
|12
|2704
|99
Report
AI Summary
This report provides an overview of economic principles relevant to businesses, focusing on demand, supply, and market equilibrium. It begins by defining economics and its importance for businesses, then delves into the concepts of demand and supply, illustrating shifts and movements along the respective curves with examples. Factors affecting demand and supply, such as price, income, substitute goods, consumer preferences, production costs, technology, and government policies, are discussed in detail. The report further examines the equilibrium price, where supply and demand intersect, and provides a table illustrating the relationship between price, quantity demanded, and quantity supplied. The second task analyzes government interventions in the UK food market, particularly in 2020, including quotas, price controls, government transfers, and taxation policies. The report concludes by summarizing the key findings and emphasizing the importance of understanding economic principles for business decision-making. This report is a valuable resource for students studying business economics and related fields.
Economics
For
Businesses
For
Businesses
Paraphrase This Document
Need a fresh take? Get an instant paraphrase of this document with our AI Paraphraser
Table of Contents
INTRODUCTION...........................................................................................................................1
TASK 1............................................................................................................................................1
TASK 2............................................................................................................................................7
CONCLUSION................................................................................................................................8
REFERENCES..............................................................................................................................10
INTRODUCTION
Economics is about study which shows how people interact for values which includes
production, distribution & consumption for goods & services. It is about consumers goods &
services which businesses runs for its activities. It studies about how individuals, businesses,
nations makes choices about how businesses allocates its resources. Economics is about fulfilling
customers needs for satisfy them for better utilisation of resources for generating higher
revenues. Economics for businesses are necessary as it includes the concept for demand &
supply for businesses (Krugman and Wells, 2017). It includes micro & macro economic factors
which affects demand & supply for customers. This report is about economic which uses for
businesses. It includes topics which are curve for demand & supply, factors for demand &
supply, equilibrium for price & demand etc. Apart from this it includes topics which are
government interventions for food demand & supply.
TASK 1
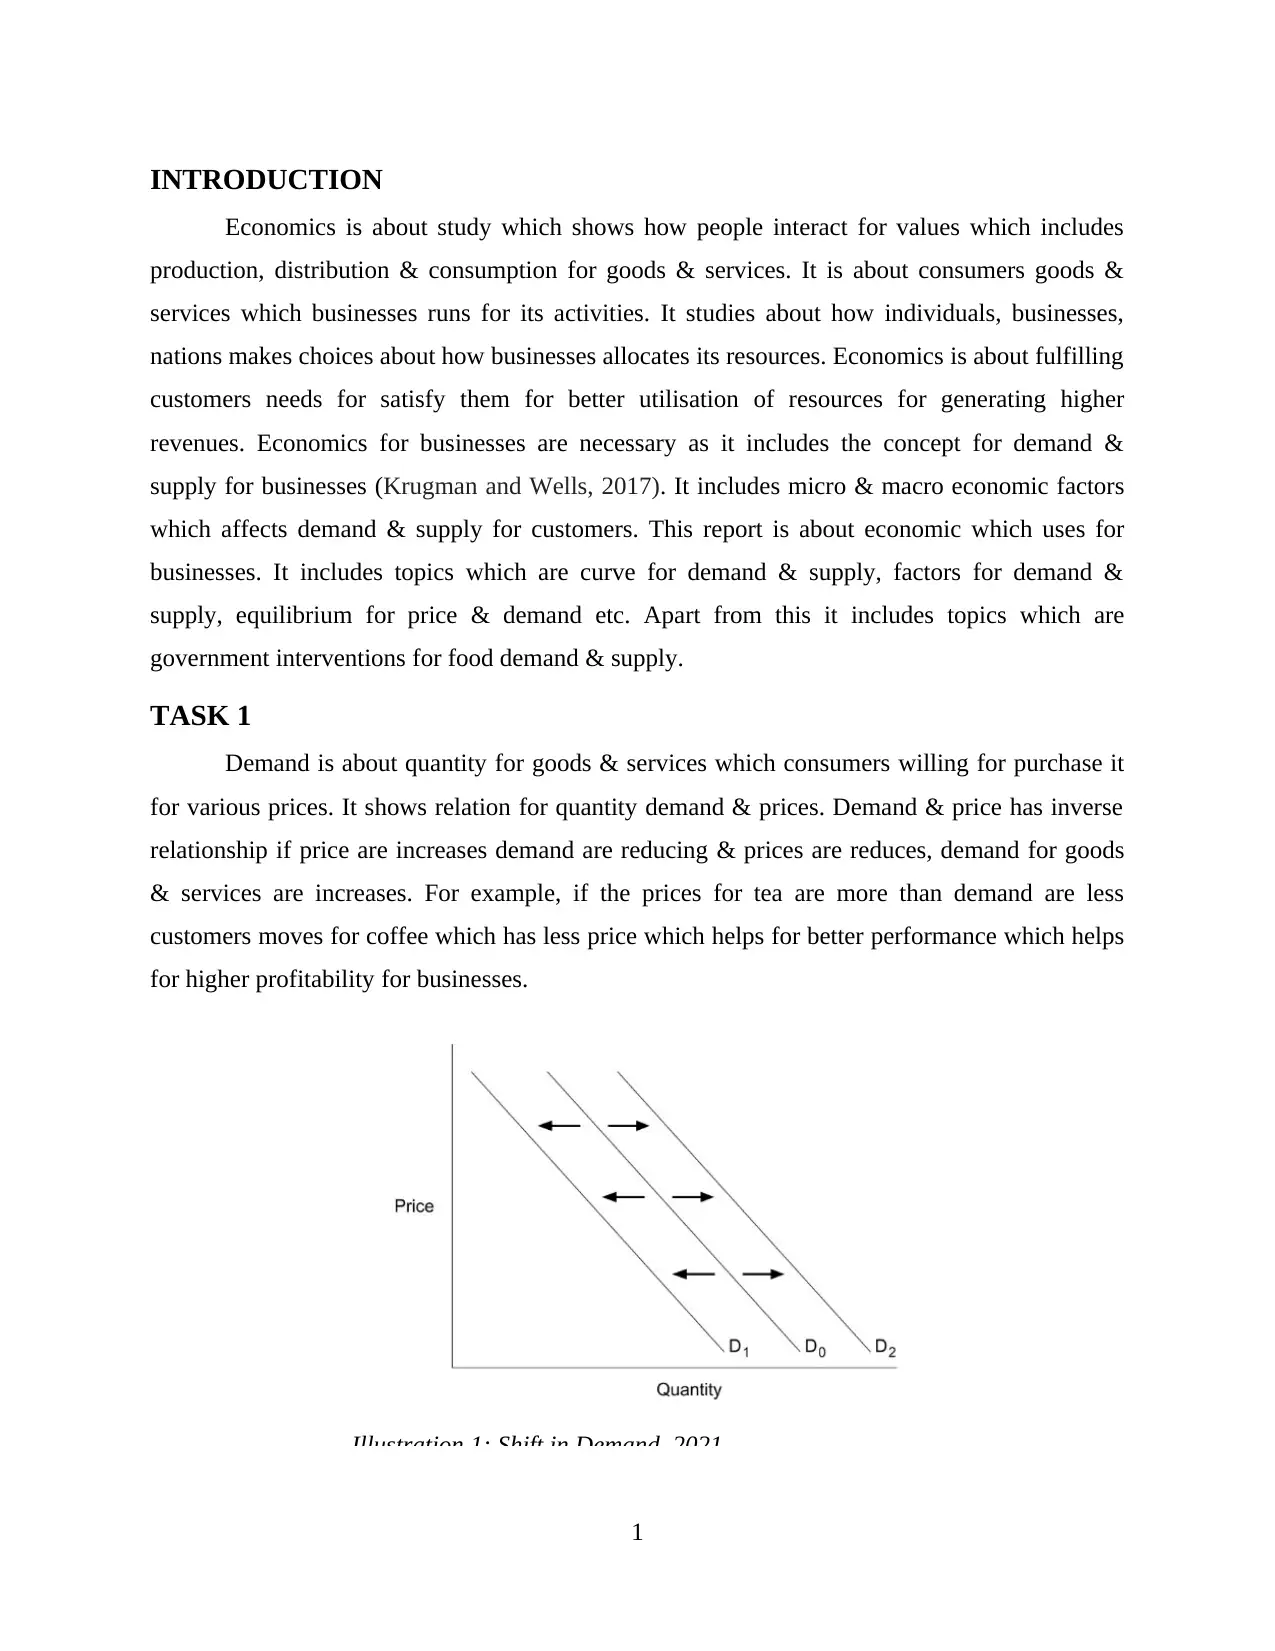
Demand is about quantity for goods & services which consumers willing for purchase it
for various prices. It shows relation for quantity demand & prices. Demand & price has inverse
relationship if price are increases demand are reducing & prices are reduces, demand for goods
& services are increases. For example, if the prices for tea are more than demand are less
customers moves for coffee which has less price which helps for better performance which helps
for higher profitability for businesses.
1
Illustration 1: Shift in Demand. 2021
Economics is about study which shows how people interact for values which includes
production, distribution & consumption for goods & services. It is about consumers goods &
services which businesses runs for its activities. It studies about how individuals, businesses,
nations makes choices about how businesses allocates its resources. Economics is about fulfilling
customers needs for satisfy them for better utilisation of resources for generating higher
revenues. Economics for businesses are necessary as it includes the concept for demand &
supply for businesses (Krugman and Wells, 2017). It includes micro & macro economic factors
which affects demand & supply for customers. This report is about economic which uses for
businesses. It includes topics which are curve for demand & supply, factors for demand &
supply, equilibrium for price & demand etc. Apart from this it includes topics which are
government interventions for food demand & supply.
TASK 1
Demand is about quantity for goods & services which consumers willing for purchase it
for various prices. It shows relation for quantity demand & prices. Demand & price has inverse
relationship if price are increases demand are reducing & prices are reduces, demand for goods
& services are increases. For example, if the prices for tea are more than demand are less
customers moves for coffee which has less price which helps for better performance which helps
for higher profitability for businesses.
1
Illustration 1: Shift in Demand. 2021
⊘ This is a preview!⊘
Do you want full access?
Subscribe today to unlock all pages.
Trusted by 1+ million students worldwide
(Source: Shift in Demand. 2021)
The change for demand about to a shift in the entire demand curve, which shows caused
by the variety for factors which affects demand & makes changes for it (Shift in Demand,
2021). The shit in demand curve refers by various factors which affects goods & services
demand (preferences, income, prices of substitutes and complements, expectations, population,
etc.)
Change in Demand: The change in demand about that the entire demand curve shifts for
left or right. The initial demand curve D0 shifts to change state either D1 or D2. This could be
reason by shift in tastes, changes in population, changes in income, prices of substitute or
complement goods, or changes future expectations. In context to UK food demand , as per prices
fluctuations for income factor the shift for demand are generate.
Factors affecting demand:
Price of the product: It shows the inverse relation for price for the goods & amount for
products which customers willing for purchases. Customers wants those goods which has less
price. In context to UK food services, price factor affects the demand for its goods as if price of
the food services will high the demand shifts towards left & price for food will less, demand for
food services will more generate which helps for better performance which helps for higher
profitability for the businesses.
Consumers income: In context to UK food goods & services, consumers income affects
the demand for goods & services. Consumers income will increases they will rise their
consumption for purchasing goods, income are reduces they will decrease their consumption for
purchasing goods & services. Income is increases for this customers will purchase high quality
goods for their demand.
The price for substitute goods: The price for substitute goods affects demand for food
goods & services. For example, price for tea is increasing & coffee has less price for it customers
has option for moving for coffee which reduces demand for tea.
It is about two goods which are typically consumed together. For example, bagels and
cream cheese. These are these types of goods compliments. If the price for the bagel goes up,
the Law of Demand shows that customers will be willing/able to buy fewer bagels. But if
customers want fewer bagels, customers will also want to use less cream cheese (since we
typically use them together). Therefore, an increase in the price of bagels means they wants for
2
Paraphrase This Document
Need a fresh take? Get an instant paraphrase of this document with our AI Paraphraser
purchase less cream cheese. They summarize its by saying that when two goods are
complements, there is an inverse relationship between the price of one good and the demand for
the other goods & services.
Taste & preferences for customers: The taste & preferences for customers for
customers affects the demand for goods. In context to Food goods & services customers taste
affects demand for its goods & services. For example, various customers are not using junk food
it will change demand for those customers. Ice cream demand are more for summers it will
reduces demand for winters. Taste & preference are factor which affects demand for customers
goods & services.
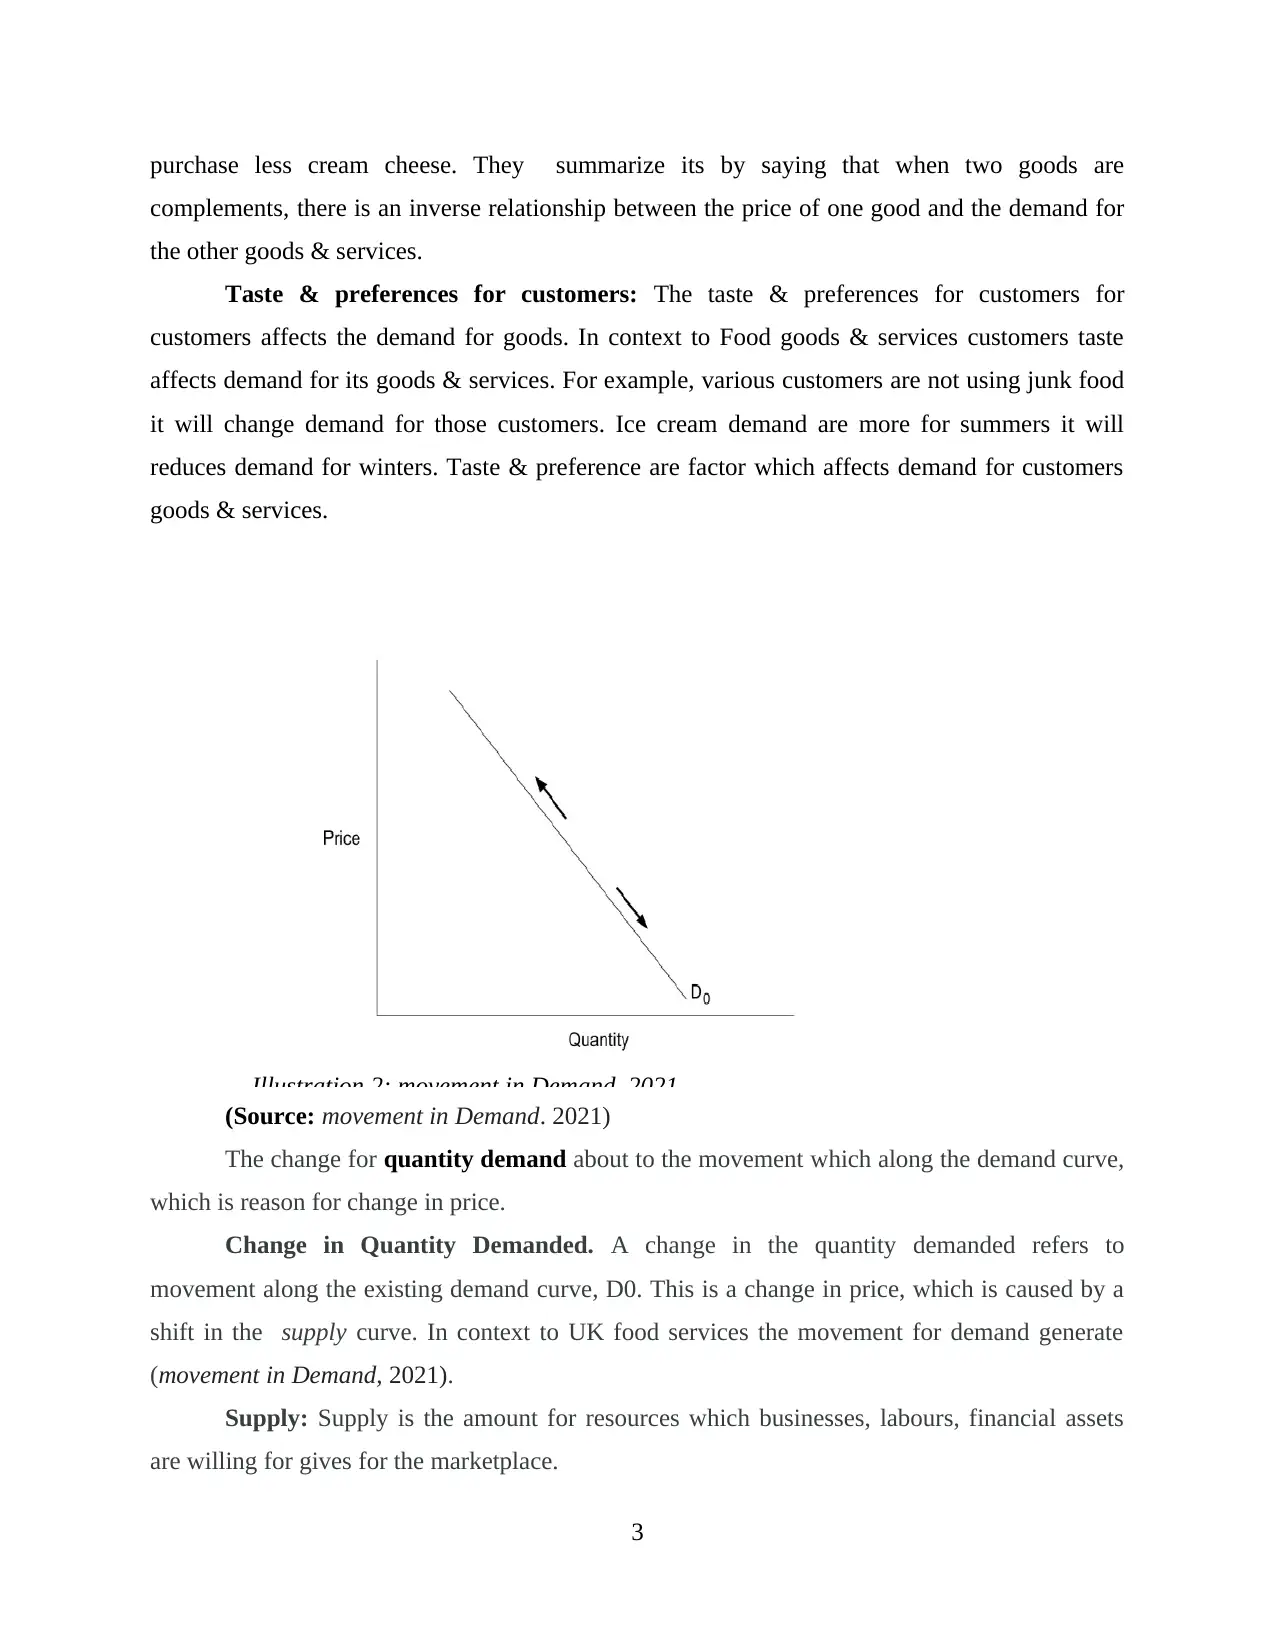
(Source: movement in Demand. 2021)
The change for quantity demand about to the movement which along the demand curve,
which is reason for change in price.
Change in Quantity Demanded. A change in the quantity demanded refers to
movement along the existing demand curve, D0. This is a change in price, which is caused by a
shift in the supply curve. In context to UK food services the movement for demand generate
(movement in Demand, 2021).
Supply: Supply is the amount for resources which businesses, labours, financial assets
are willing for gives for the marketplace.
3
Illustration 2: movement in Demand. 2021
complements, there is an inverse relationship between the price of one good and the demand for
the other goods & services.
Taste & preferences for customers: The taste & preferences for customers for
customers affects the demand for goods. In context to Food goods & services customers taste
affects demand for its goods & services. For example, various customers are not using junk food
it will change demand for those customers. Ice cream demand are more for summers it will
reduces demand for winters. Taste & preference are factor which affects demand for customers
goods & services.
(Source: movement in Demand. 2021)
The change for quantity demand about to the movement which along the demand curve,
which is reason for change in price.
Change in Quantity Demanded. A change in the quantity demanded refers to
movement along the existing demand curve, D0. This is a change in price, which is caused by a
shift in the supply curve. In context to UK food services the movement for demand generate
(movement in Demand, 2021).
Supply: Supply is the amount for resources which businesses, labours, financial assets
are willing for gives for the marketplace.
3
Illustration 2: movement in Demand. 2021
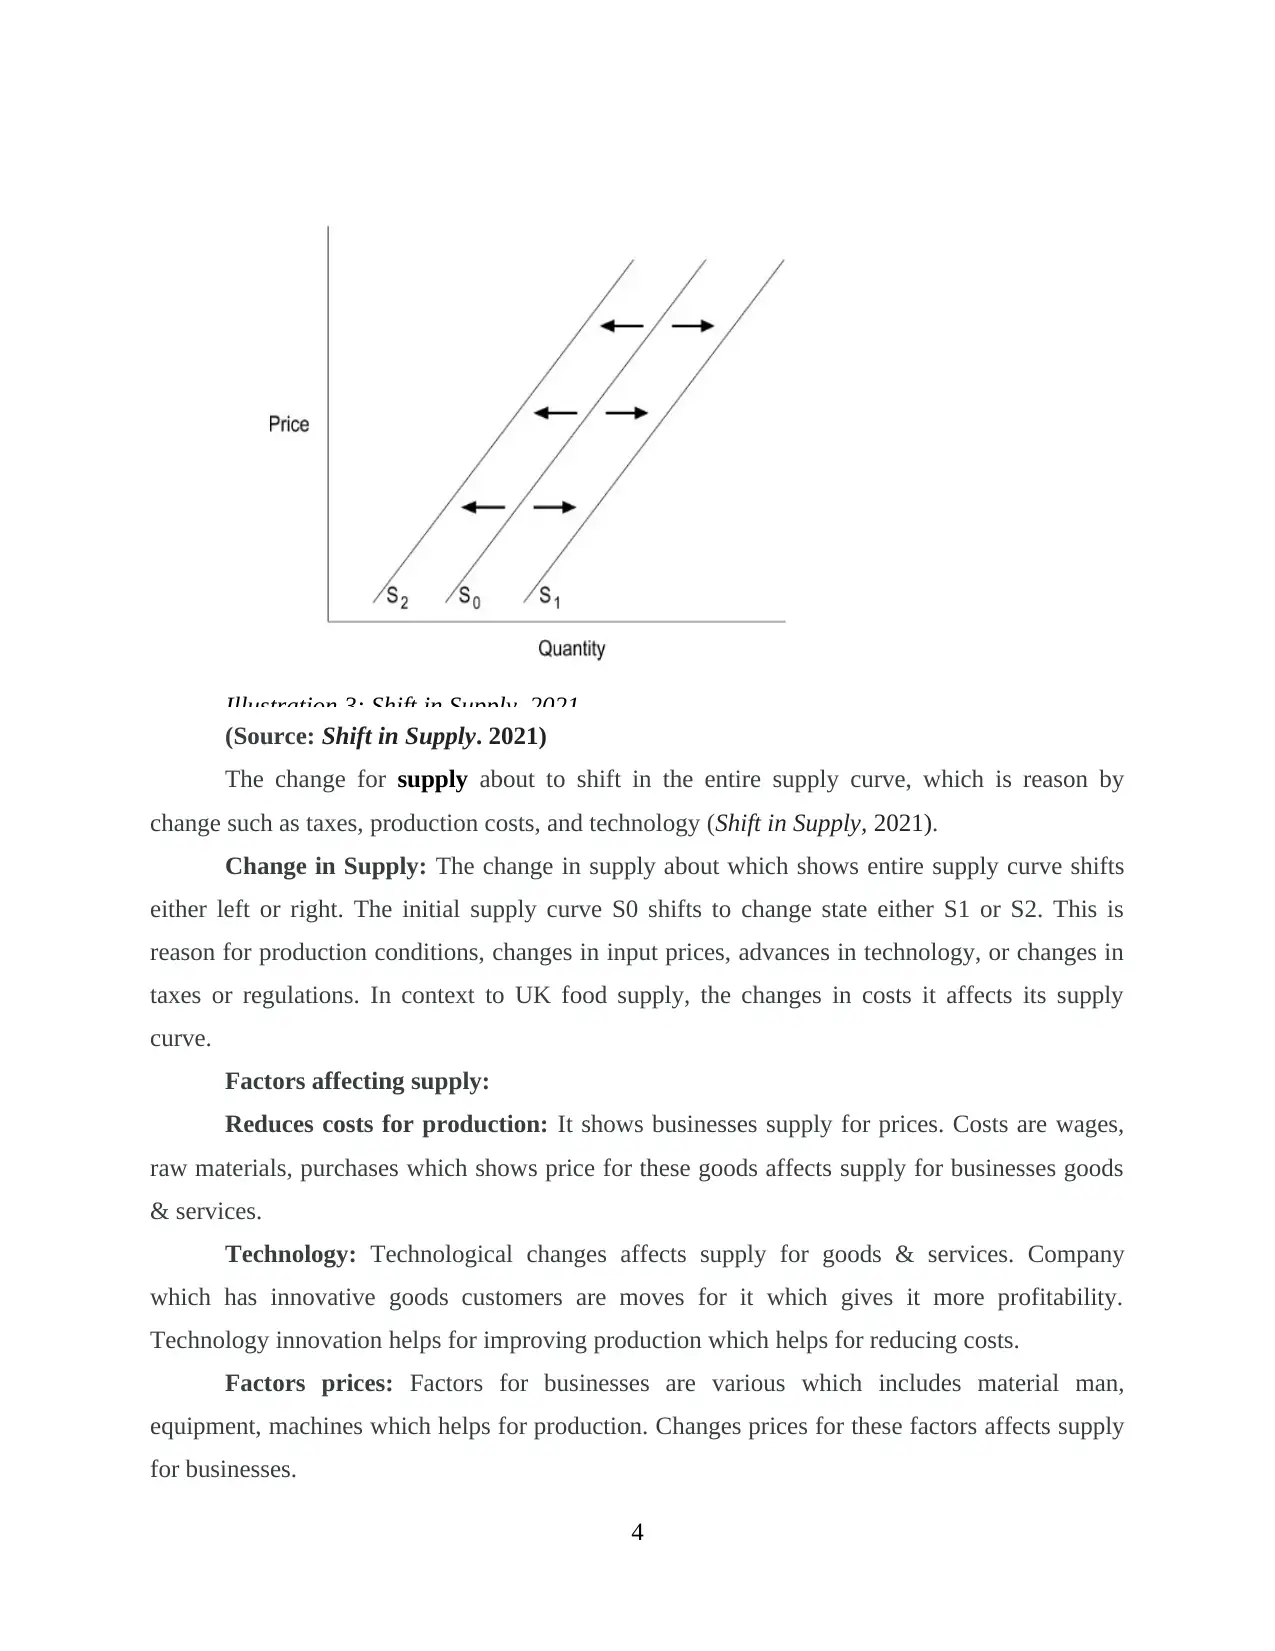
Illustration 3: Shift in Supply. 2021
(Source: Shift in Supply. 2021)
The change for supply about to shift in the entire supply curve, which is reason by
change such as taxes, production costs, and technology (Shift in Supply, 2021).
Change in Supply: The change in supply about which shows entire supply curve shifts
either left or right. The initial supply curve S0 shifts to change state either S1 or S2. This is
reason for production conditions, changes in input prices, advances in technology, or changes in
taxes or regulations. In context to UK food supply, the changes in costs it affects its supply
curve.
Factors affecting supply:
Reduces costs for production: It shows businesses supply for prices. Costs are wages,
raw materials, purchases which shows price for these goods affects supply for businesses goods
& services.
Technology: Technological changes affects supply for goods & services. Company
which has innovative goods customers are moves for it which gives it more profitability.
Technology innovation helps for improving production which helps for reducing costs.
Factors prices: Factors for businesses are various which includes material man,
equipment, machines which helps for production. Changes prices for these factors affects supply
for businesses.
4
⊘ This is a preview!⊘
Do you want full access?
Subscribe today to unlock all pages.
Trusted by 1+ million students worldwide
Government polices: Government policies affects supply for goods & services. For
example, changes for tax which affects costs for goods which supply for production for goods &
services.
Price for substitute goods: In context to food goods 7 services there are various things
which are substitute. For example, price for tea is increasing this will increase the supply for
coffee as customers prefers less costs goods which gives them higher profitability for businesses.
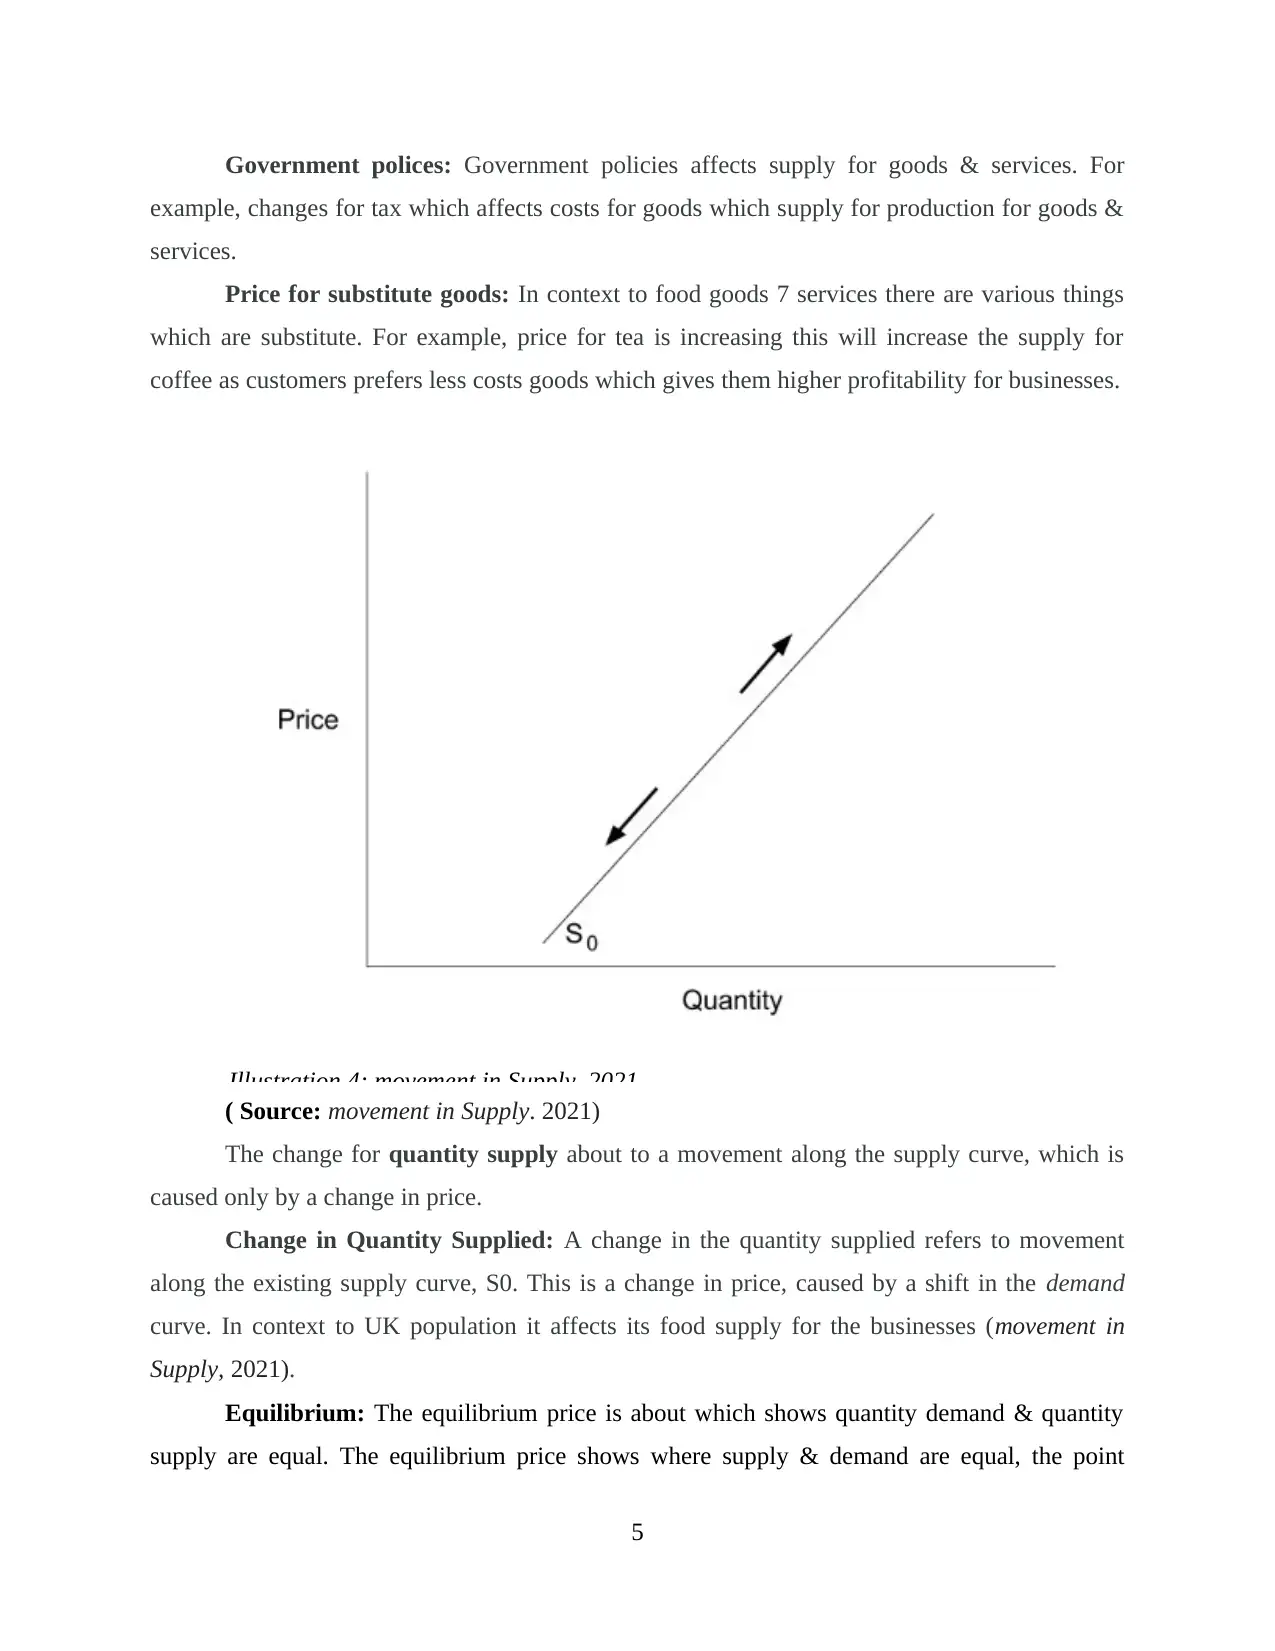
( Source: movement in Supply. 2021)
The change for quantity supply about to a movement along the supply curve, which is
caused only by a change in price.
Change in Quantity Supplied: A change in the quantity supplied refers to movement
along the existing supply curve, S0. This is a change in price, caused by a shift in the demand
curve. In context to UK population it affects its food supply for the businesses (movement in
Supply, 2021).
Equilibrium: The equilibrium price is about which shows quantity demand & quantity
supply are equal. The equilibrium price shows where supply & demand are equal, the point
5
Illustration 4: movement in Supply. 2021
example, changes for tax which affects costs for goods which supply for production for goods &
services.
Price for substitute goods: In context to food goods 7 services there are various things
which are substitute. For example, price for tea is increasing this will increase the supply for
coffee as customers prefers less costs goods which gives them higher profitability for businesses.
( Source: movement in Supply. 2021)
The change for quantity supply about to a movement along the supply curve, which is
caused only by a change in price.
Change in Quantity Supplied: A change in the quantity supplied refers to movement
along the existing supply curve, S0. This is a change in price, caused by a shift in the demand
curve. In context to UK population it affects its food supply for the businesses (movement in
Supply, 2021).
Equilibrium: The equilibrium price is about which shows quantity demand & quantity
supply are equal. The equilibrium price shows where supply & demand are equal, the point
5
Illustration 4: movement in Supply. 2021
Paraphrase This Document
Need a fresh take? Get an instant paraphrase of this document with our AI Paraphraser
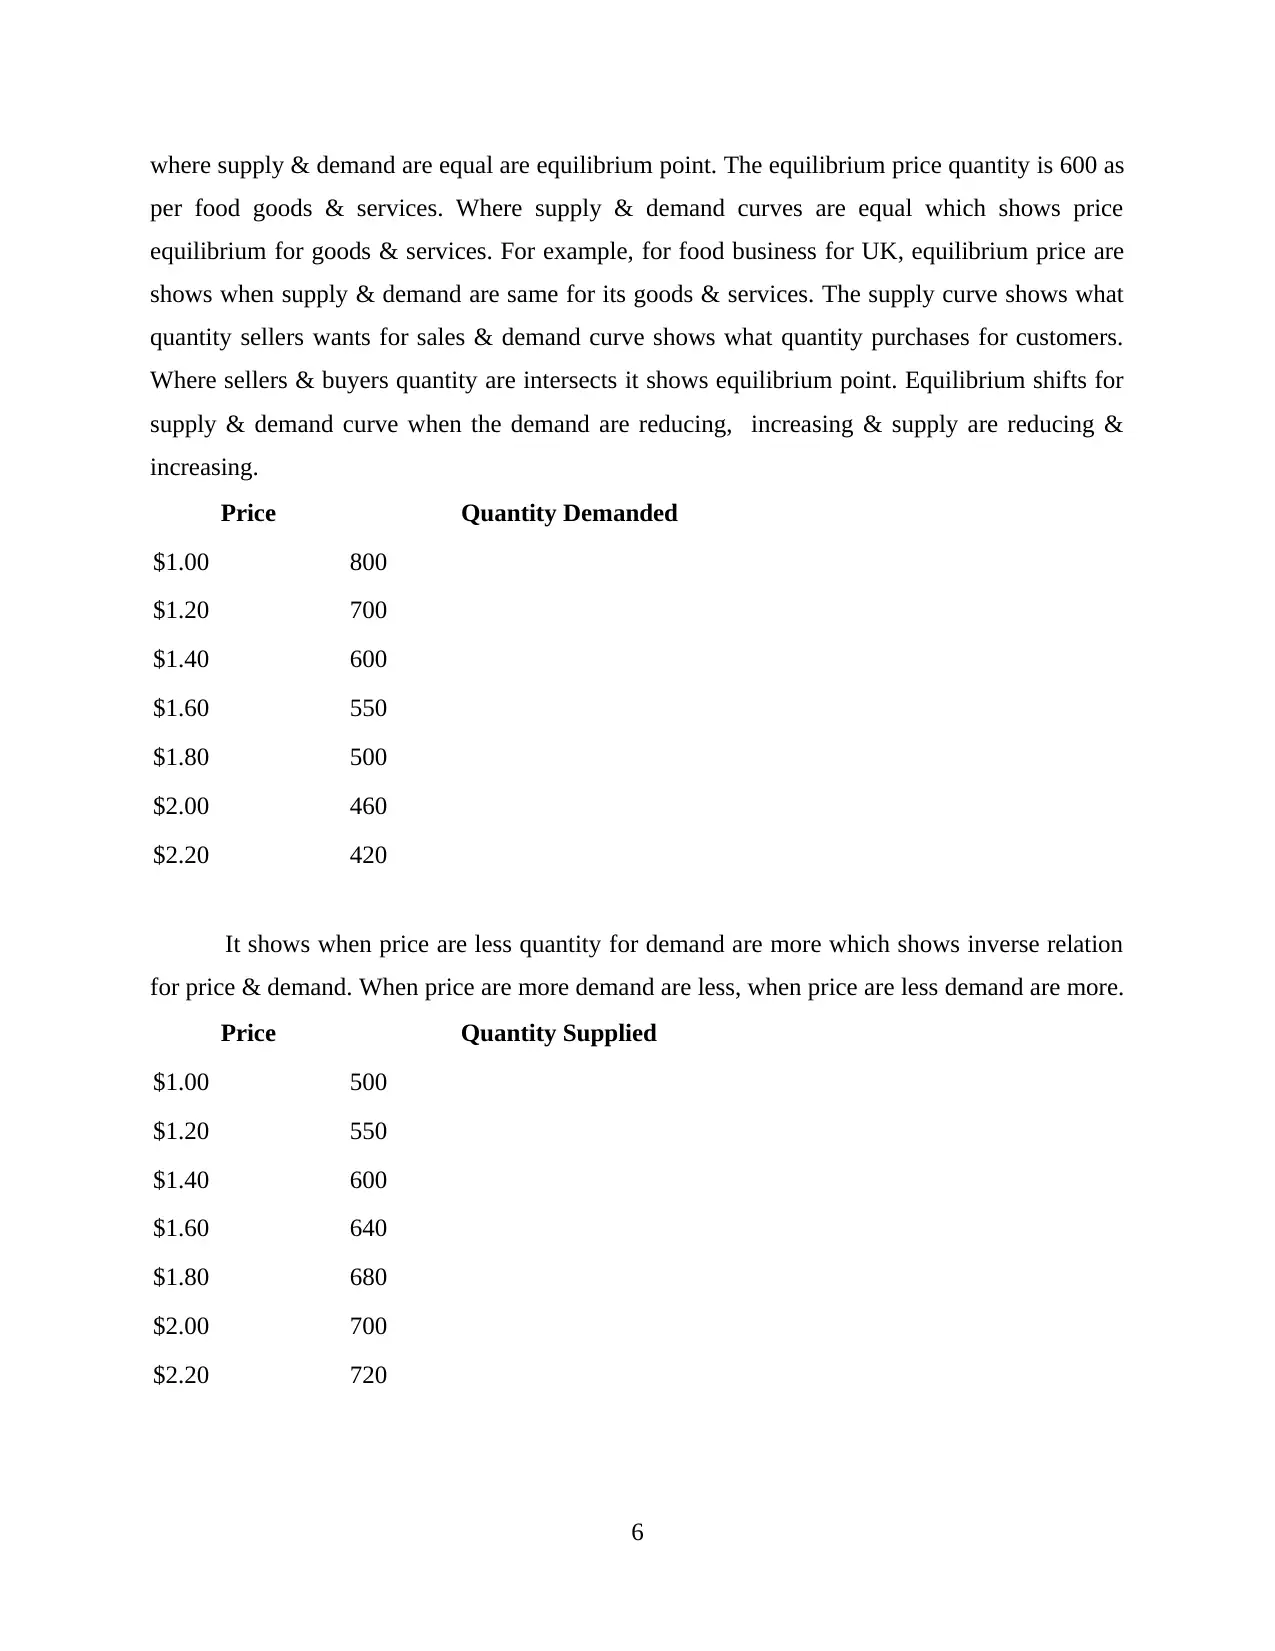
where supply & demand are equal are equilibrium point. The equilibrium price quantity is 600 as
per food goods & services. Where supply & demand curves are equal which shows price
equilibrium for goods & services. For example, for food business for UK, equilibrium price are
shows when supply & demand are same for its goods & services. The supply curve shows what
quantity sellers wants for sales & demand curve shows what quantity purchases for customers.
Where sellers & buyers quantity are intersects it shows equilibrium point. Equilibrium shifts for
supply & demand curve when the demand are reducing, increasing & supply are reducing &
increasing.
Price Quantity Demanded
$1.00 800
$1.20 700
$1.40 600
$1.60 550
$1.80 500
$2.00 460
$2.20 420
It shows when price are less quantity for demand are more which shows inverse relation
for price & demand. When price are more demand are less, when price are less demand are more.
Price Quantity Supplied
$1.00 500
$1.20 550
$1.40 600
$1.60 640
$1.80 680
$2.00 700
$2.20 720
6
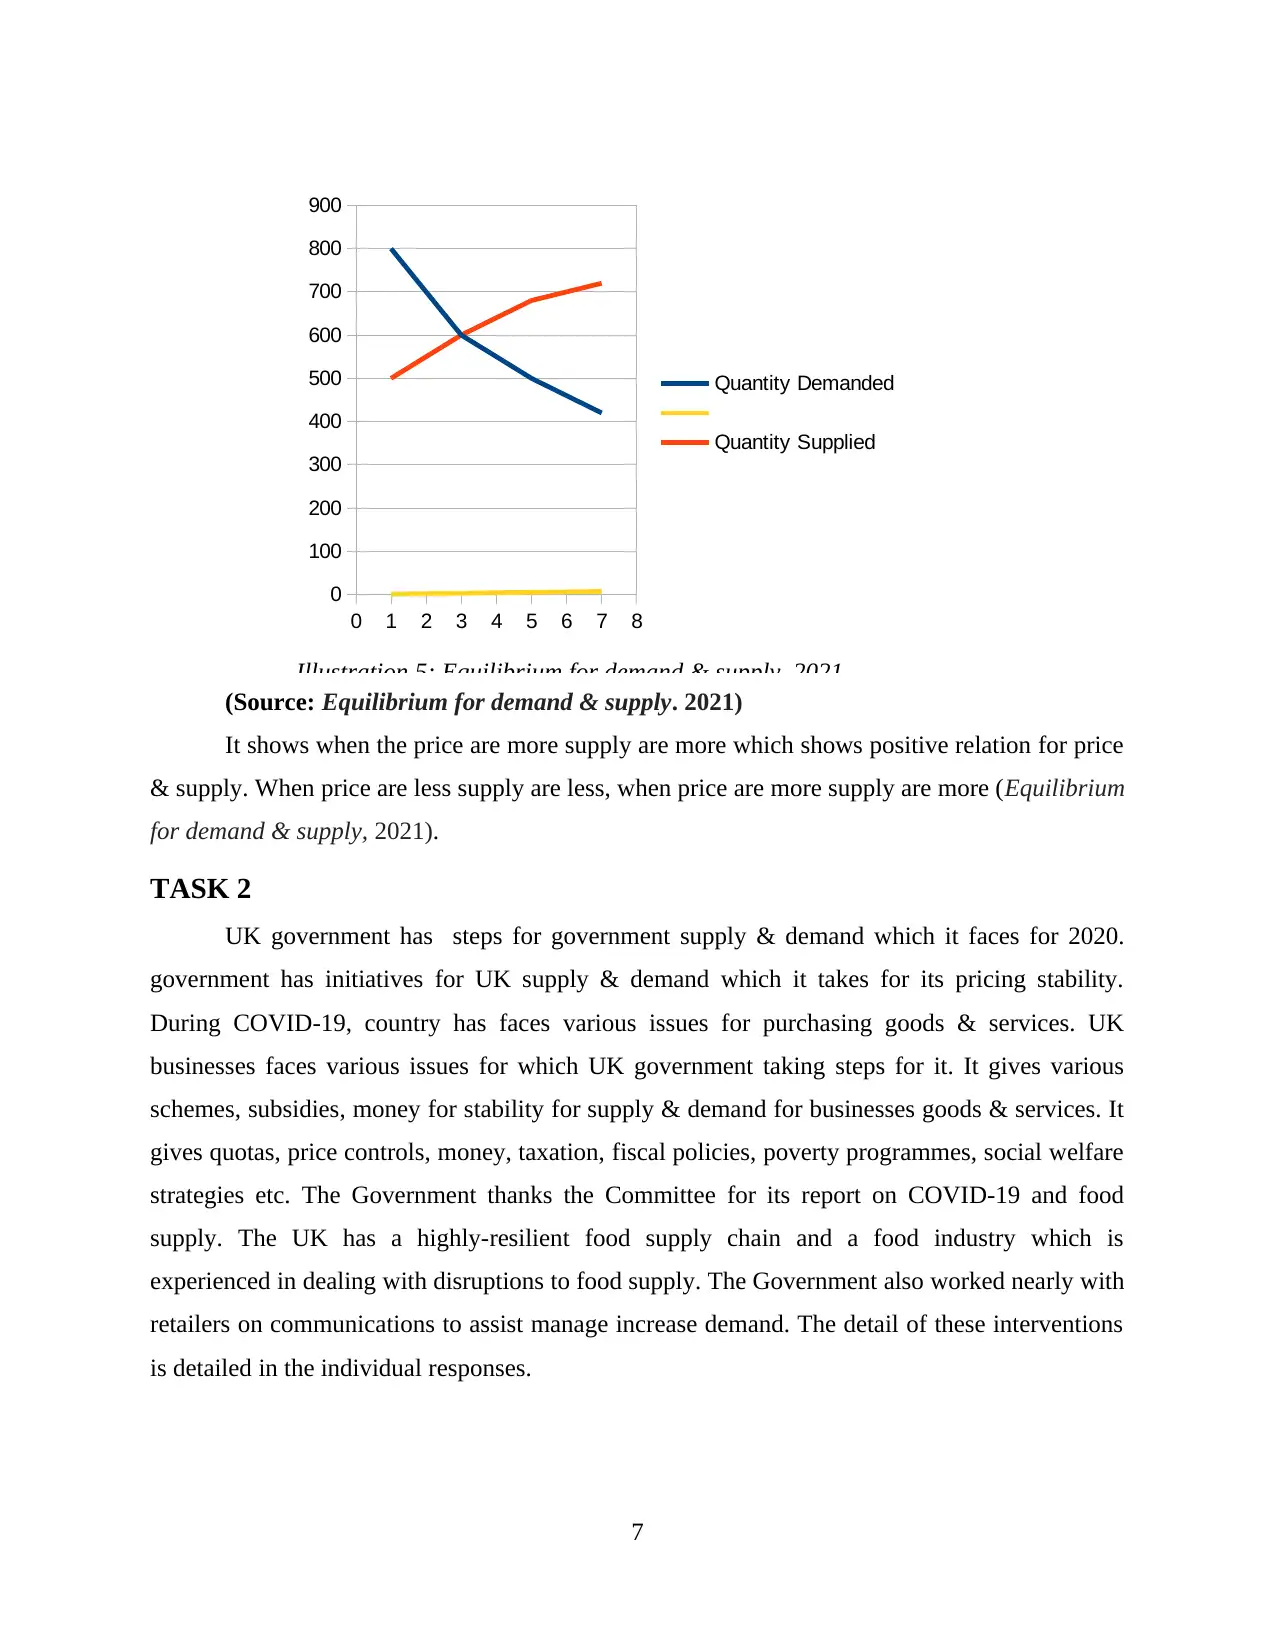
(Source: Equilibrium for demand & supply. 2021)
It shows when the price are more supply are more which shows positive relation for price
& supply. When price are less supply are less, when price are more supply are more (Equilibrium
for demand & supply, 2021).
TASK 2
UK government has steps for government supply & demand which it faces for 2020.
government has initiatives for UK supply & demand which it takes for its pricing stability.
During COVID-19, country has faces various issues for purchasing goods & services. UK
businesses faces various issues for which UK government taking steps for it. It gives various
schemes, subsidies, money for stability for supply & demand for businesses goods & services. It
gives quotas, price controls, money, taxation, fiscal policies, poverty programmes, social welfare
strategies etc. The Government thanks the Committee for its report on COVID-19 and food
supply. The UK has a highly-resilient food supply chain and a food industry which is
experienced in dealing with disruptions to food supply. The Government also worked nearly with
retailers on communications to assist manage increase demand. The detail of these interventions
is detailed in the individual responses.
7
0 1 2 3 4 5 6 7 8
0
100
200
300
400
500
600
700
800
900
Quantity Demanded
Quantity Supplied
Illustration 5: Equilibrium for demand & supply. 2021
⊘ This is a preview!⊘
Do you want full access?
Subscribe today to unlock all pages.
Trusted by 1+ million students worldwide
Quotas : It is about special category customers UK government gives quotas for poverty
people. As it gives less price food for them. Government takes initiatives for poorer people for
which it gives less price food goods 7 services for customers. Poor people who were not able to
purchase goods, government gives higher quality goods for them. During lock down retail
sectors , company's, customers are faces various issues for which government gives quality for
their goods & services. It gives quotas for businesses also by reducing tax prices so that they can
purchase raw material for less prices which will helps them for reducing costs which helps
customers for purchasing goods for less prices.
Price controls: Government shows it prevents rise for prices for above equilibrium &
prevents falls for prices below equilibrium which will helps for price controlling. UK
government use this strategy for controlling prices for reduces & risen it helps for price stability
which helps for stable demand & supply. During lockdown retailers are using high price strategy
which affects customers purchase power for it government provides goods for less price &
control prices.
Government transfers: UK government helps businesses for giving them money which
helps for better supply & demand for goods. UK government using this for stability for supply &
demand. Government transfers money for retailer so that they purchases goods, it gives money
for customers for purchasing goods. Government gives schemes which helps poor customers for
consuming for better food quality things. UK government gives money for the customers bank
account.
Taxation: Government for UK comes for less tax rates which helps for reducing costs
for production. It helps businesses for less prices consumption for goods they are purchasing.
Government thinks about tax rates which for reducing them which will helps for reducing prices.
In context to food goods & services, demand & supply issues for UK for 2020, UK government
initiatives for demand & supply which helps for better performance which helps for higher
profitability for the businesses.
CONCLUSION
From the above report it has been concluded that economics is about managing resources
which help for better use for supply & demand. Economics is about study which shows how
people interact for values which includes production, distribution & consumption for goods &
8
Paraphrase This Document
Need a fresh take? Get an instant paraphrase of this document with our AI Paraphraser
services. Demand is about customers willingness for purchasing goods & services. Supply is
about resources which businesses wants for gives for its customers. Price & demand has inverse
relation & price & supply has positive relation. Equilibrium is about where supply & demand are
intersects this point will equilibrium. There are various factors which affects supply & demand
which includes change in price, technology, customers taste, substitute goods, customers income
etc. These factors are shifts & movements for supply & demand curve which helps for better
performance which helps for higher profitability for the businesses.
9
REFERENCES
Books & journals:
Krugman, P. and Wells, R., 2017. Volkswirtschaftslehre. Schäffer-Poeschel.
Ferreira Gregorio, V., Pié, L. and Terceño, A., 2018. A systematic literature review of bio, green
and circular economy trends in publications in the field of economics and business management.
Sustainability. 10(11). p.4232.
Rossier, T. and Bühlmann, F., 2018. The internationalisation of economics and business studies:
import of excellence, cosmopolitan capital, or American dominance?. Historical Social
Research/Historische Sozialforschung. 43(3 (165). pp.189-215.
Mulhearn, C. and Vane, H. R., 2020. Economics for business. Red Globe Press.
Hummel, K., Pfaff, D. and Rost, K., 2018. Does economics and business education wash away
moral judgment competence?. Journal of Business Ethics. 150(2). pp.559-577.
Kasim, T., Haracic, M. and Haracic, M., 2018. The improvement of business efficiency through
business process management. Economic Review: Journal of Economics and Business. 16(1).
pp.31-43.
Online
Shift in Demand. 2021. [Online]. Available through < https://courses.lumenlearning.com >
Shift in Supply. 2021. [Online]. Available through < https://courses.lumenlearning.com >
movement in Demand. 2021. [Online]. Available through < https://courses.lumenlearning.com >
movement in Supply. 2021. [Online]. Available through < https://courses.lumenlearning.com >
Equilibrium for demand & supply. 2021. [Online] < https://courses.lumenlearning.com >
10
⊘ This is a preview!⊘
Do you want full access?
Subscribe today to unlock all pages.
Trusted by 1+ million students worldwide
1 out of 12
Related Documents


Your All-in-One AI-Powered Toolkit for Academic Success.
+13062052269
info@desklib.com
Available 24*7 on WhatsApp / Email
![[object Object]](/_next/static/media/star-bottom.7253800d.svg)
Unlock your academic potential
Copyright © 2020–2026 A2Z Services. All Rights Reserved. Developed and managed by ZUCOL.