Analysis of Education and Wages: An Economics Report
VerifiedAdded on 2022/11/28
|9
|2217
|315
Report
AI Summary
This report investigates the association between education and earnings using quantitative methods. It explores the relationship between years of education and hourly wages, employing techniques such as regression analysis, correlation coefficients, and t-tests. The analysis includes descriptive statistics, scatter diagrams, and the estimation and interpretation of a regression equation. The results indicate a moderate positive correlation between education and wages, but the findings reveal that the regression equation does not provide a good fit for predicting wage rates due to a low coefficient of determination. The report concludes with a discussion of the findings, limitations, and recommendations for future research, suggesting the inclusion of multiple variables and qualitative analysis for a more comprehensive understanding of the relationship between education and earnings. The report is a valuable resource for students seeking insights into economic analysis and quantitative methods, and is available on Desklib.
ECONOMICS AND
QUANTITATIVE
ANALYSIS
QUANTITATIVE
ANALYSIS
Paraphrase This Document
Need a fresh take? Get an instant paraphrase of this document with our AI Paraphraser
Table of Contents
Purpose............................................................................................................................................3
Background - Association between Education and Earnings..........................................................3
Method.............................................................................................................................................3
Results..............................................................................................................................................3
Discussion........................................................................................................................................8
Recommendations............................................................................................................................8
REFERENCES................................................................................................................................9
Purpose
The very purpose of this report is to identify that association between the two most important
variables of every economy that is wages and education (Bartik and Hershbein, 2018). So, in this
report by applying various statistical techniques and tools this relationship will be identified and
stated that whether there is any association exists between these two variables or not and or if
there is any other external factors that are causing changes in these variables.
Background - Association between Education and Earnings
Basically, there is a strong link exist between the education of an individual and their
earnings patter and the most important thing is that most of the economist knew that. That’s why
the economist put their focus on these issues more. Providing the best education system to the
students is the most crucial and important role of the respective country. It is because students
are the future of the country and world. The link between the education and earning is same as
the link between the investment and rate of return. This association exist not because that the
higher degree candidates provide and directly raise the productivity of the company. But the link
is that higher education candidates will and are likely to be more productive as compared to the
people with less and no education. High and rising-income inequality in the country is increases
on a daily basis just because it depends upon the level of education a candidates pursue and have
(Witteveen and Attewell, 2019).
Because of the direct relation between the education level and income level, the
government of the UK have to launch various schemes related to providing free education to the
poor people. So, that there income status can be improved through increase in earnings.
Method
In this report, in order to identify the association between two variables that is years of education
and wages rate, the quantitative methods of analyzing data has been adopted (Bernhofen, 2019).
To quantitatively analyze the data related to these variables various statistical tools will be
applied such as regression, correlation, statistical significance test, etc.
Results
a. descriptive analysis of hourly wages and years of education
Mean wages are found to be 22.30 while mean education is around 13.76 or 14 years which
means the sample has attended almost 14 years of education and are earning wages @ of 22.3
per hour.
The standard deviation comes out at 14.02 for wages which means there can a variation of 14.02
from the mean wages in the sample. While the standard deviation of 2.72 or 3 years has been
found for education level, which means there can be a variation of 3 years from the mean
education level in the sample.
⊘ This is a preview!⊘
Do you want full access?
Subscribe today to unlock all pages.
Trusted by 1+ million students worldwide
In the sample minimum wages earned per hour is 4.33 and the maximum wages earned per hour
is 76.93. While the minimum years of education found out to be 6 years and maximum years of
education is 21 years.
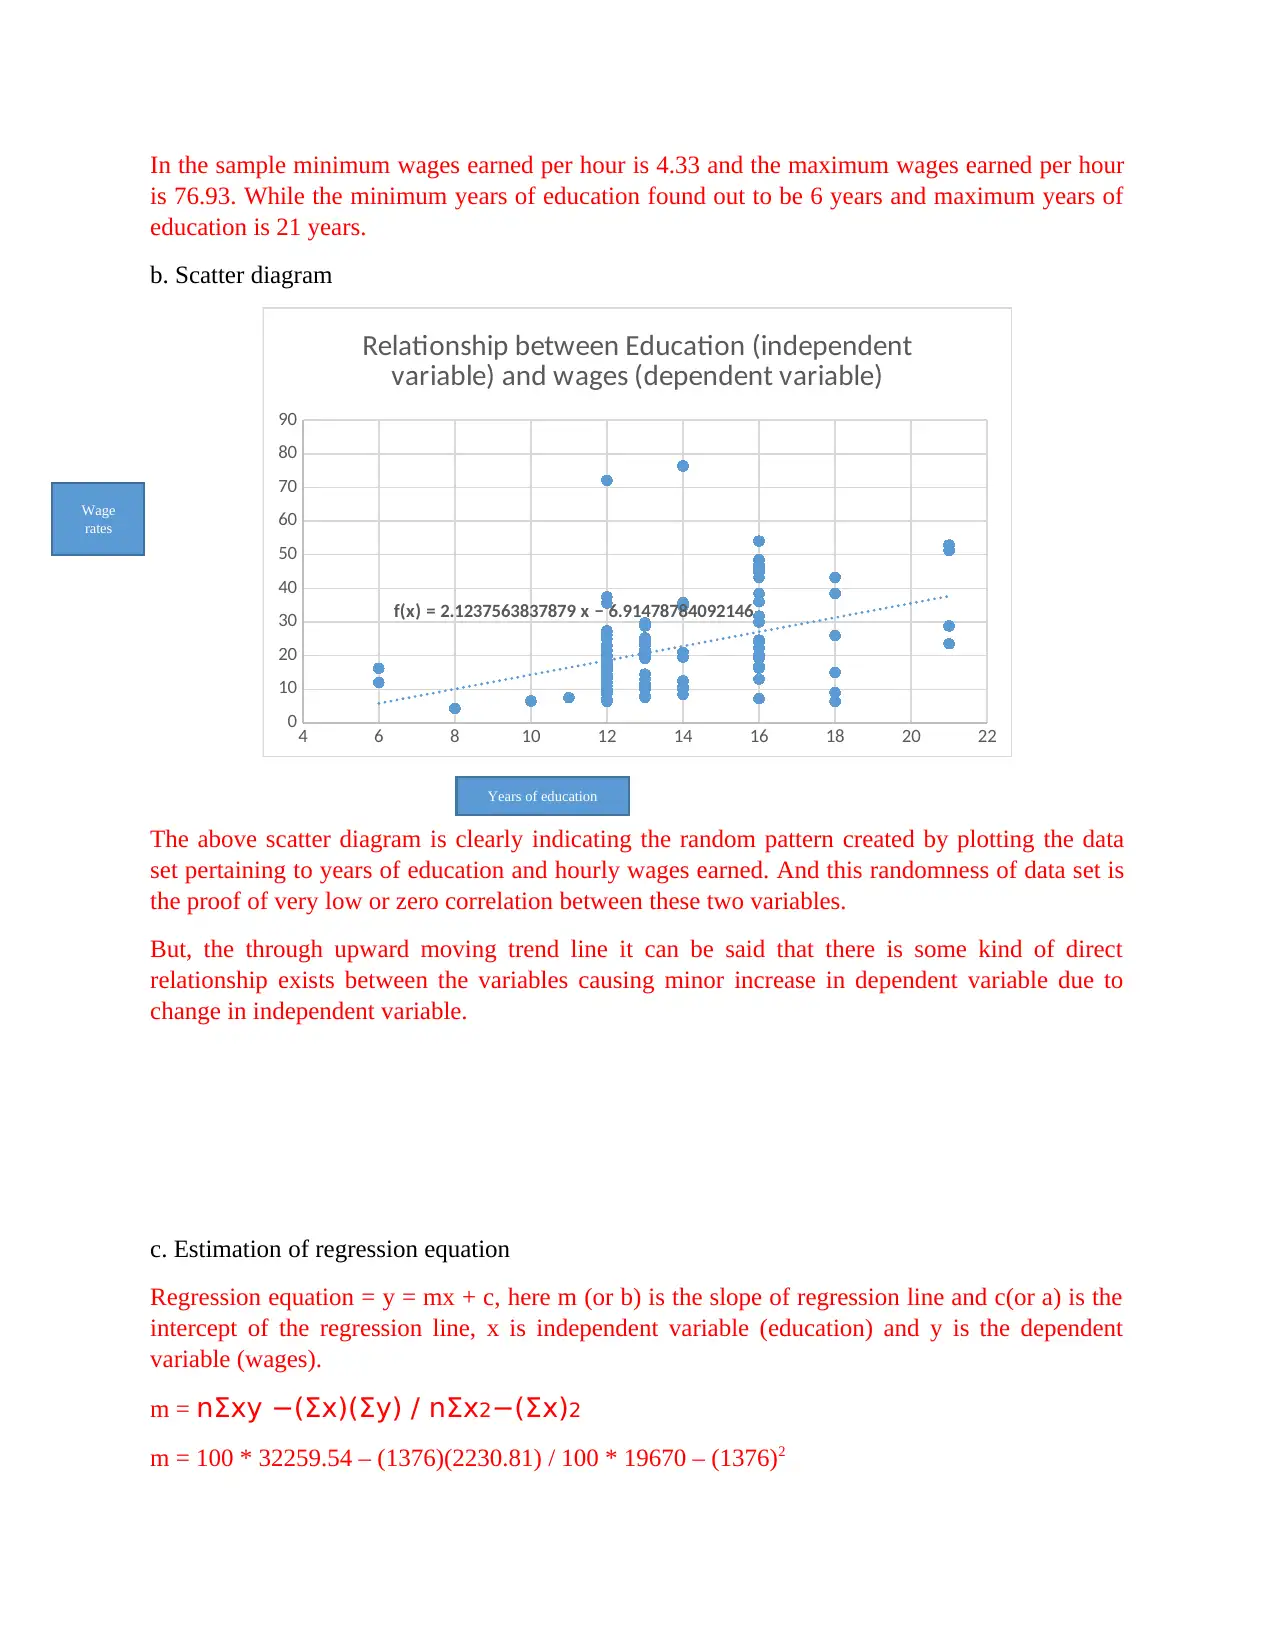
b. Scatter diagram
4 6 8 10 12 14 16 18 20 22
0
10
20
30
40
50
60
70
80
90
f(x) = 2.1237563837879 x − 6.91478784092146
Relationship between Education (independent
variable) and wages (dependent variable)
The above scatter diagram is clearly indicating the random pattern created by plotting the data
set pertaining to years of education and hourly wages earned. And this randomness of data set is
the proof of very low or zero correlation between these two variables.
But, the through upward moving trend line it can be said that there is some kind of direct
relationship exists between the variables causing minor increase in dependent variable due to
change in independent variable.
c. Estimation of regression equation
Regression equation = y = mx + c, here m (or b) is the slope of regression line and c(or a) is the
intercept of the regression line, x is independent variable (education) and y is the dependent
variable (wages).
m = nΣxy −(Σx)(Σy) / nΣx2−(Σx)2
m = 100 * 32259.54 – (1376)(2230.81) / 100 * 19670 – (1376)2
Wage
rates
Years of education
is 76.93. While the minimum years of education found out to be 6 years and maximum years of
education is 21 years.
b. Scatter diagram
4 6 8 10 12 14 16 18 20 22
0
10
20
30
40
50
60
70
80
90
f(x) = 2.1237563837879 x − 6.91478784092146
Relationship between Education (independent
variable) and wages (dependent variable)
The above scatter diagram is clearly indicating the random pattern created by plotting the data
set pertaining to years of education and hourly wages earned. And this randomness of data set is
the proof of very low or zero correlation between these two variables.
But, the through upward moving trend line it can be said that there is some kind of direct
relationship exists between the variables causing minor increase in dependent variable due to
change in independent variable.
c. Estimation of regression equation
Regression equation = y = mx + c, here m (or b) is the slope of regression line and c(or a) is the
intercept of the regression line, x is independent variable (education) and y is the dependent
variable (wages).
m = nΣxy −(Σx)(Σy) / nΣx2−(Σx)2
m = 100 * 32259.54 – (1376)(2230.81) / 100 * 19670 – (1376)2
Wage
rates
Years of education
Paraphrase This Document
Need a fresh take? Get an instant paraphrase of this document with our AI Paraphraser
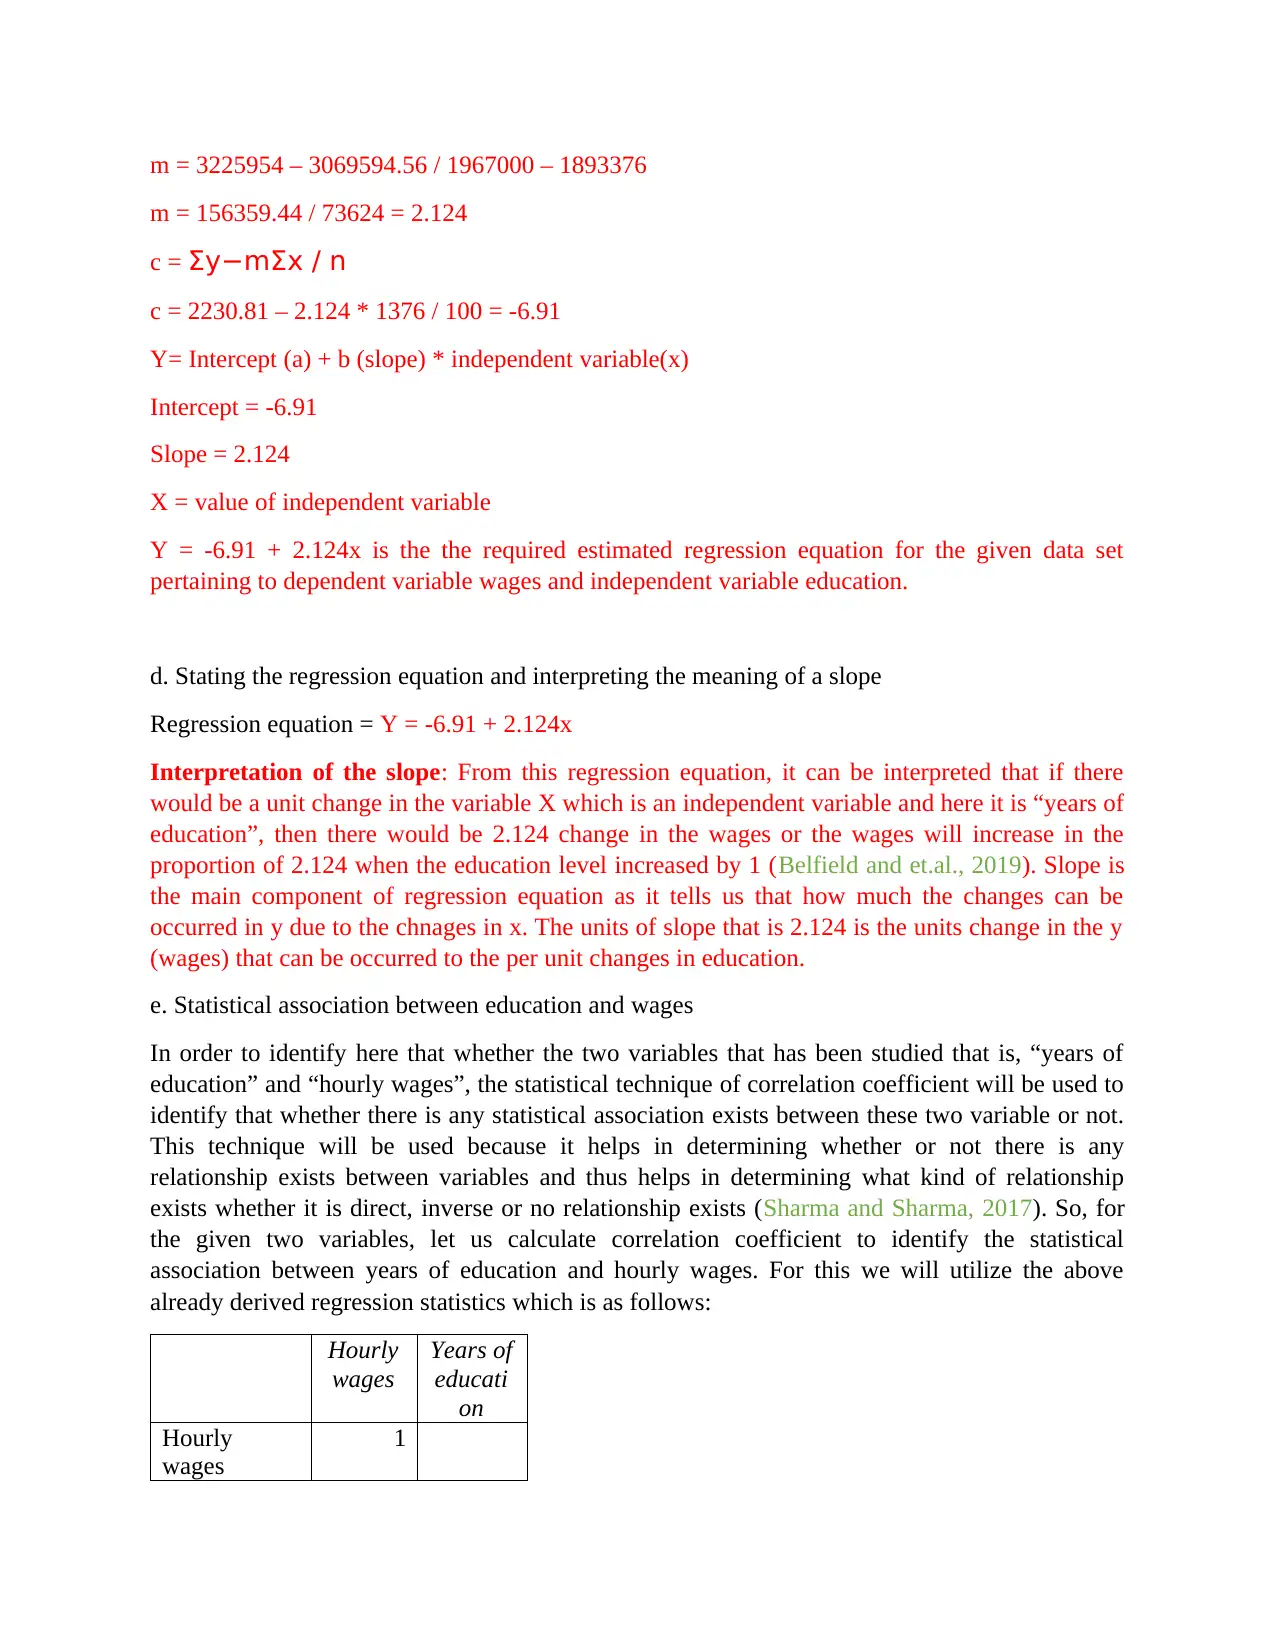
m = 3225954 – 3069594.56 / 1967000 – 1893376
m = 156359.44 / 73624 = 2.124
c = Σy−mΣx / n
c = 2230.81 – 2.124 * 1376 / 100 = -6.91
Y= Intercept (a) + b (slope) * independent variable(x)
Intercept = -6.91
Slope = 2.124
X = value of independent variable
Y = -6.91 + 2.124x is the the required estimated regression equation for the given data set
pertaining to dependent variable wages and independent variable education.
d. Stating the regression equation and interpreting the meaning of a slope
Regression equation = Y = -6.91 + 2.124x
Interpretation of the slope: From this regression equation, it can be interpreted that if there
would be a unit change in the variable X which is an independent variable and here it is “years of
education”, then there would be 2.124 change in the wages or the wages will increase in the
proportion of 2.124 when the education level increased by 1 (Belfield and et.al., 2019). Slope is
the main component of regression equation as it tells us that how much the changes can be
occurred in y due to the chnages in x. The units of slope that is 2.124 is the units change in the y
(wages) that can be occurred to the per unit changes in education.
e. Statistical association between education and wages
In order to identify here that whether the two variables that has been studied that is, “years of
education” and “hourly wages”, the statistical technique of correlation coefficient will be used to
identify that whether there is any statistical association exists between these two variable or not.
This technique will be used because it helps in determining whether or not there is any
relationship exists between variables and thus helps in determining what kind of relationship
exists whether it is direct, inverse or no relationship exists (Sharma and Sharma, 2017). So, for
the given two variables, let us calculate correlation coefficient to identify the statistical
association between years of education and hourly wages. For this we will utilize the above
already derived regression statistics which is as follows:
Hourly
wages
Years of
educati
on
Hourly
wages
1
Years of
education
0.41305
2
1
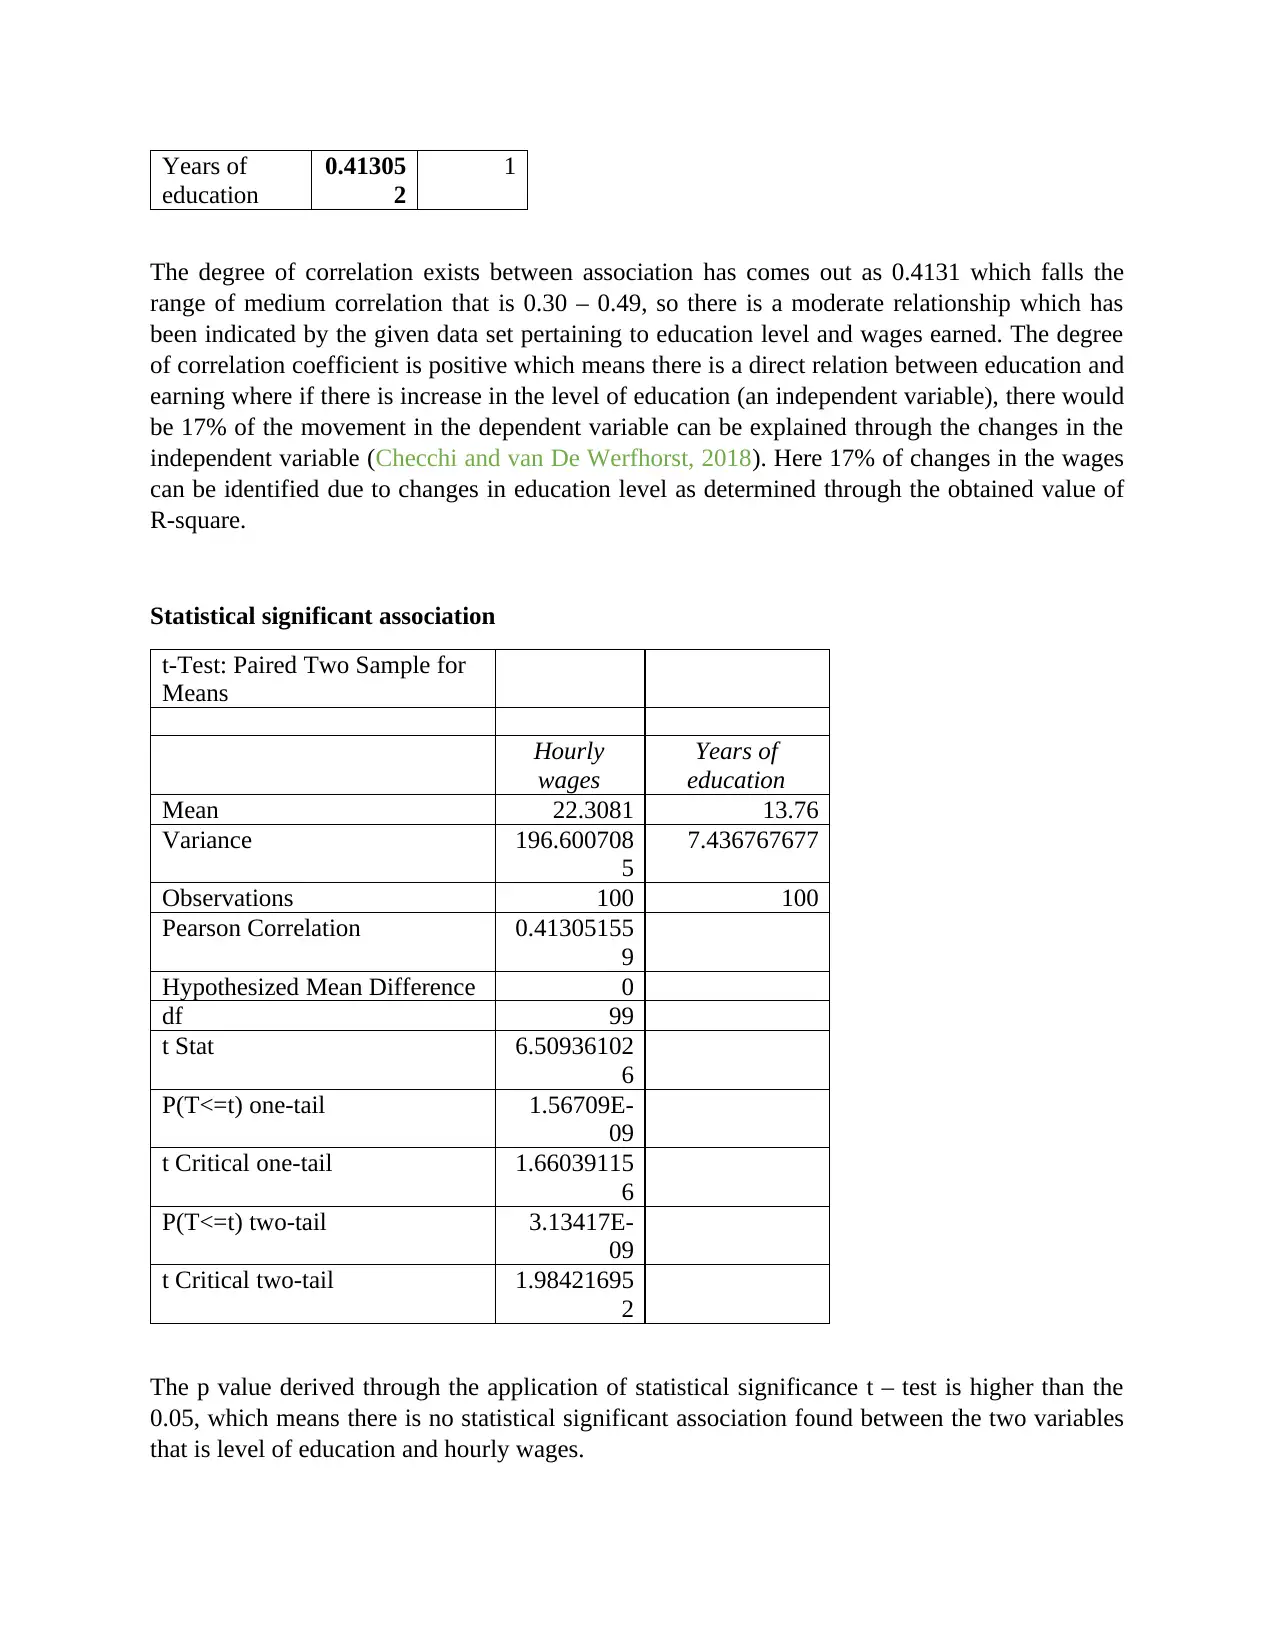
The degree of correlation exists between association has comes out as 0.4131 which falls the
range of medium correlation that is 0.30 – 0.49, so there is a moderate relationship which has
been indicated by the given data set pertaining to education level and wages earned. The degree
of correlation coefficient is positive which means there is a direct relation between education and
earning where if there is increase in the level of education (an independent variable), there would
be 17% of the movement in the dependent variable can be explained through the changes in the
independent variable (Checchi and van De Werfhorst, 2018). Here 17% of changes in the wages
can be identified due to changes in education level as determined through the obtained value of
R-square.
Statistical significant association
t-Test: Paired Two Sample for
Means
Hourly
wages
Years of
education
Mean 22.3081 13.76
Variance 196.600708
5
7.436767677
Observations 100 100
Pearson Correlation 0.41305155
9
Hypothesized Mean Difference 0
df 99
t Stat 6.50936102
6
P(T<=t) one-tail 1.56709E-
09
t Critical one-tail 1.66039115
6
P(T<=t) two-tail 3.13417E-
09
t Critical two-tail 1.98421695
2
The p value derived through the application of statistical significance t – test is higher than the
0.05, which means there is no statistical significant association found between the two variables
that is level of education and hourly wages.
education
0.41305
2
1
The degree of correlation exists between association has comes out as 0.4131 which falls the
range of medium correlation that is 0.30 – 0.49, so there is a moderate relationship which has
been indicated by the given data set pertaining to education level and wages earned. The degree
of correlation coefficient is positive which means there is a direct relation between education and
earning where if there is increase in the level of education (an independent variable), there would
be 17% of the movement in the dependent variable can be explained through the changes in the
independent variable (Checchi and van De Werfhorst, 2018). Here 17% of changes in the wages
can be identified due to changes in education level as determined through the obtained value of
R-square.
Statistical significant association
t-Test: Paired Two Sample for
Means
Hourly
wages
Years of
education
Mean 22.3081 13.76
Variance 196.600708
5
7.436767677
Observations 100 100
Pearson Correlation 0.41305155
9
Hypothesized Mean Difference 0
df 99
t Stat 6.50936102
6
P(T<=t) one-tail 1.56709E-
09
t Critical one-tail 1.66039115
6
P(T<=t) two-tail 3.13417E-
09
t Critical two-tail 1.98421695
2
The p value derived through the application of statistical significance t – test is higher than the
0.05, which means there is no statistical significant association found between the two variables
that is level of education and hourly wages.
⊘ This is a preview!⊘
Do you want full access?
Subscribe today to unlock all pages.
Trusted by 1+ million students worldwide
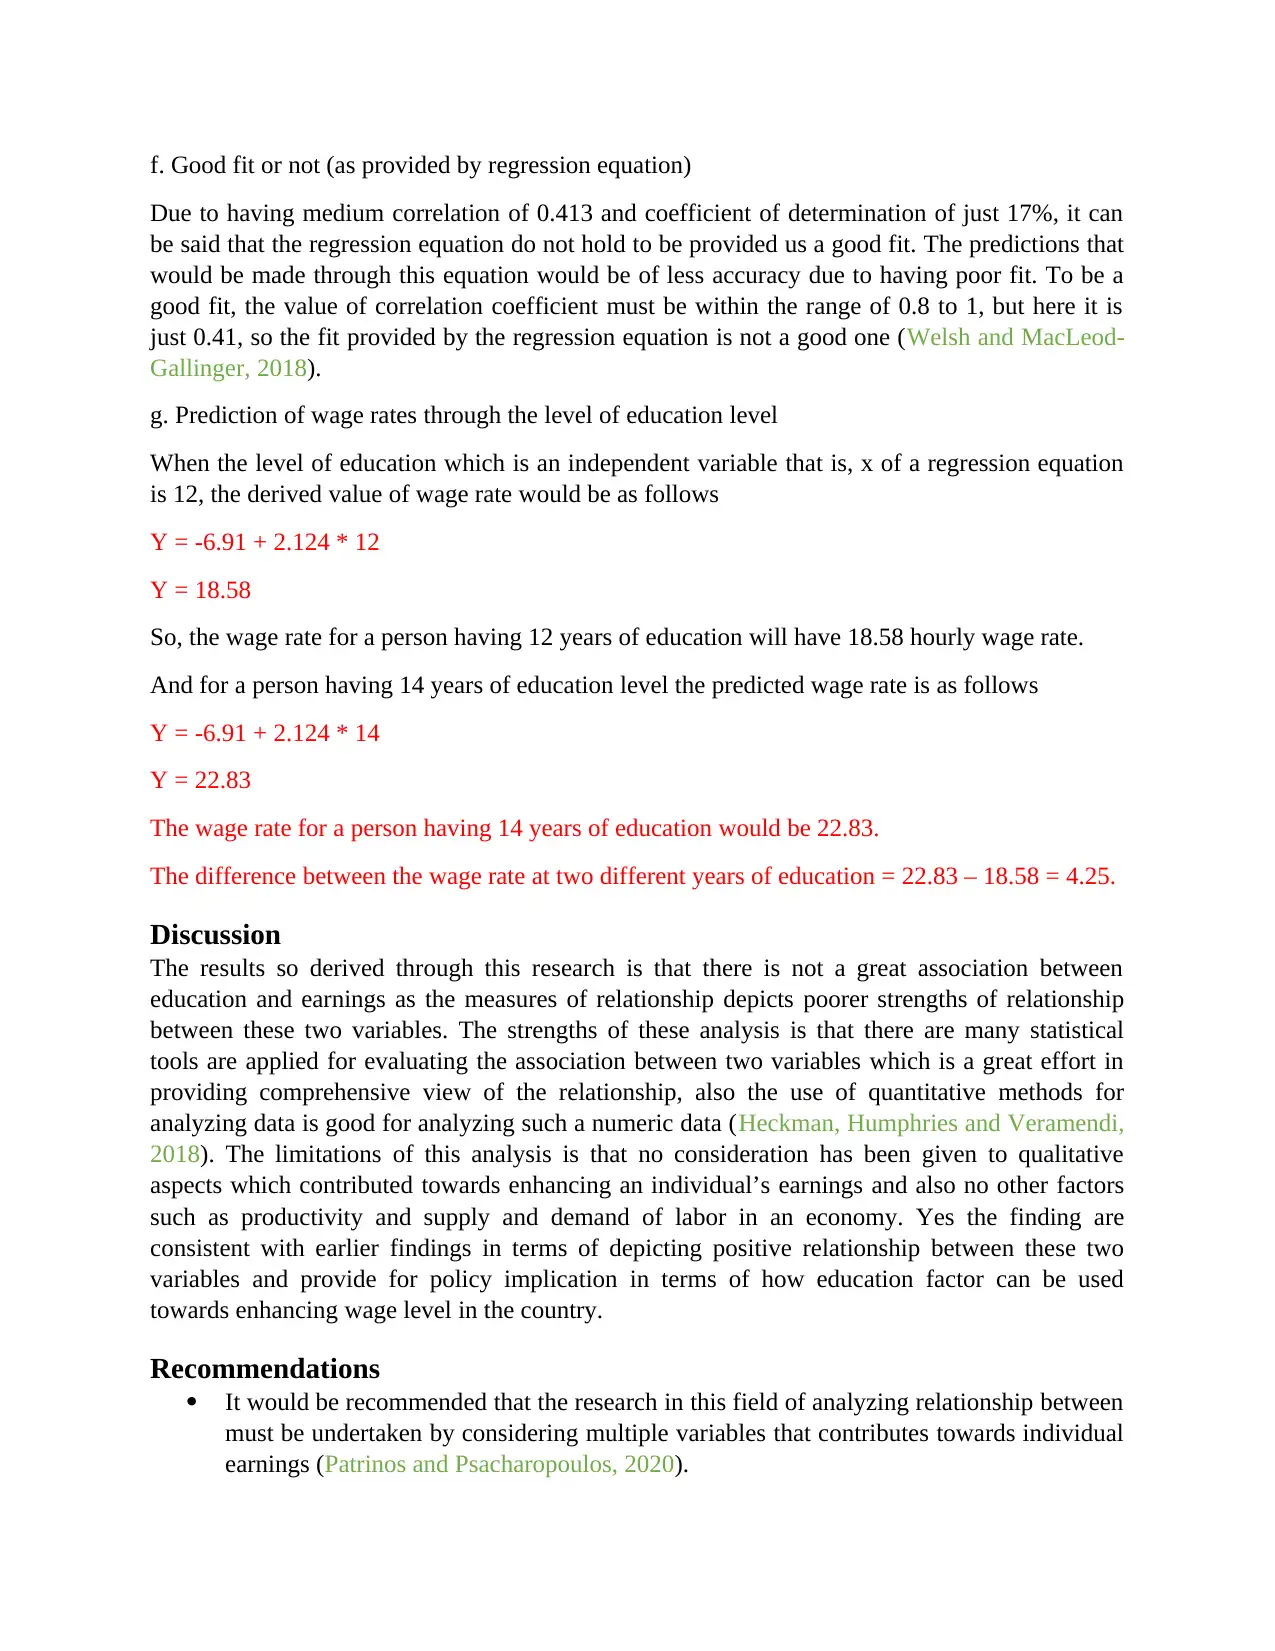
f. Good fit or not (as provided by regression equation)
Due to having medium correlation of 0.413 and coefficient of determination of just 17%, it can
be said that the regression equation do not hold to be provided us a good fit. The predictions that
would be made through this equation would be of less accuracy due to having poor fit. To be a
good fit, the value of correlation coefficient must be within the range of 0.8 to 1, but here it is
just 0.41, so the fit provided by the regression equation is not a good one (Welsh and MacLeod-
Gallinger, 2018).
g. Prediction of wage rates through the level of education level
When the level of education which is an independent variable that is, x of a regression equation
is 12, the derived value of wage rate would be as follows
Y = -6.91 + 2.124 * 12
Y = 18.58
So, the wage rate for a person having 12 years of education will have 18.58 hourly wage rate.
And for a person having 14 years of education level the predicted wage rate is as follows
Y = -6.91 + 2.124 * 14
Y = 22.83
The wage rate for a person having 14 years of education would be 22.83.
The difference between the wage rate at two different years of education = 22.83 – 18.58 = 4.25.
Discussion
The results so derived through this research is that there is not a great association between
education and earnings as the measures of relationship depicts poorer strengths of relationship
between these two variables. The strengths of these analysis is that there are many statistical
tools are applied for evaluating the association between two variables which is a great effort in
providing comprehensive view of the relationship, also the use of quantitative methods for
analyzing data is good for analyzing such a numeric data (Heckman, Humphries and Veramendi,
2018). The limitations of this analysis is that no consideration has been given to qualitative
aspects which contributed towards enhancing an individual’s earnings and also no other factors
such as productivity and supply and demand of labor in an economy. Yes the finding are
consistent with earlier findings in terms of depicting positive relationship between these two
variables and provide for policy implication in terms of how education factor can be used
towards enhancing wage level in the country.
Recommendations
It would be recommended that the research in this field of analyzing relationship between
must be undertaken by considering multiple variables that contributes towards individual
earnings (Patrinos and Psacharopoulos, 2020).
Paraphrase This Document
Need a fresh take? Get an instant paraphrase of this document with our AI Paraphraser

It would be recommended that along with quantitative analysis, there should be a
presence of qualitative analysis in the research as well to obtain a more useful insights
about this issue of association between education and earnings.
presence of qualitative analysis in the research as well to obtain a more useful insights
about this issue of association between education and earnings.
REFERENCES
Bartik, T. and Hershbein, B., 2018. Degrees of poverty: The relationship between family income
background and the returns to education.
Witteveen, D. and Attewell, P., 2019. Delayed time-to-degree and post-college
earnings. Research in Higher Education. pp.1-28.
Bernhofen, S., 2019. What Impact does Education and Undergraduate Degree Field Have on
Earnings?.
Belfield, C., and et.al., 2019. The impact of undergraduate degrees on early-career earnings:
Research report: November 2018.
Sharma, S. and Sharma, P., 2017. Educational mismatch and its impact on earnings: evidence
from Indian labour market. International Journal of Social Economics.
Checchi, D. and van De Werfhorst, H. G., 2018. Policies, skills and earnings: how educational
inequality affects earnings inequality. Socio-Economic Review. 16(1). pp.137-160.
Welsh, W. A. and MacLeod-Gallinger, J., 2018. Effect of college on employment and earnings.
In Deaf students in postsecondary education (pp. 185-209). Routledge.
Heckman, J. J., Humphries, J. E. and Veramendi, G., 2018. Returns to education: The causal
effects of education on earnings, health, and smoking. Journal of Political
Economy. 126(S1). pp.S197-S246.
Patrinos, H. A. and Psacharopoulos, G., 2020. Returns to education in developing countries.
In The Economics of education (pp. 53-64). Academic Press.
⊘ This is a preview!⊘
Do you want full access?
Subscribe today to unlock all pages.
Trusted by 1+ million students worldwide
1 out of 9
Related Documents


Your All-in-One AI-Powered Toolkit for Academic Success.
+13062052269
info@desklib.com
Available 24*7 on WhatsApp / Email
![[object Object]](/_next/static/media/star-bottom.7253800d.svg)
Unlock your academic potential
Copyright © 2020–2026 A2Z Services. All Rights Reserved. Developed and managed by ZUCOL.