Analysis of Wind Speed Data Using Excel for Environmental Engineering
VerifiedAdded on 2022/11/17
|3
|618
|405
Report
AI Summary
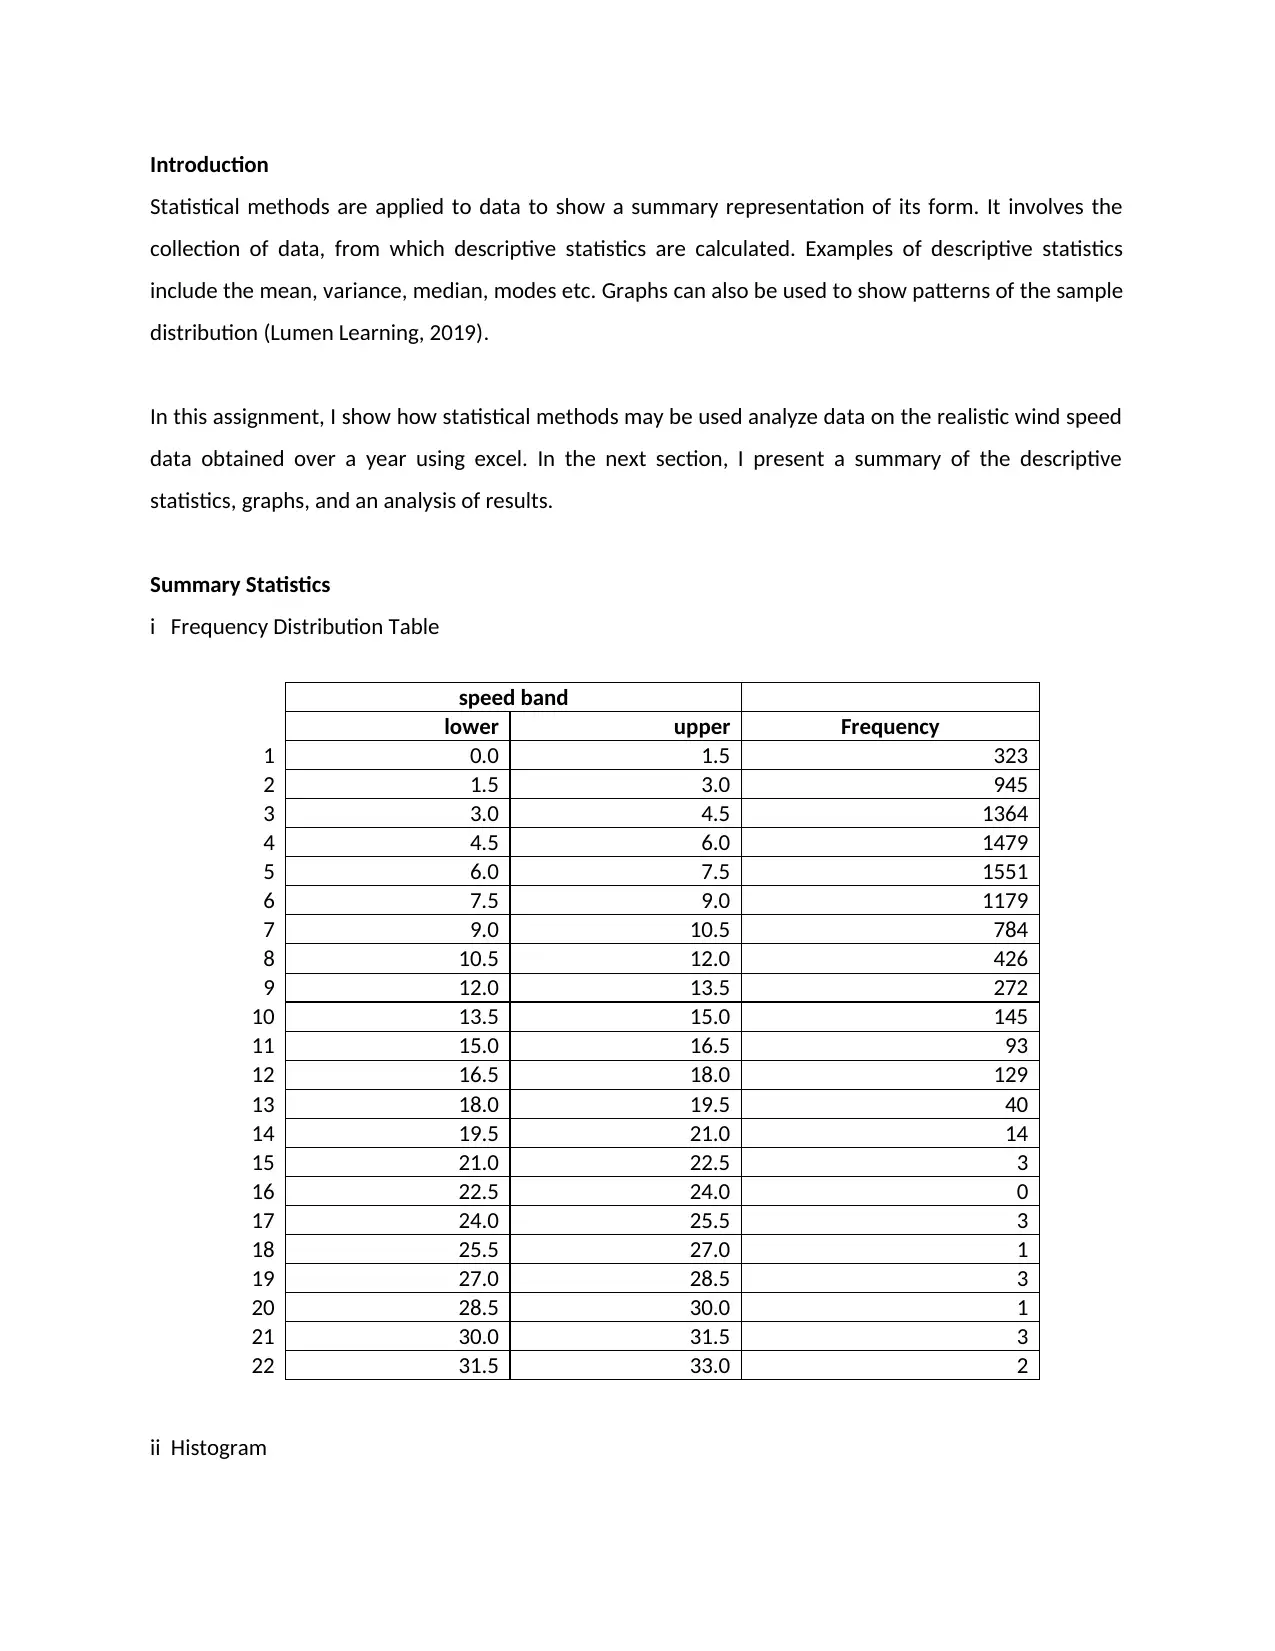
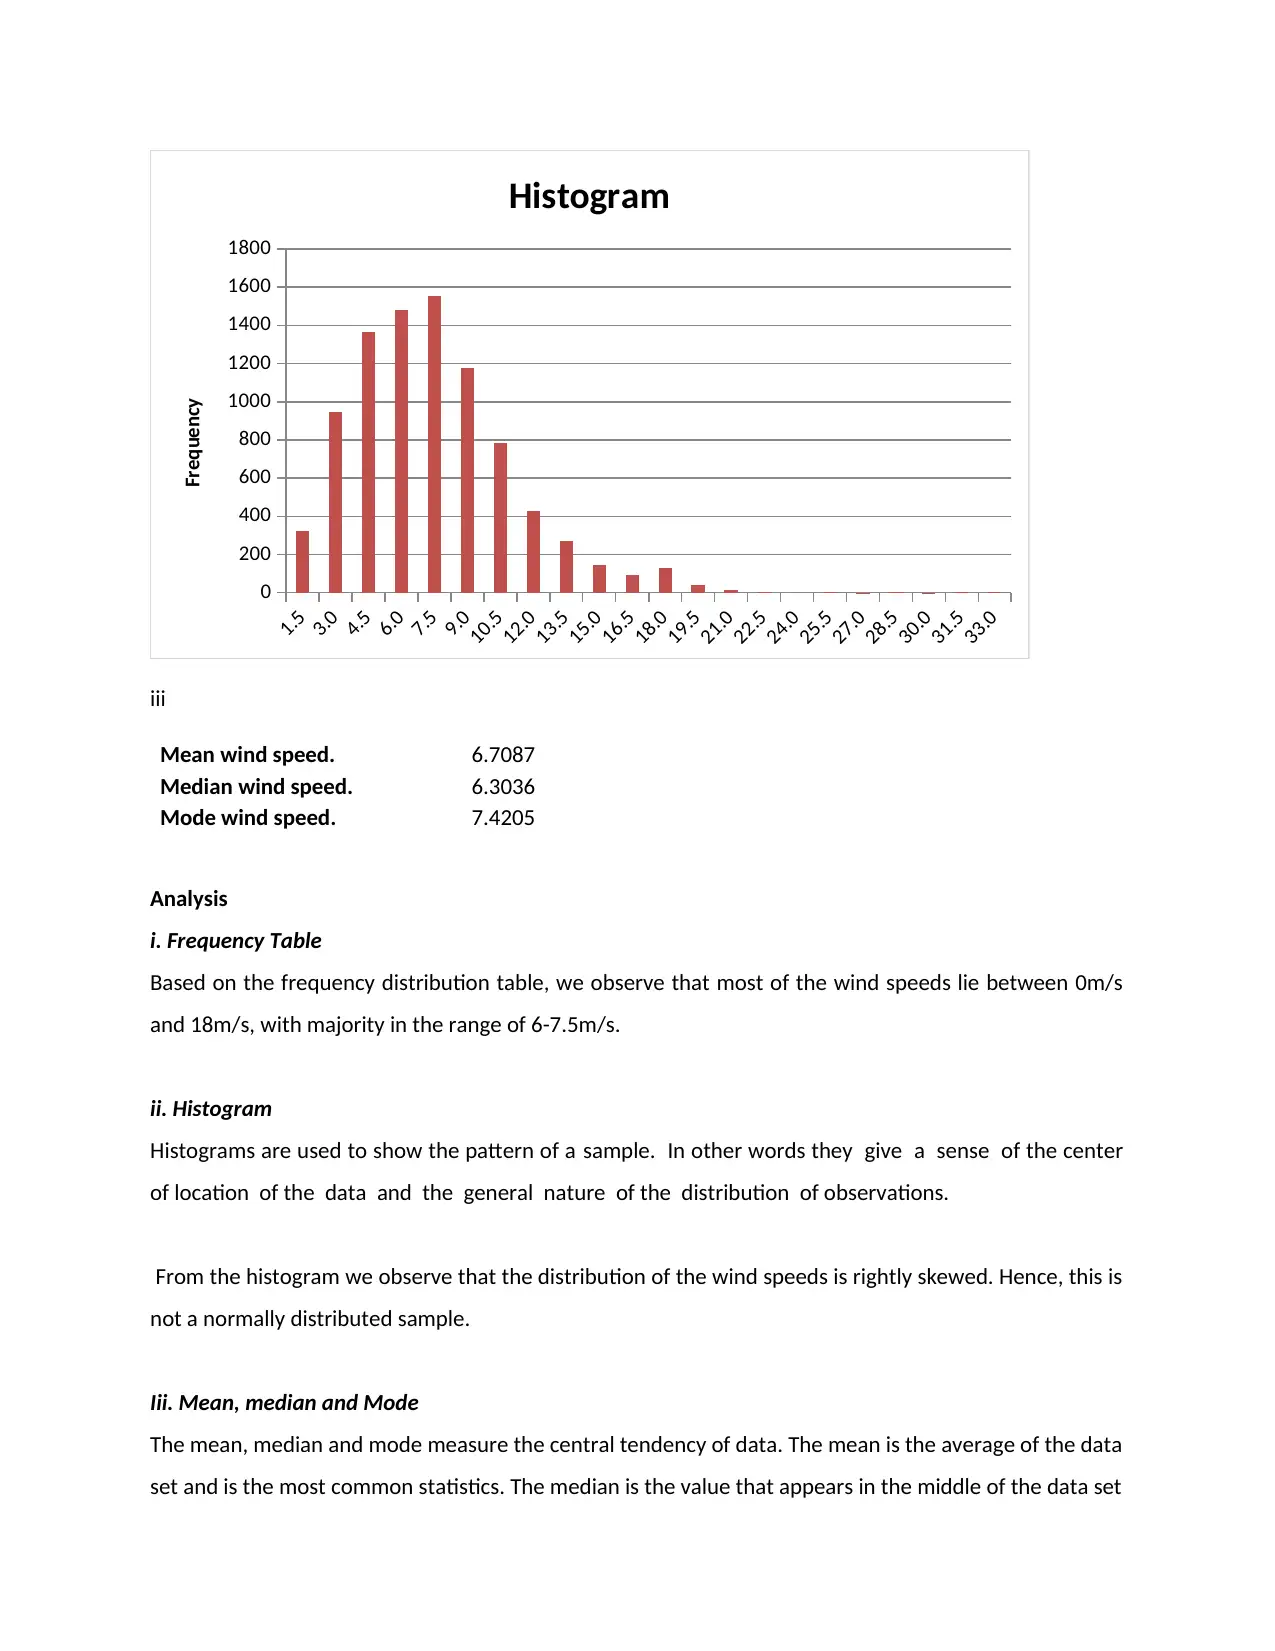
This report presents an analysis of wind speed data collected over a year in a rural area of Scotland. The analysis utilizes Excel to process hourly wind speed measurements. The report begins with an introduction to the coursework, followed by a detailed explanation of the methodology. The wind speed range is divided into equal speed bands, and a frequency distribution table is created to count the occurrences within each band. A histogram is generated to visualize the data distribution. Descriptive statistics, including the mean, median, and mode, are calculated and analyzed to understand the central tendency and skewness of the wind speed data. The report concludes with a discussion of the findings, emphasizing the use of mathematical software for efficient and accurate data analysis. The results indicate a right-skewed distribution, with the median being the best measure of central tendency. Excel's role in simplifying complex calculations with a large dataset is highlighted.
1 out of 3
Related Documents


Your All-in-One AI-Powered Toolkit for Academic Success.
+13062052269
info@desklib.com
Available 24*7 on WhatsApp / Email
![[object Object]](/_next/static/media/star-bottom.7253800d.svg)
Copyright © 2020–2026 A2Z Services. All Rights Reserved. Developed and managed by ZUCOL.