Data Analysis and Visualization of COVID-19 Infection Rates
VerifiedAdded on  2023/01/04
|16
|2350
|88
Report
AI Summary
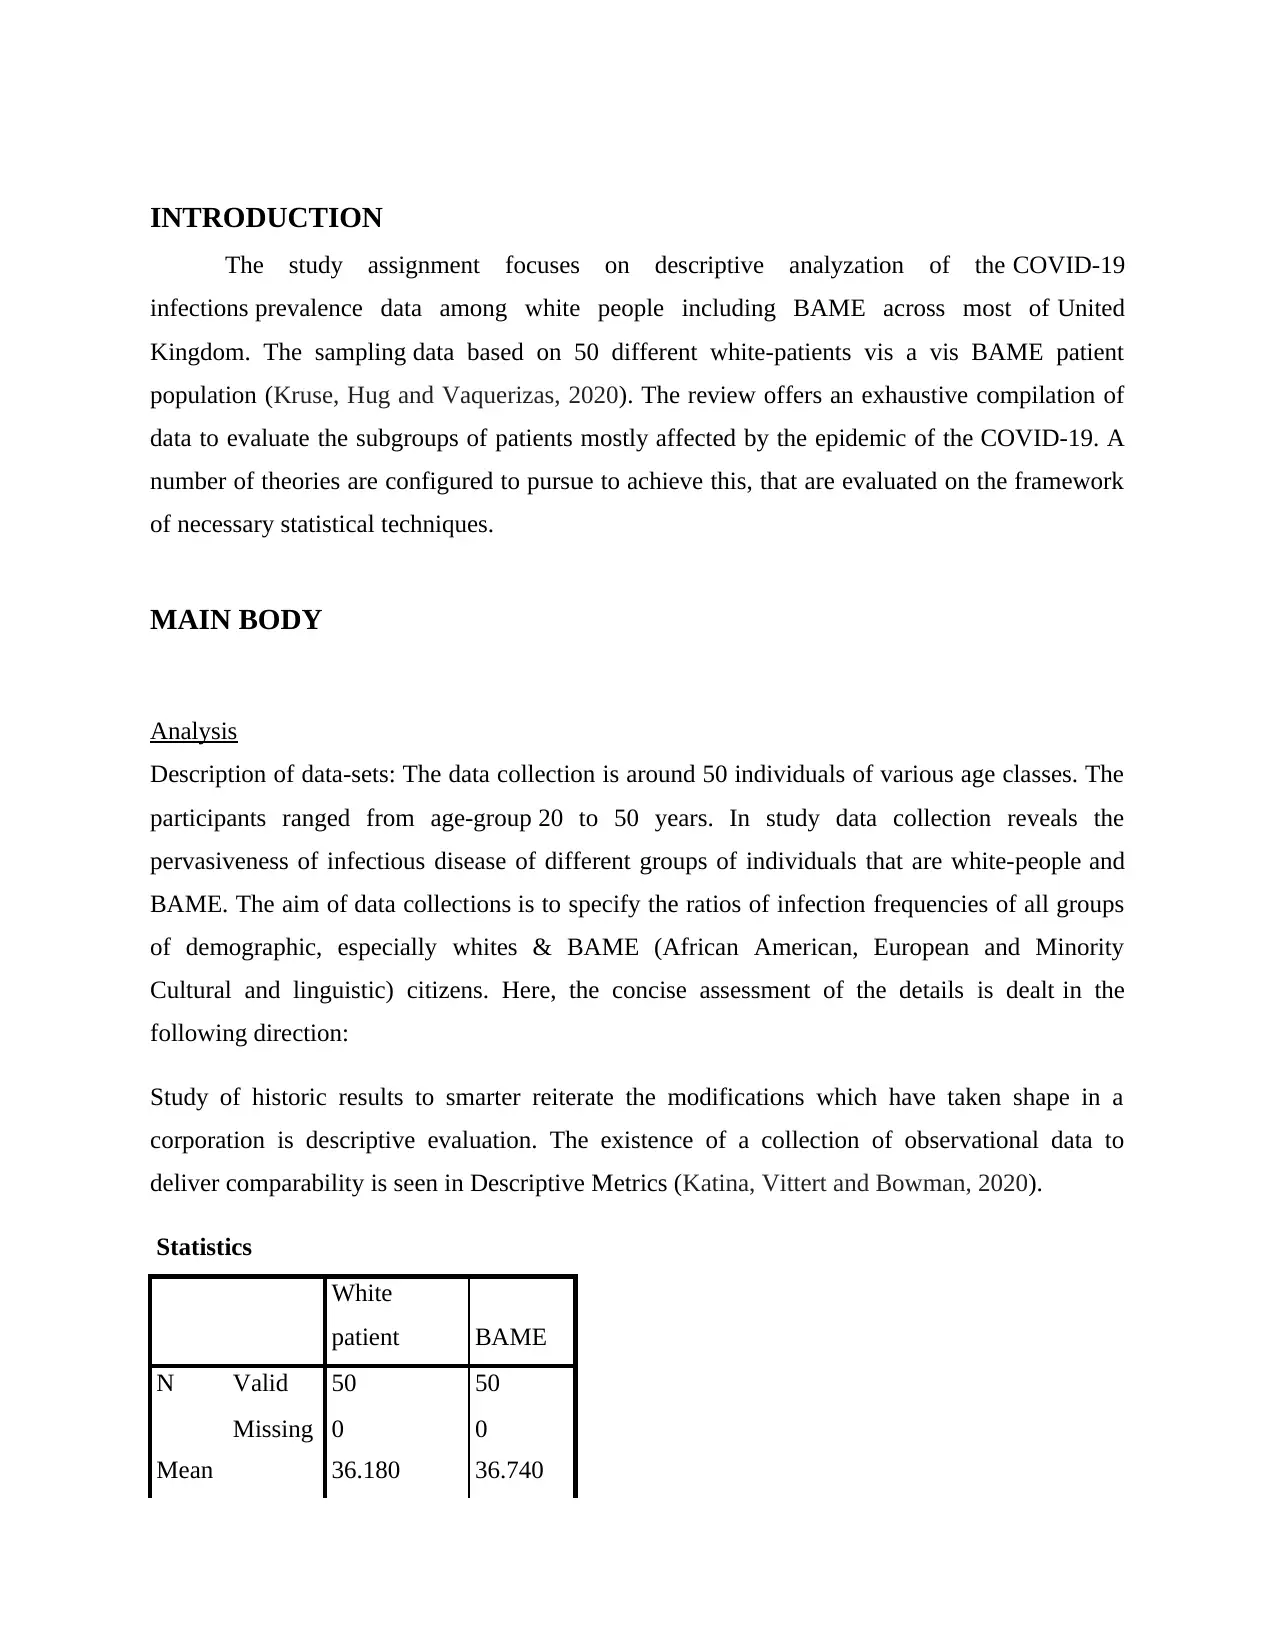
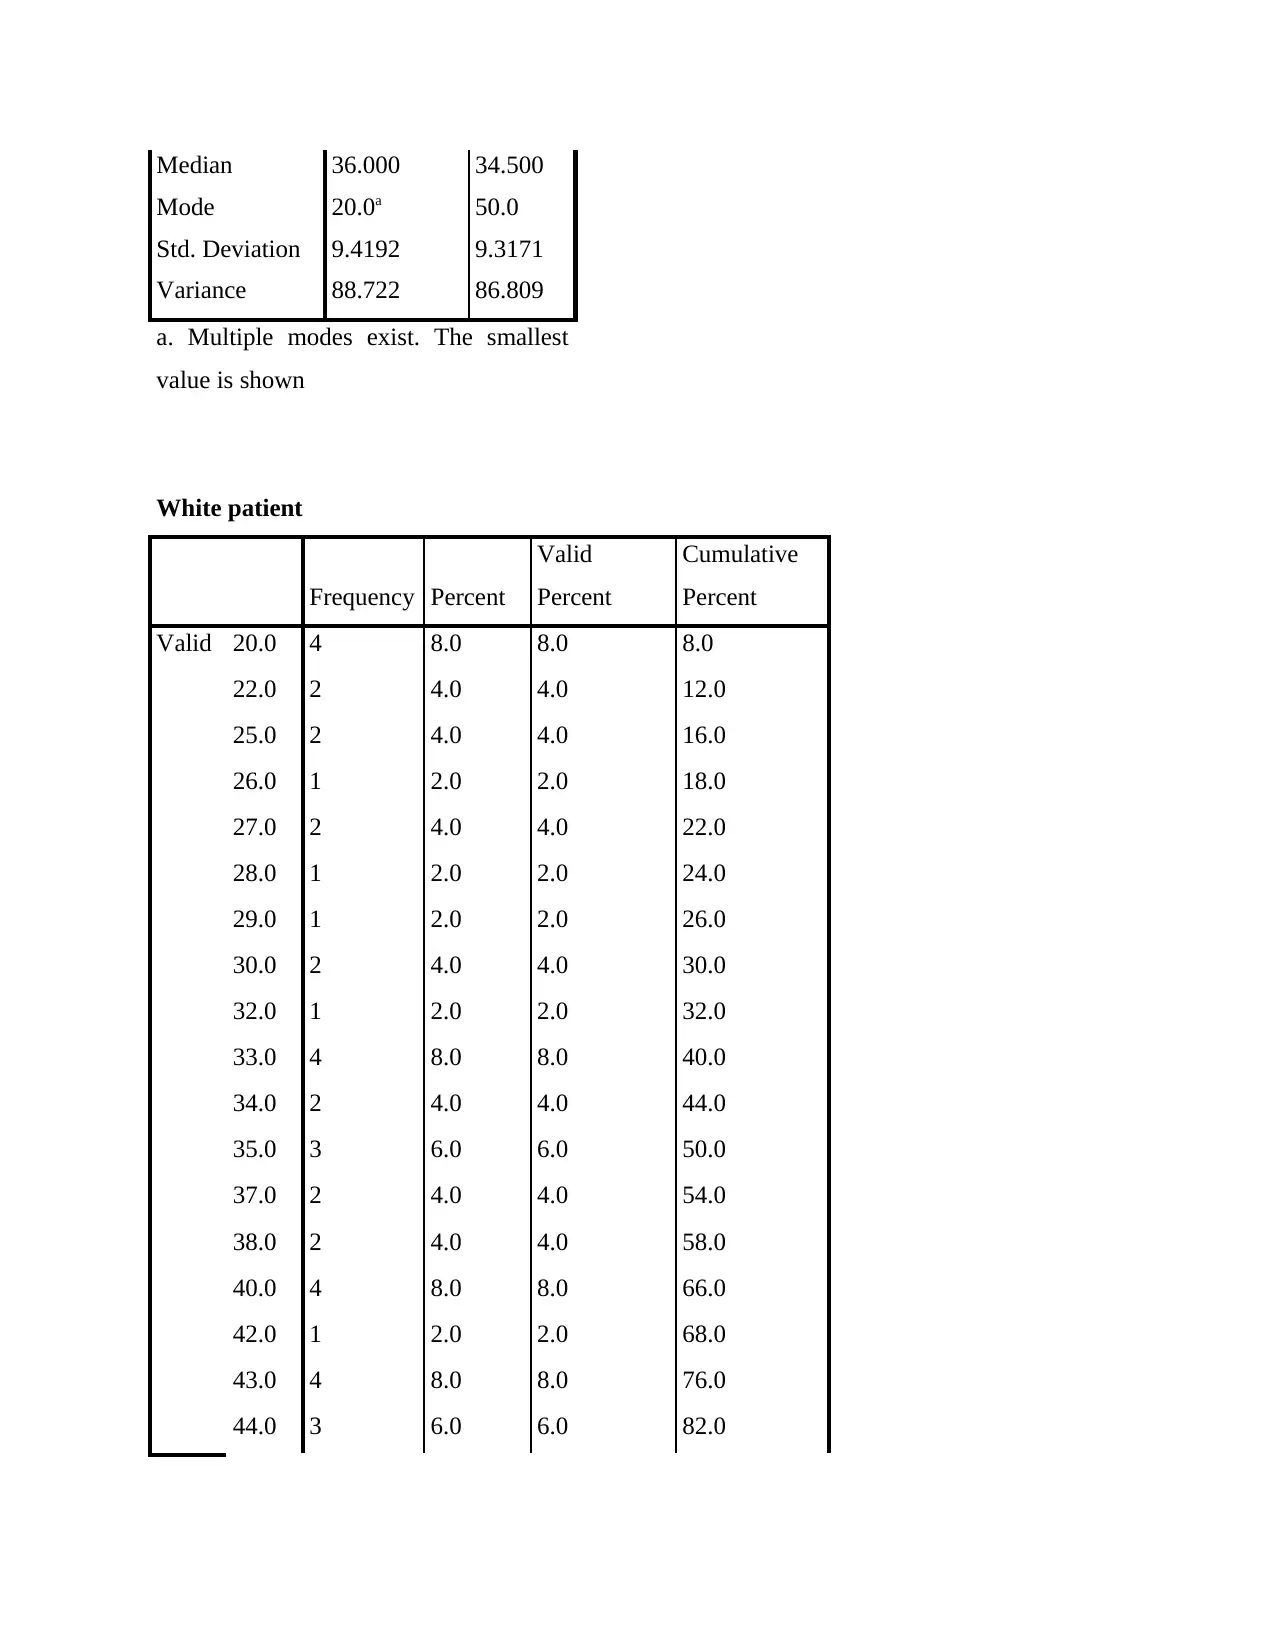
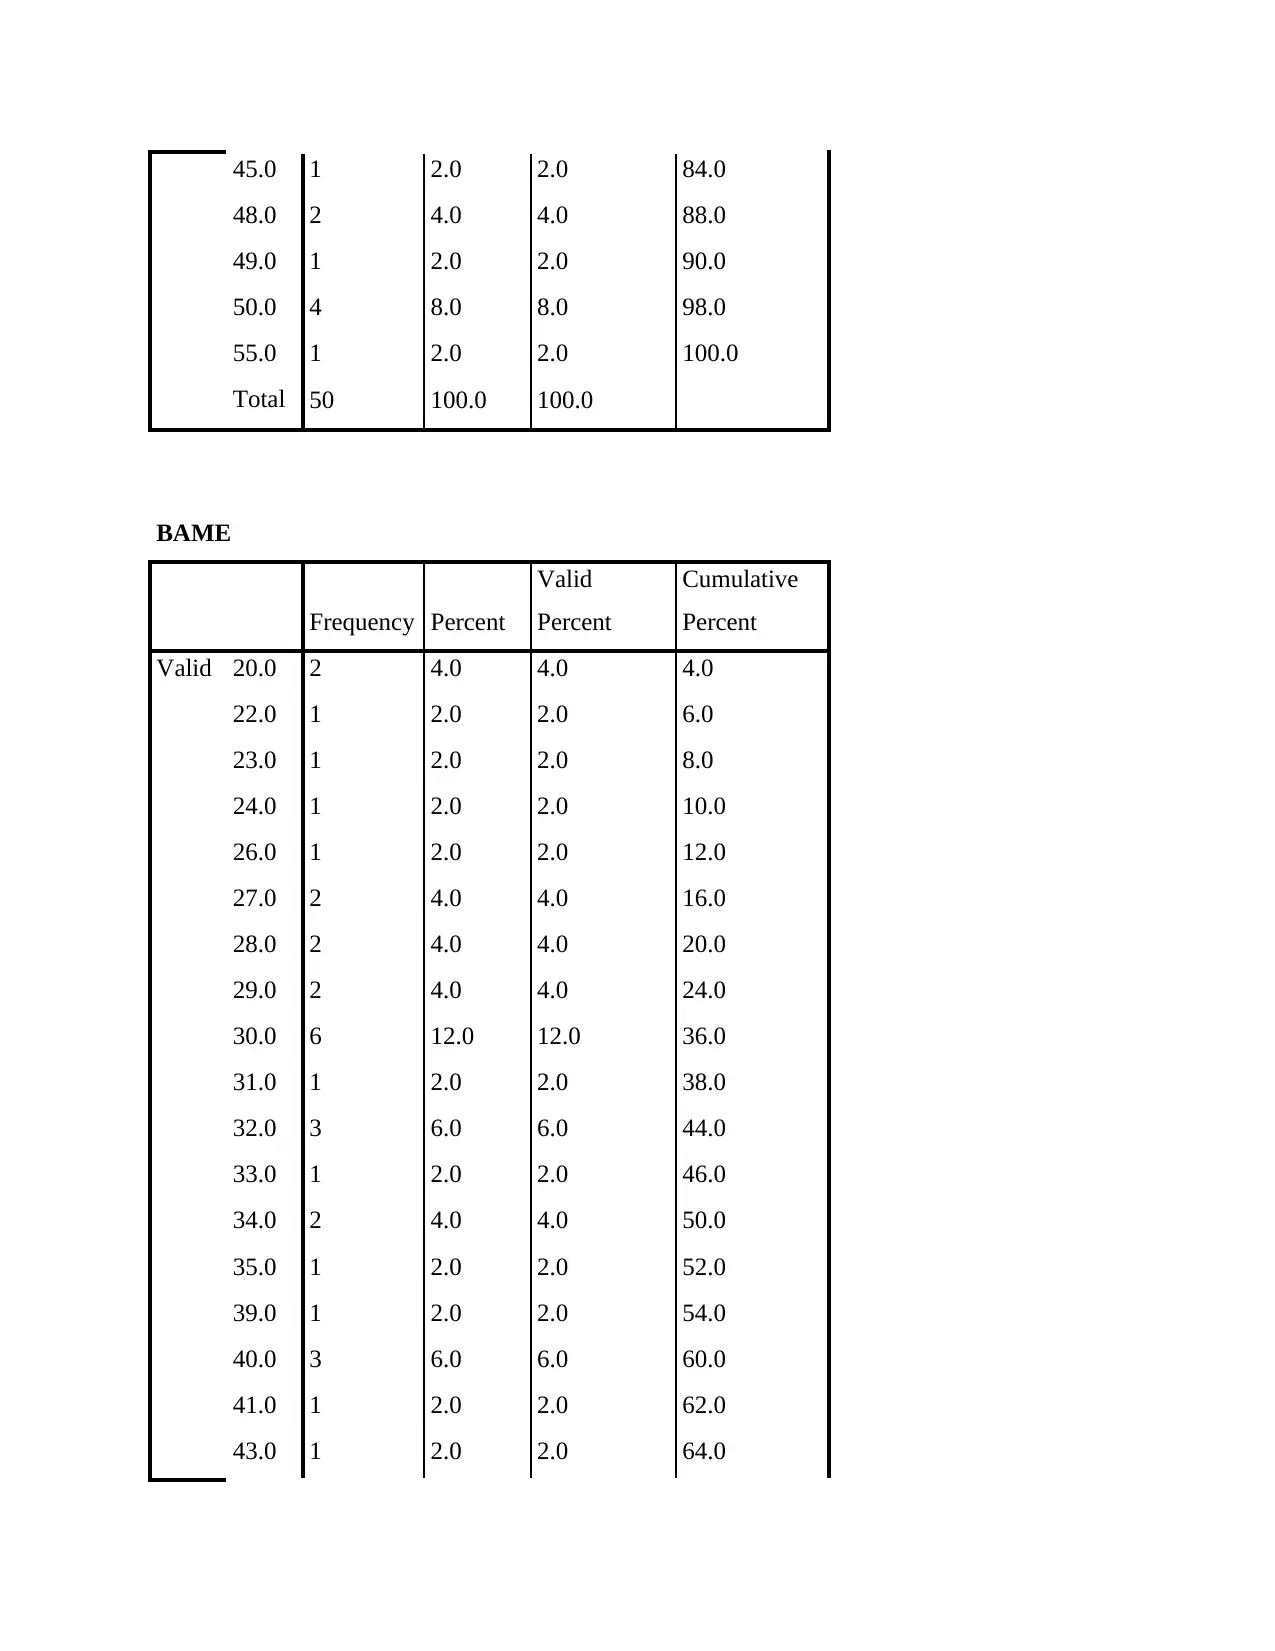
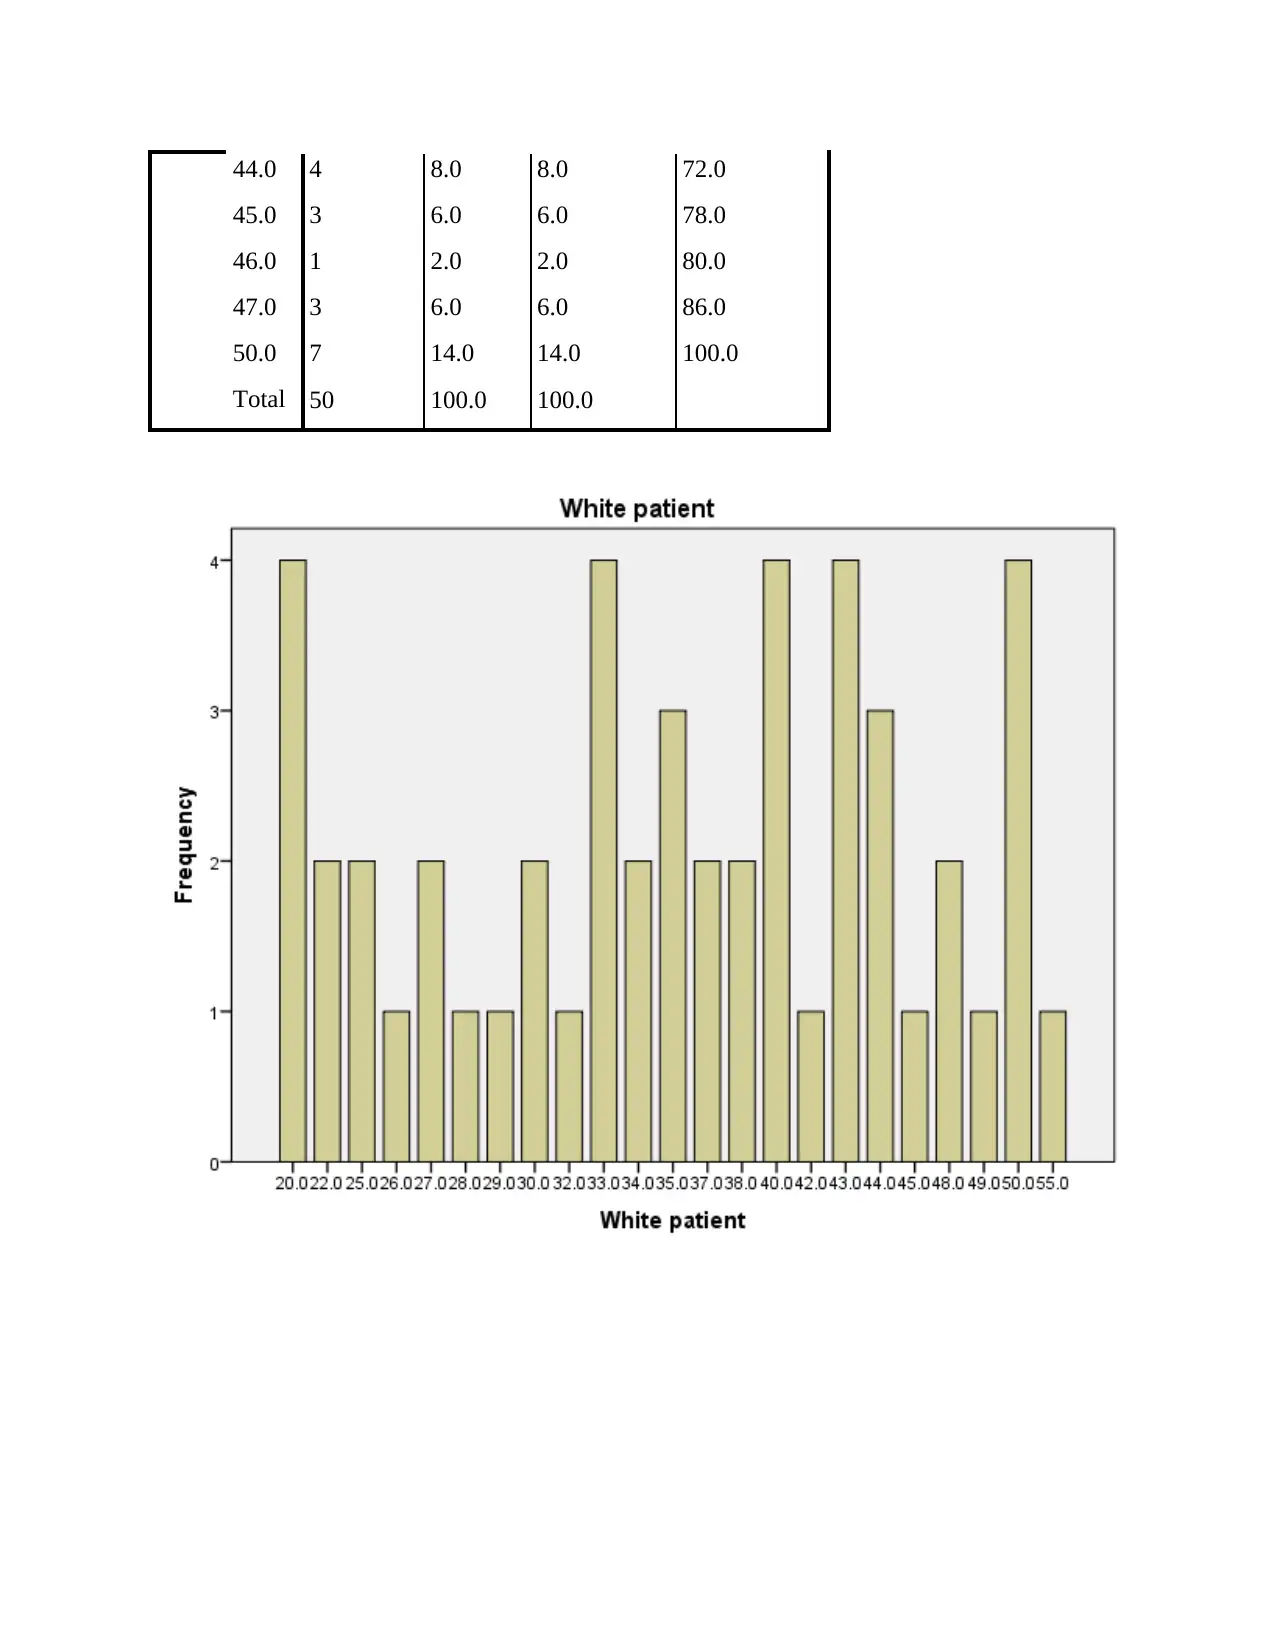
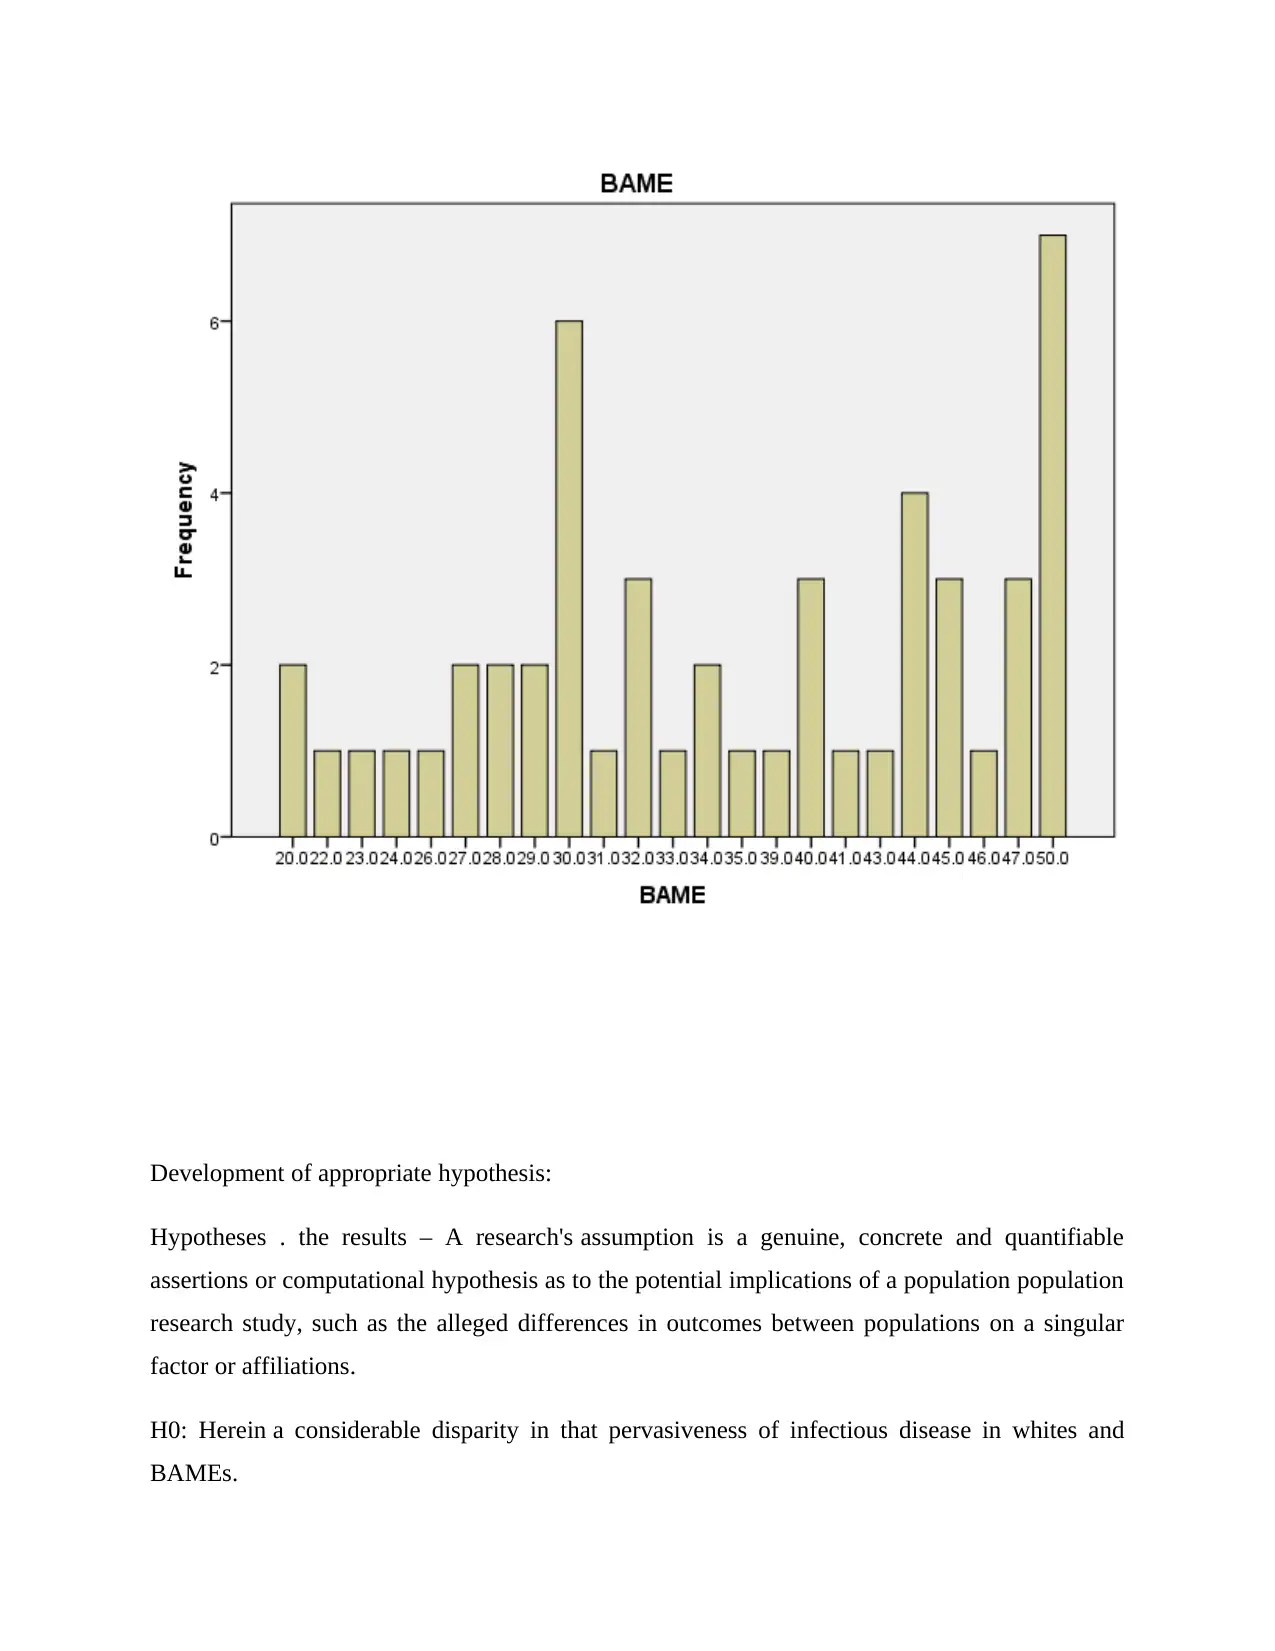
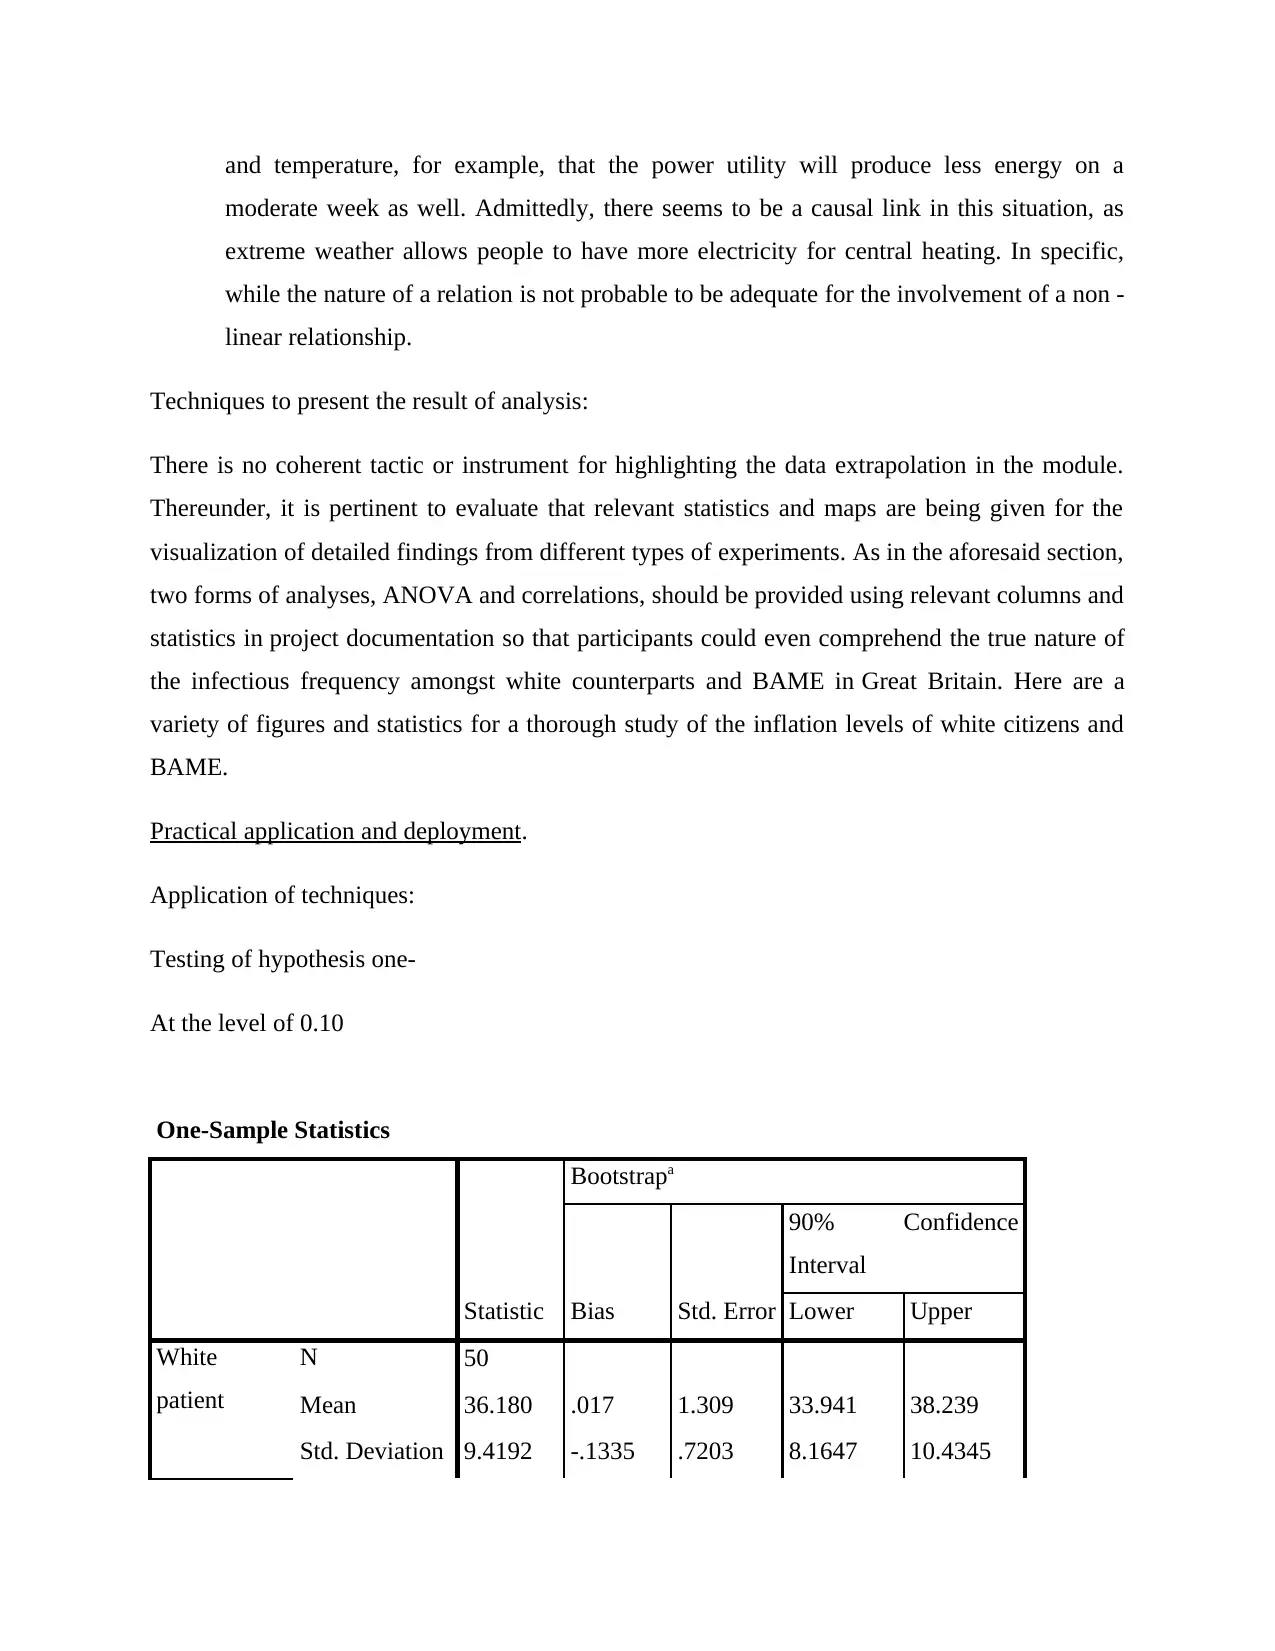
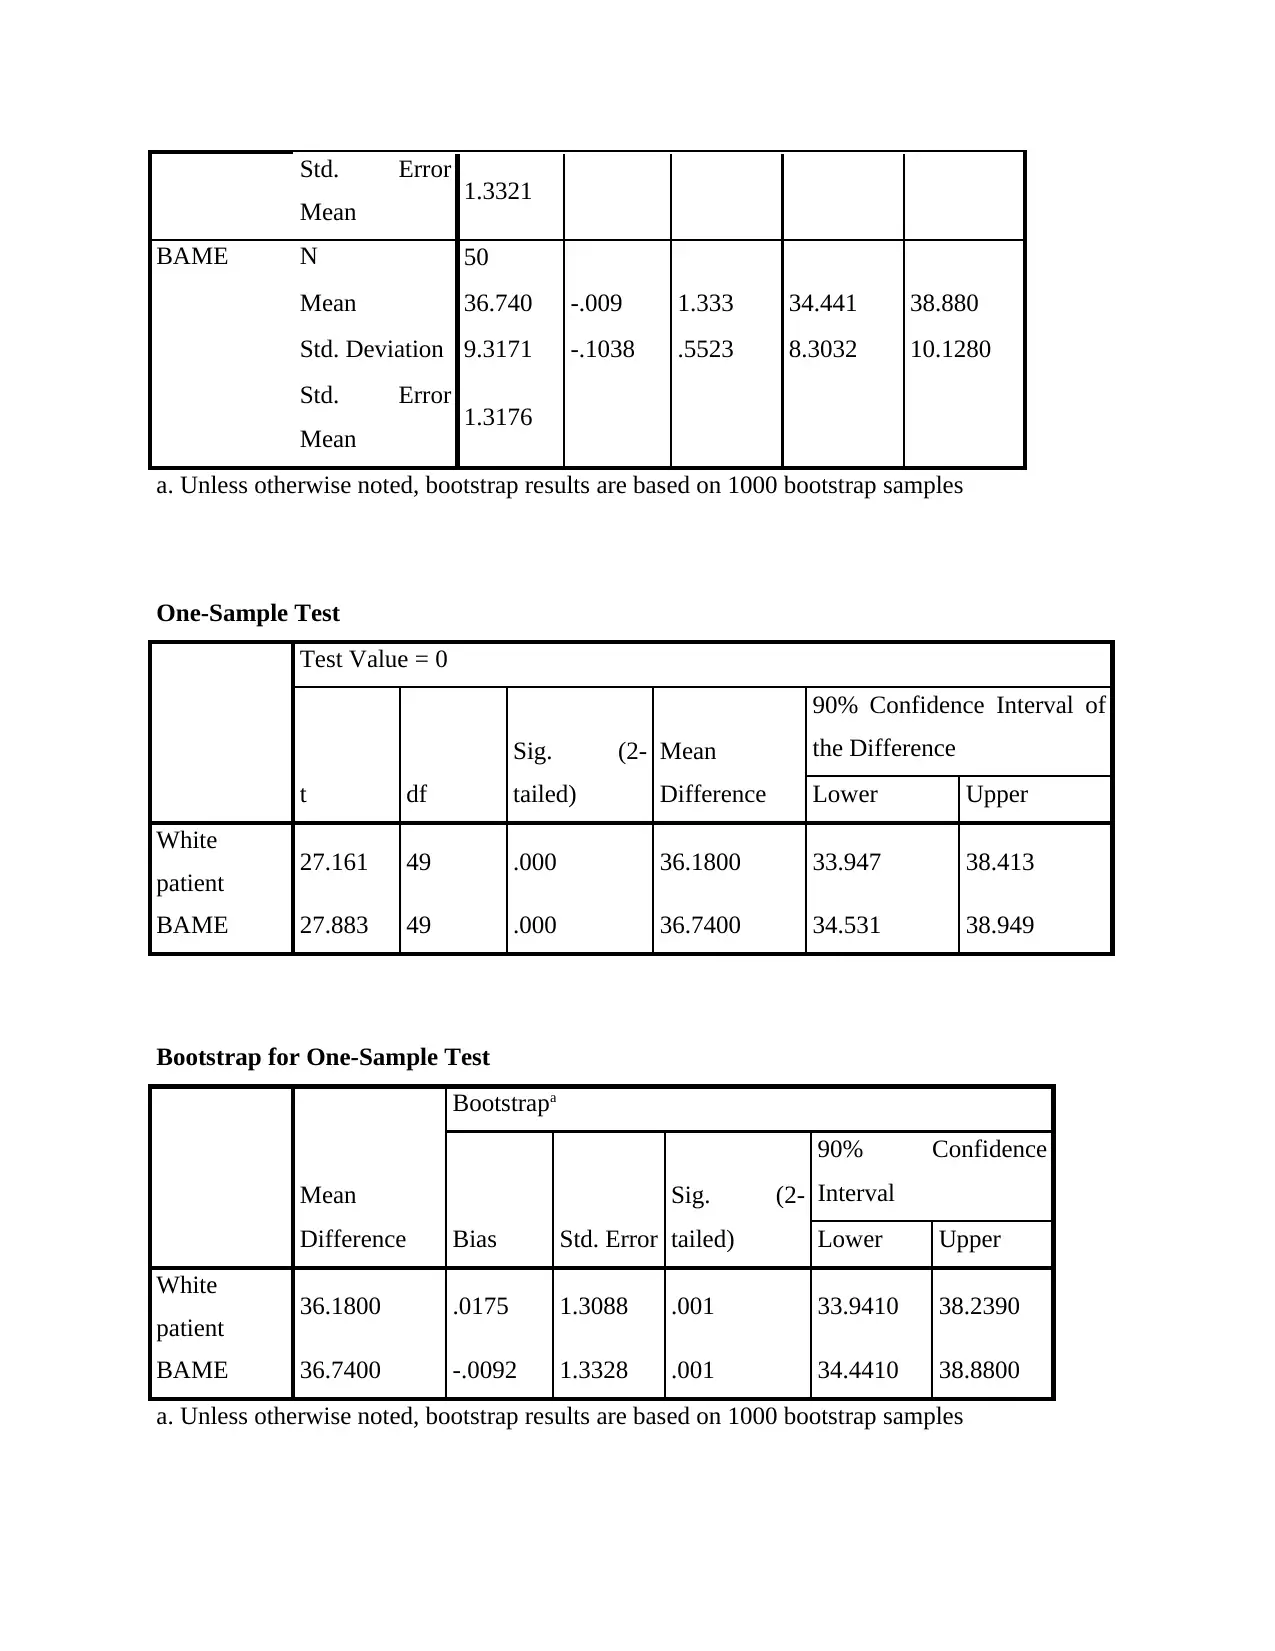
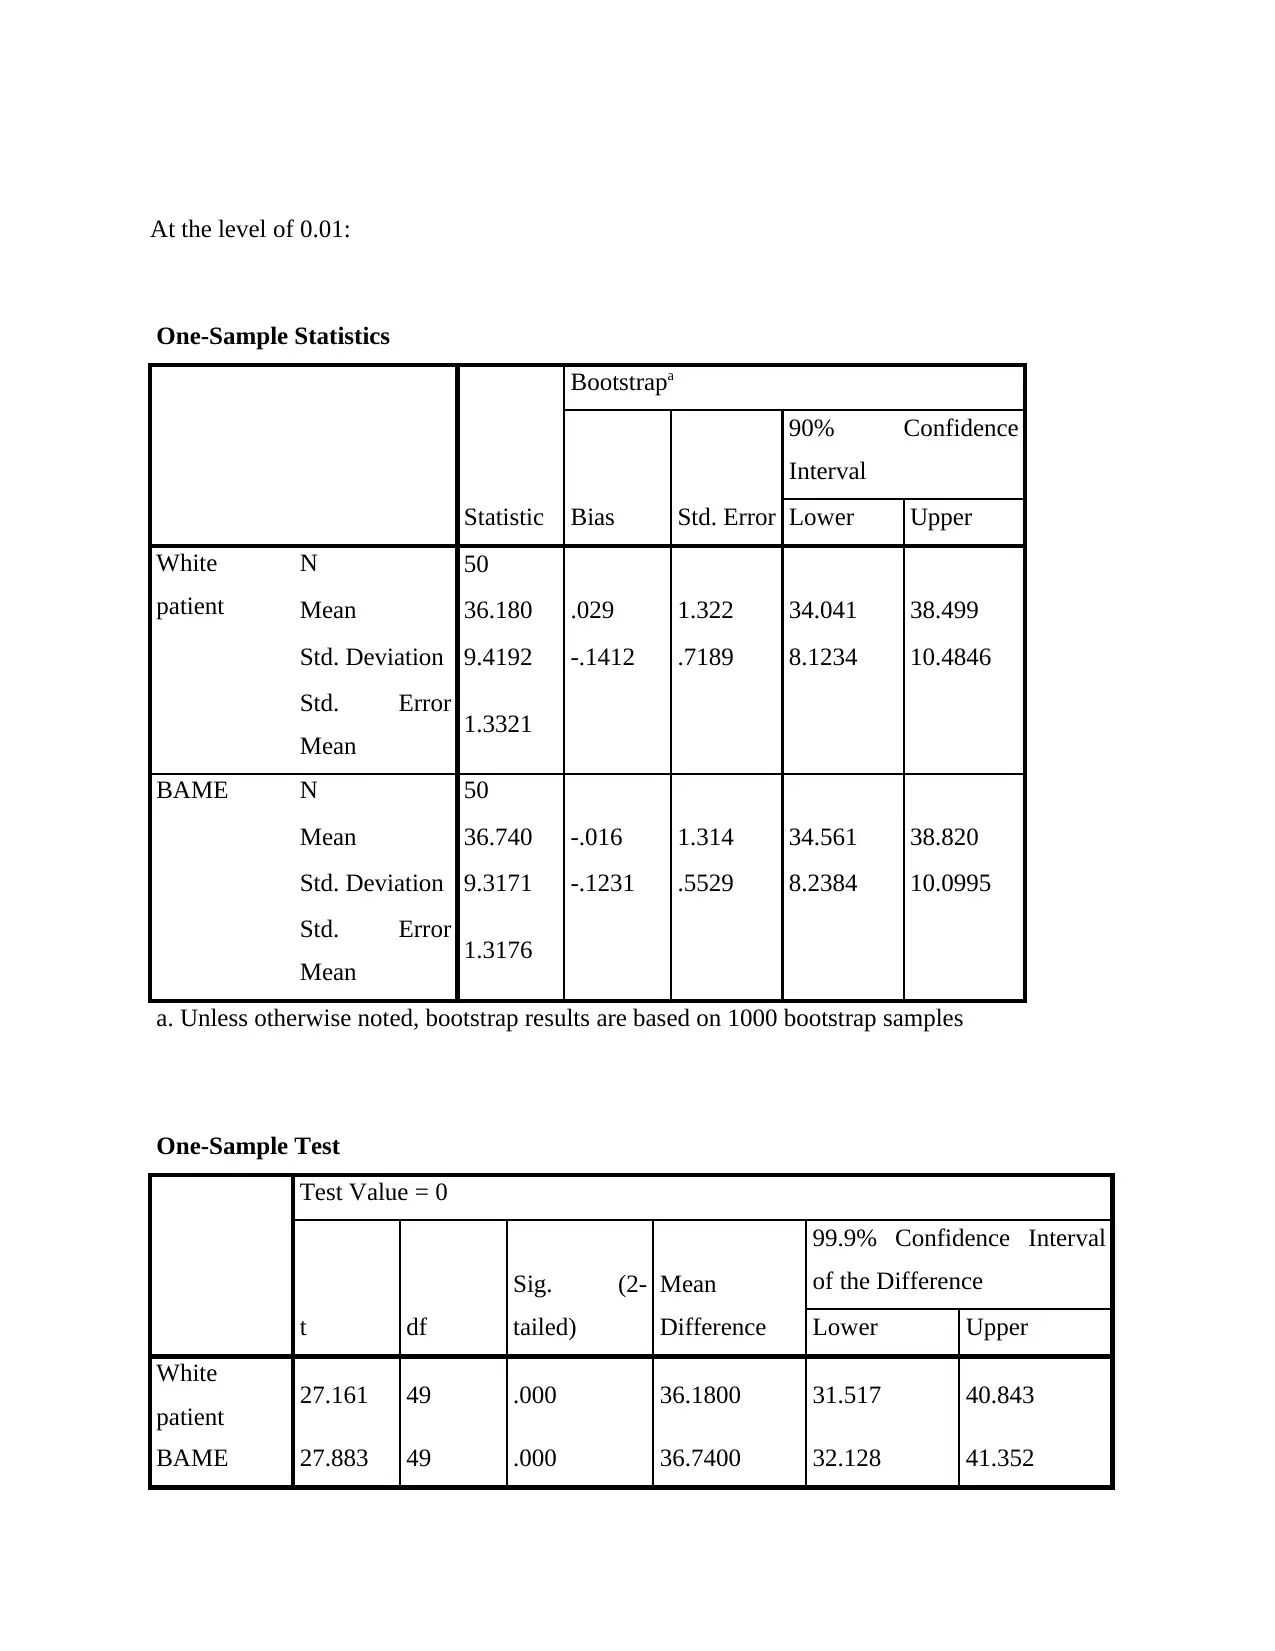
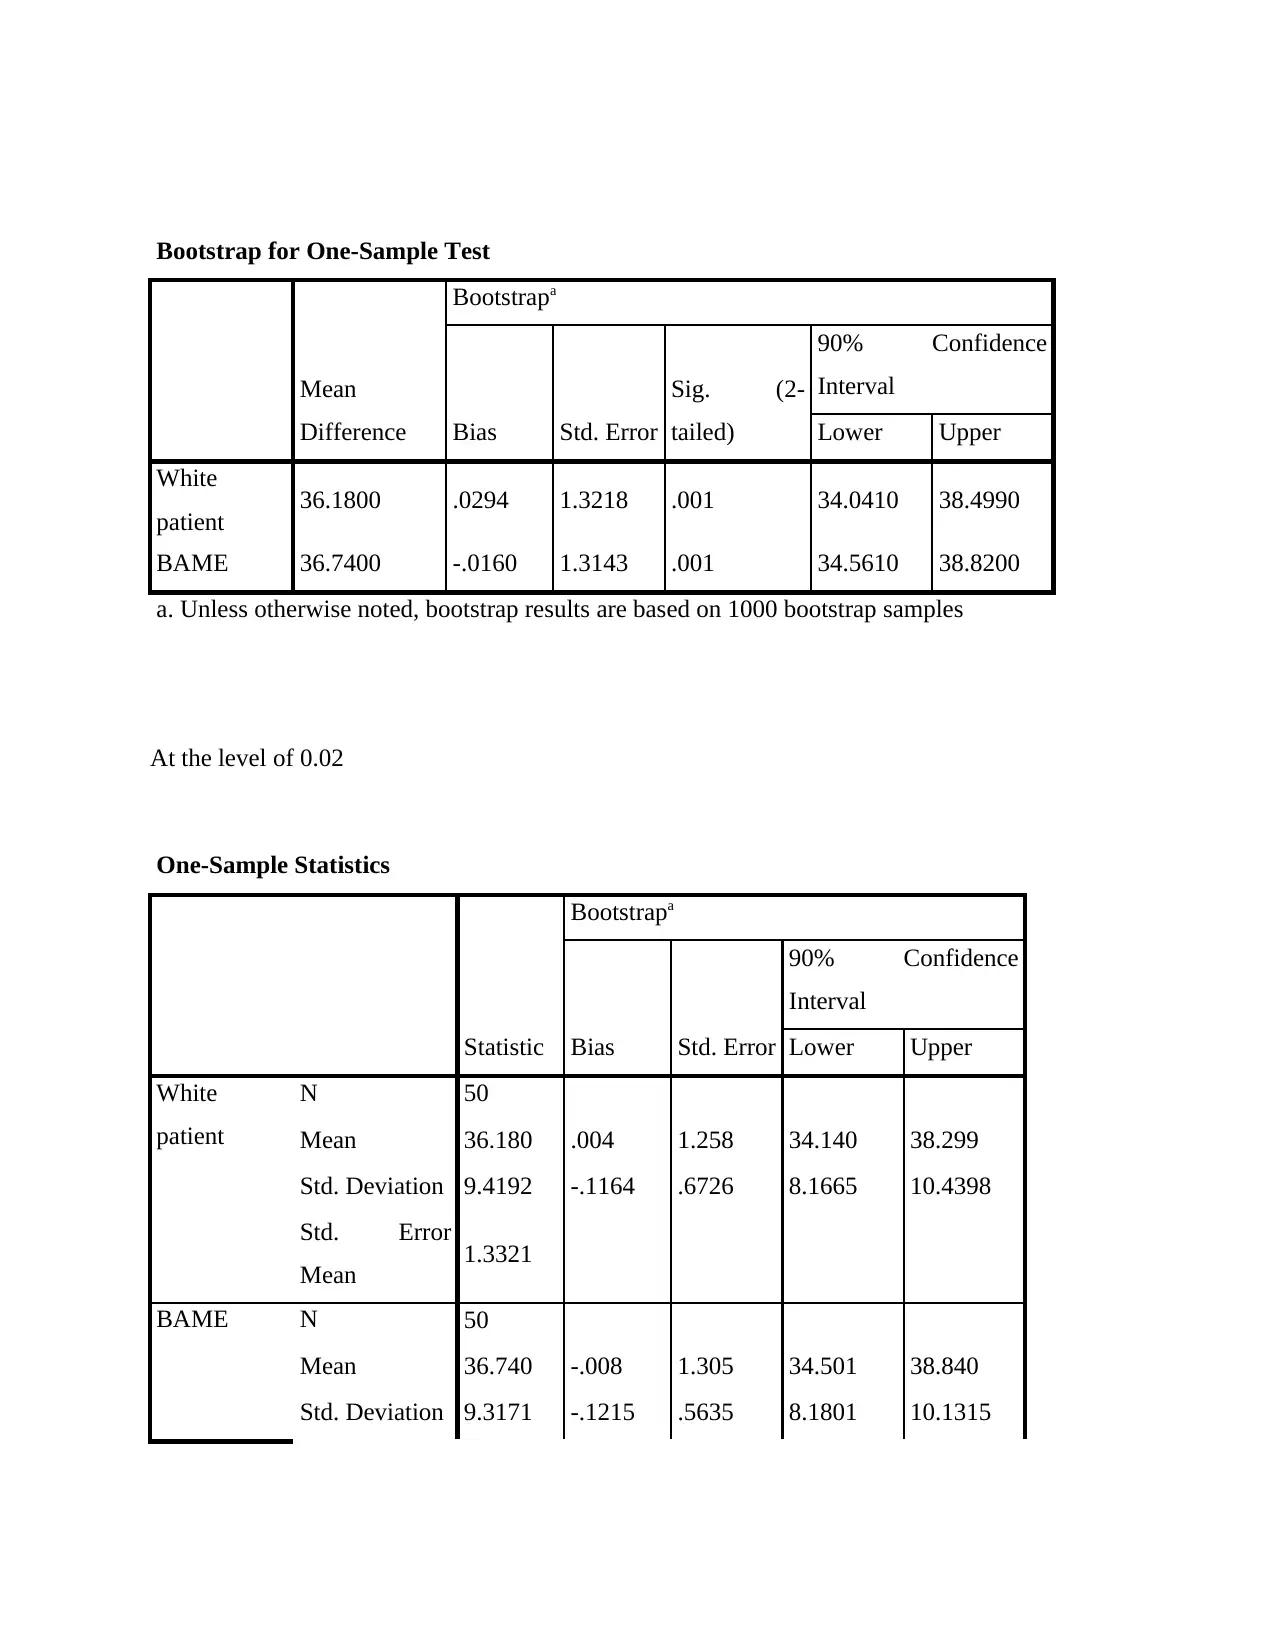
This report presents a data analysis and visualization of COVID-19 infection prevalence among white and BAME populations in the United Kingdom. The study utilizes a dataset of 50 individuals, comparing infection rates between the two groups. The analysis includes descriptive statistics, hypothesis formulation, and the application of statistical techniques such as one-sample t-tests and correlation analysis. The findings are presented with relevant tables and figures to illustrate the infection frequencies. The report tests two hypotheses: one regarding the difference in infection prevalence between the groups and another concerning the correlation between the prevalence in whites and BAME. The results indicate a significant difference in infection prevalence and a compelling relationship between the two groups. The report concludes by summarizing the key findings and implications of the analysis.

Data Analysis and Visualization
Paraphrase This Document
Need a fresh take? Get an instant paraphrase of this document with our AI Paraphraser

Contents
INTRODUCTION.......................................................................................................................................3
MAIN BODY..............................................................................................................................................3
Analysis...................................................................................................................................................3
Practical application and deployment......................................................................................................9
CONCLUSION.........................................................................................................................................15
REFERENCES..........................................................................................................................................16

INTRODUCTION
The study assignment focuses on descriptive analyzation of the COVID-19
infections prevalence data among white people including BAME across most of United
Kingdom. The sampling data based on 50 different white-patients vis a vis BAME patient
population (Kruse, Hug and Vaquerizas, 2020). The review offers an exhaustive compilation of
data to evaluate the subgroups of patients mostly affected by the epidemic of the COVID-19. A
number of theories are configured to pursue to achieve this, that are evaluated on the framework
of necessary statistical techniques.
MAIN BODY
Analysis
Description of data-sets: The data collection is around 50 individuals of various age classes. The
participants ranged from age-group 20 to 50 years. In study data collection reveals the
pervasiveness of infectious disease of different groups of individuals that are white-people and
BAME. The aim of data collections is to specify the ratios of infection frequencies of all groups
of demographic, especially whites & BAME (African American, European and Minority
Cultural and linguistic) citizens. Here, the concise assessment of the details is dealt in the
following direction:
Study of historic results to smarter reiterate the modifications which have taken shape in a
corporation is descriptive evaluation. The existence of a collection of observational data to
deliver comparability is seen in Descriptive Metrics (Katina, Vittert and Bowman, 2020).
Statistics
White
patient BAME
N Valid 50 50
Missing 0 0
Mean 36.180 36.740
⊘ This is a preview!⊘
Do you want full access?
Subscribe today to unlock all pages.

Trusted by 1+ million students worldwide

Median 36.000 34.500
Mode 20.0a 50.0
Std. Deviation 9.4192 9.3171
Variance 88.722 86.809
a. Multiple modes exist. The smallest
value is shown
White patient
Frequency Percent
Valid
Percent
Cumulative
Percent
Valid 20.0 4 8.0 8.0 8.0
22.0 2 4.0 4.0 12.0
25.0 2 4.0 4.0 16.0
26.0 1 2.0 2.0 18.0
27.0 2 4.0 4.0 22.0
28.0 1 2.0 2.0 24.0
29.0 1 2.0 2.0 26.0
30.0 2 4.0 4.0 30.0
32.0 1 2.0 2.0 32.0
33.0 4 8.0 8.0 40.0
34.0 2 4.0 4.0 44.0
35.0 3 6.0 6.0 50.0
37.0 2 4.0 4.0 54.0
38.0 2 4.0 4.0 58.0
40.0 4 8.0 8.0 66.0
42.0 1 2.0 2.0 68.0
43.0 4 8.0 8.0 76.0
44.0 3 6.0 6.0 82.0
Paraphrase This Document
Need a fresh take? Get an instant paraphrase of this document with our AI Paraphraser

45.0 1 2.0 2.0 84.0
48.0 2 4.0 4.0 88.0
49.0 1 2.0 2.0 90.0
50.0 4 8.0 8.0 98.0
55.0 1 2.0 2.0 100.0
Total 50 100.0 100.0
BAME
Frequency Percent
Valid
Percent
Cumulative
Percent
Valid 20.0 2 4.0 4.0 4.0
22.0 1 2.0 2.0 6.0
23.0 1 2.0 2.0 8.0
24.0 1 2.0 2.0 10.0
26.0 1 2.0 2.0 12.0
27.0 2 4.0 4.0 16.0
28.0 2 4.0 4.0 20.0
29.0 2 4.0 4.0 24.0
30.0 6 12.0 12.0 36.0
31.0 1 2.0 2.0 38.0
32.0 3 6.0 6.0 44.0
33.0 1 2.0 2.0 46.0
34.0 2 4.0 4.0 50.0
35.0 1 2.0 2.0 52.0
39.0 1 2.0 2.0 54.0
40.0 3 6.0 6.0 60.0
41.0 1 2.0 2.0 62.0
43.0 1 2.0 2.0 64.0

44.0 4 8.0 8.0 72.0
45.0 3 6.0 6.0 78.0
46.0 1 2.0 2.0 80.0
47.0 3 6.0 6.0 86.0
50.0 7 14.0 14.0 100.0
Total 50 100.0 100.0
45.0 3 6.0 6.0 78.0
46.0 1 2.0 2.0 80.0
47.0 3 6.0 6.0 86.0
50.0 7 14.0 14.0 100.0
Total 50 100.0 100.0
⊘ This is a preview!⊘
Do you want full access?
Subscribe today to unlock all pages.

Trusted by 1+ million students worldwide

Development of appropriate hypothesis:
Hypotheses . the results – A research's assumption is a genuine, concrete and quantifiable
assertions or computational hypothesis as to the potential implications of a population population
research study, such as the alleged differences in outcomes between populations on a singular
factor or affiliations.
H0: Herein a considerable disparity in that pervasiveness of infectious disease in whites and
BAMEs.
Paraphrase This Document
Need a fresh take? Get an instant paraphrase of this document with our AI Paraphraser

H1: Herein, no substantial variation in the prevalence rate of infectious disease in whites and
BAME.
H0: Here a direct connection between the prevalence of infectious disease in whites with BAME.
H1: Herein, no correlation between the prevalence of disease in whites with BAME.
Techniques to perform the analysis:
There exist quite a multitude of methodologies and practises for having conducted an
assessment, and indeed ANOVA test has been one of worthwhile instrument for assessing a
considerable variability in a series of measurements. Apart from this, the cause and effect
relationship study is also an integral technique for gauging the connection between the data
compilation of whites and BAME.
ï‚· One sample T-test: in one-sample t-testing is employed to authenticate if the data
gathered is radically different from some magnitude. Everyone makes claims as to
how here confidence intervals representing μ is attributed to a certain degree of
magnitude M. Even t-test is modern form of descriptive review that is used to determine
whether there is a noticeable discrepancy amongst the independent parameters that could
be applied to such properties. It's being employed if chosen data sets perform as
instructed and could have inexplicable differences, such as with data set recorded as a
function of whipping a dice 75 occasions. A t-test also might use as hypothesis test
method, that compels the testing of group-specific assertion (Yang, Chou and Chen,
2020).
 Correlations—In statistical measurements, any statistically correlations, whether bilateral
or non-reciprocal, between relationship between two quantities or nonparametric data is
affiliation or concentration. Correlation is any simple relationship in the largest possible
context, but it usually corresponds to the magnitude from which a series of specifications
is sequentially related. Correlations are helpful as a mathematical association that can be
distorted in essence can be inferred. Display the association between generating capacity

and temperature, for example, that the power utility will produce less energy on a
moderate week as well. Admittedly, there seems to be a causal link in this situation, as
extreme weather allows people to have more electricity for central heating. In specific,
while the nature of a relation is not probable to be adequate for the involvement of a non -
linear relationship.
Techniques to present the result of analysis:
There is no coherent tactic or instrument for highlighting the data extrapolation in the module.
Thereunder, it is pertinent to evaluate that relevant statistics and maps are being given for the
visualization of detailed findings from different types of experiments. As in the aforesaid section,
two forms of analyses, ANOVA and correlations, should be provided using relevant columns and
statistics in project documentation so that participants could even comprehend the true nature of
the infectious frequency amongst white counterparts and BAME in Great Britain. Here are a
variety of figures and statistics for a thorough study of the inflation levels of white citizens and
BAME.
Practical application and deployment.
Application of techniques:
Testing of hypothesis one-
At the level of 0.10
One-Sample Statistics
Statistic
Bootstrapa
Bias Std. Error
90% Confidence
Interval
Lower Upper
White
patient
N 50
Mean 36.180 .017 1.309 33.941 38.239
Std. Deviation 9.4192 -.1335 .7203 8.1647 10.4345
⊘ This is a preview!⊘
Do you want full access?
Subscribe today to unlock all pages.

Trusted by 1+ million students worldwide

Std. Error
Mean 1.3321
BAME N 50
Mean 36.740 -.009 1.333 34.441 38.880
Std. Deviation 9.3171 -.1038 .5523 8.3032 10.1280
Std. Error
Mean 1.3176
a. Unless otherwise noted, bootstrap results are based on 1000 bootstrap samples
One-Sample Test
Test Value = 0
t df
Sig. (2-
tailed)
Mean
Difference
90% Confidence Interval of
the Difference
Lower Upper
White
patient 27.161 49 .000 36.1800 33.947 38.413
BAME 27.883 49 .000 36.7400 34.531 38.949
Bootstrap for One-Sample Test
Mean
Difference
Bootstrapa
Bias Std. Error
Sig. (2-
tailed)
90% Confidence
Interval
Lower Upper
White
patient 36.1800 .0175 1.3088 .001 33.9410 38.2390
BAME 36.7400 -.0092 1.3328 .001 34.4410 38.8800
a. Unless otherwise noted, bootstrap results are based on 1000 bootstrap samples
Paraphrase This Document
Need a fresh take? Get an instant paraphrase of this document with our AI Paraphraser

At the level of 0.01:
One-Sample Statistics
Statistic
Bootstrapa
Bias Std. Error
90% Confidence
Interval
Lower Upper
White
patient
N 50
Mean 36.180 .029 1.322 34.041 38.499
Std. Deviation 9.4192 -.1412 .7189 8.1234 10.4846
Std. Error
Mean 1.3321
BAME N 50
Mean 36.740 -.016 1.314 34.561 38.820
Std. Deviation 9.3171 -.1231 .5529 8.2384 10.0995
Std. Error
Mean 1.3176
a. Unless otherwise noted, bootstrap results are based on 1000 bootstrap samples
One-Sample Test
Test Value = 0
t df
Sig. (2-
tailed)
Mean
Difference
99.9% Confidence Interval
of the Difference
Lower Upper
White
patient 27.161 49 .000 36.1800 31.517 40.843
BAME 27.883 49 .000 36.7400 32.128 41.352

Bootstrap for One-Sample Test
Mean
Difference
Bootstrapa
Bias Std. Error
Sig. (2-
tailed)
90% Confidence
Interval
Lower Upper
White
patient 36.1800 .0294 1.3218 .001 34.0410 38.4990
BAME 36.7400 -.0160 1.3143 .001 34.5610 38.8200
a. Unless otherwise noted, bootstrap results are based on 1000 bootstrap samples
At the level of 0.02
One-Sample Statistics
Statistic
Bootstrapa
Bias Std. Error
90% Confidence
Interval
Lower Upper
White
patient
N 50
Mean 36.180 .004 1.258 34.140 38.299
Std. Deviation 9.4192 -.1164 .6726 8.1665 10.4398
Std. Error
Mean 1.3321
BAME N 50
Mean 36.740 -.008 1.305 34.501 38.840
Std. Deviation 9.3171 -.1215 .5635 8.1801 10.1315
⊘ This is a preview!⊘
Do you want full access?
Subscribe today to unlock all pages.

Trusted by 1+ million students worldwide
1 out of 16
Related Documents

Your All-in-One AI-Powered Toolkit for Academic Success.
 +13062052269
info@desklib.com
Available 24*7 on WhatsApp / Email
Unlock your academic potential
© 2024  |  Zucol Services PVT LTD  |  All rights reserved.