Evaluating Business Decision Making in Financial Ventures
VerifiedAdded on 2020/06/03
|18
|4769
|35
AI Summary
The student must critically analyze a case study on a startup's initial major funding acquisition, focusing on strategic decision-making elements like stakeholder interactions, ethical issues, and financial implications. This assignment encourages evaluating how these decisions influence the company’s trajectory and advises on best practices in managing financing rounds, with an emphasis on balancing investor demands, cost management, and long-term goals.
Business Decision Making
Paraphrase This Document
Need a fresh take? Get an instant paraphrase of this document with our AI Paraphraser
Table of Contents
INTRODUCTION...........................................................................................................................1
TASK 1............................................................................................................................................1
1.1 Creation of plan for collecting primary and secondary data.................................................1
1.2 Survey methodology and sample frame used........................................................................2
1.3 Designing of questionnaire...................................................................................................2
2.1 Creation of information ........................................................................................................4
2.2 Evaluation of measure of central tendency...........................................................................4
2.3 Calculation of measure of dispersion....................................................................................5
2.4 Determination of quartile and correlation coefficient...........................................................6
TASK 2............................................................................................................................................7
3.1 Creation of graphs and charts................................................................................................7
3.2 Evaluation of trend lines for future forecasting....................................................................9
3.3 Presentation for project.......................................................................................................10
3.4 Presentation of report for management...............................................................................10
TASK 3..........................................................................................................................................11
4.1 Use of information processing tool.....................................................................................11
4.2 Project plan for preparing Gantt Chart and Critical path....................................................11
4.3 Financial tools for determining future.................................................................................12
CONCLUSION..............................................................................................................................13
REFERENCES..............................................................................................................................15
INTRODUCTION
Business operations and operating various elements is not an easy thing and taking big
decision for a company consider as one of a most typical factor (Barryand Edgman-Levitan,
2012). Thus, business need to understand this thing properly and management have to take
appropriate judgement for betterment and appropriate work. This project is based on business
decision making related with Murano restaurant whom want to maximise their business
operations with another chain London. For this context, they have to understand various
customers taste and preferences so that better and appropriate judgement making become
possible. This project includes collection and use of primary and secondary data as a decision
making tool and its creation for determine various aspects and elements properly. Along with
this by applying relevant statistical tool, business decision making become easy as such data
need to get present by various graphs and charts.
TASK 1
1.1 Creation of plan for collecting primary and secondary data
Collection of data means to collect information from public and arrive at a particular
decision. In this case Murano wants to open open new hotel chain in London. As hotel is a place
which is open for public, so company wants to know public view regarding growth of new hotel.
There should be proper kept in efficient manner so there is no confusion regarding results of
serve. There are two ways to collect information for solving any problem and acquire at a
particular decision. They are- Primary data Secondary data
Primary data: Research under primary data is tailor made. These data are as per the
research of the organisation (Brynjolfsson, Hitt and Kim, 2011). This data is flexible and vary as
per the situation. Limitation of this method is that is expensive and time consuming. If Murano
restaurant apply this method then firstly they have to set sample on the basis of which they come
out with result.
Secondary data: When data is collected by some agency or agents of organisation then it
is secondary data. Mainly this method is used when population size is more. This method
prevents time and cost as comparison to primary data. Sometimes there are chances that data
saved through secondary data is not compatible the need of the organisation. Data opted from the
1
⊘ This is a preview!⊘
Do you want full access?
Subscribe today to unlock all pages.
Trusted by 1+ million students worldwide
secondary research may be non-current which may proof to be wrong for the decision of the
organisation.
Thus, business management need to apply primary data method into business so that they
become able to evaluate various respondent’s opinion properly which enable them in taking
better decision making. Although, Murano always lead to serve best quality products to their
clients and for this context management need to evaluate each and every perspective properly.
1.2 Survey methodology and sample frame used
Sampling design is a framework for the survey. The population of which analysis to be
done is sampling design (Craft, 2013). Murano restaurant has to first analyse the targeted public
to whom they approach. Selected public will be the people who visit hotels frequently and have
taste of different varieties of food.
Questionnaire: Murano can use questionnaire as to know view of public about their new
opening. These days many hotels and restaurants are using this technique. This method is easy to
approach people who visit hotels and motels often.
Social media: Social media is very active method these days. The advantage of social
media is that it is easy to reach and can easily get revert from public. As this method is
impersonal in nature there are chances of ignorance by public.
Survey methodology is a method used for the survey. As per the requirement of situation
survey method is used. After collecting survey there is statistical calculation has been done
which help in getting a decision whether Murano has to open a hotel in London or not or of what
kind. Sample for the survey should be selected as per the requirement of the organisation. While
selecting sample there should not be biases, otherwise it may affect the results of survey.
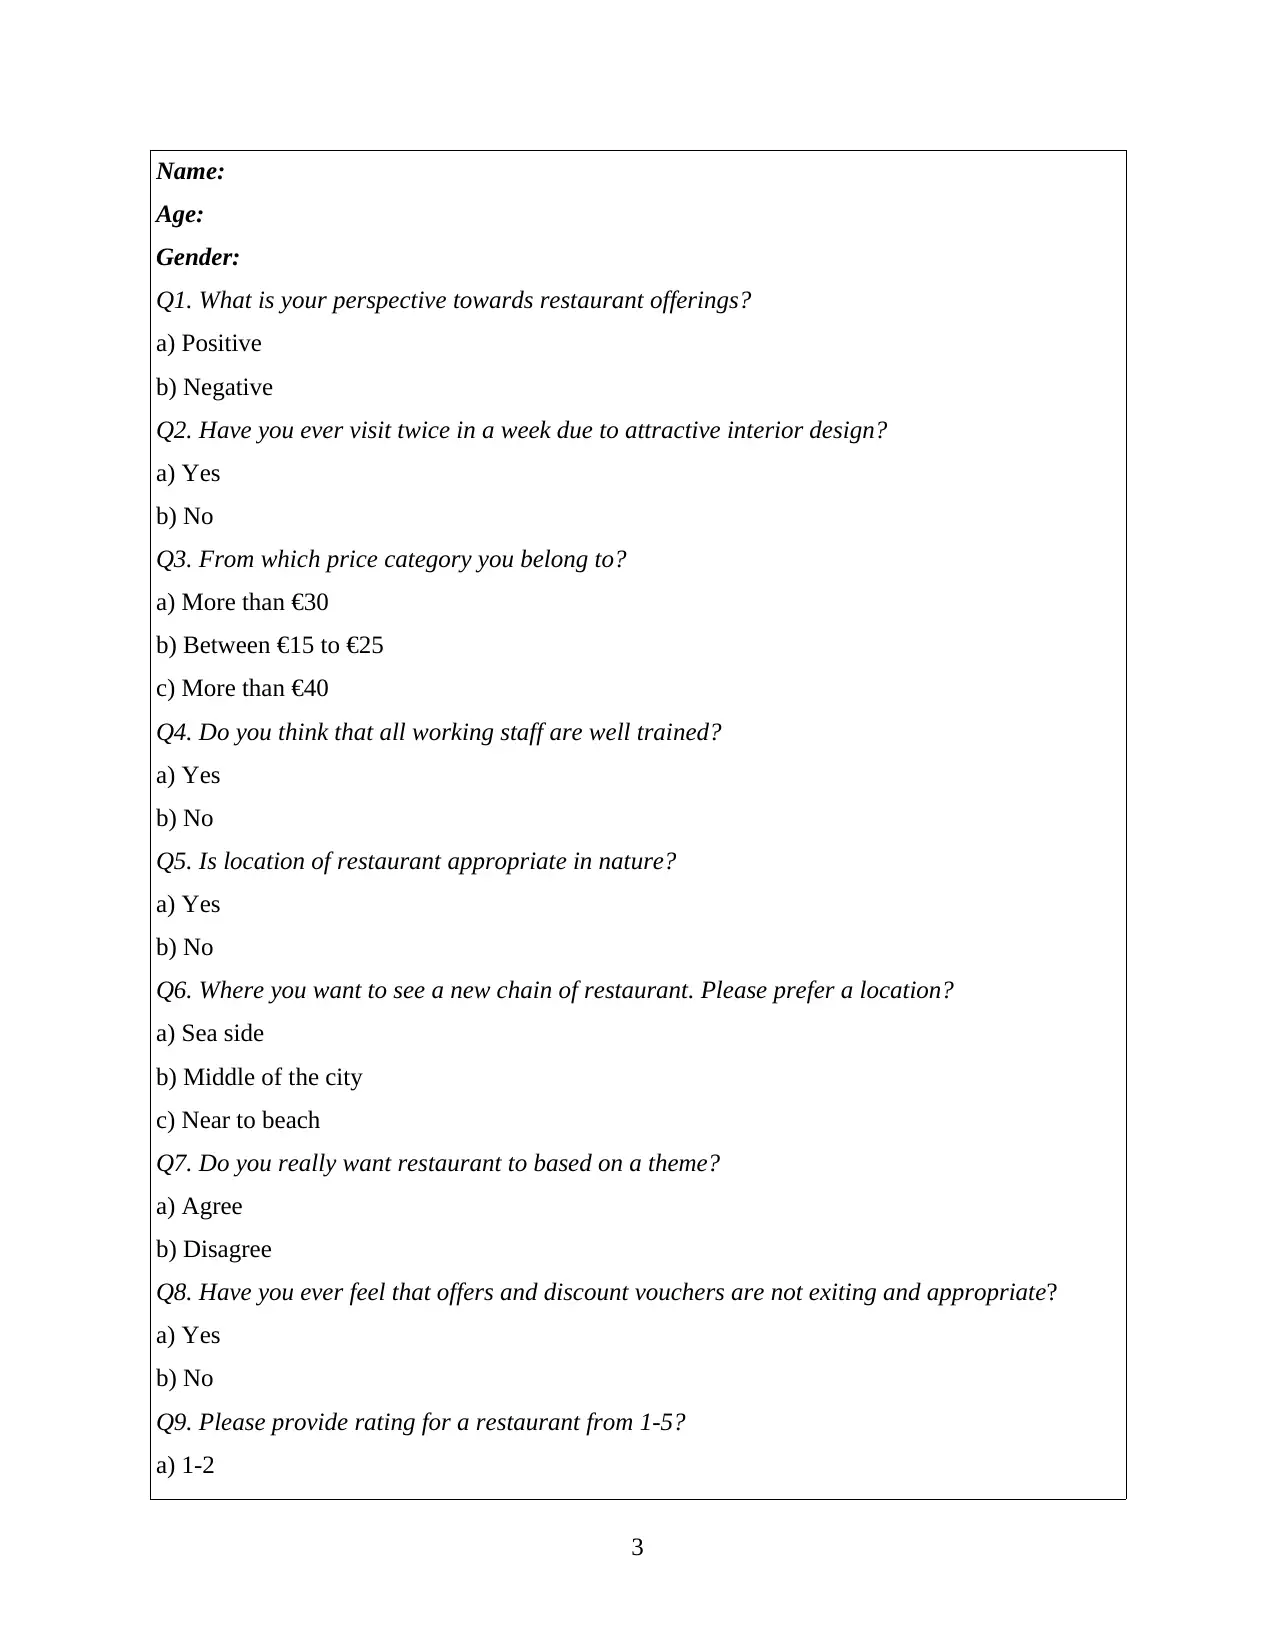
1.3 Designing of questionnaire
Questionnaire is a one of way through which an organisation or a researcher become able
to determine and inspect views of various number of people at one point of course (Cronan and
et. al., 2011). Thus, this method is beneficial for every business organisation whom want to
expand their business operations for making a valid and appropriate comparison between diverse
range of material. Murano can opt this method into business so that they become able to
conclude a beneficial judgement for long term. This questionnaire includes 10 questions which
determine viewpoints of 80 respondents which consider as regular customer of restaurant.
QUESTIONNAIRE
2
organisation.
Thus, business management need to apply primary data method into business so that they
become able to evaluate various respondent’s opinion properly which enable them in taking
better decision making. Although, Murano always lead to serve best quality products to their
clients and for this context management need to evaluate each and every perspective properly.
1.2 Survey methodology and sample frame used
Sampling design is a framework for the survey. The population of which analysis to be
done is sampling design (Craft, 2013). Murano restaurant has to first analyse the targeted public
to whom they approach. Selected public will be the people who visit hotels frequently and have
taste of different varieties of food.
Questionnaire: Murano can use questionnaire as to know view of public about their new
opening. These days many hotels and restaurants are using this technique. This method is easy to
approach people who visit hotels and motels often.
Social media: Social media is very active method these days. The advantage of social
media is that it is easy to reach and can easily get revert from public. As this method is
impersonal in nature there are chances of ignorance by public.
Survey methodology is a method used for the survey. As per the requirement of situation
survey method is used. After collecting survey there is statistical calculation has been done
which help in getting a decision whether Murano has to open a hotel in London or not or of what
kind. Sample for the survey should be selected as per the requirement of the organisation. While
selecting sample there should not be biases, otherwise it may affect the results of survey.
1.3 Designing of questionnaire
Questionnaire is a one of way through which an organisation or a researcher become able
to determine and inspect views of various number of people at one point of course (Cronan and
et. al., 2011). Thus, this method is beneficial for every business organisation whom want to
expand their business operations for making a valid and appropriate comparison between diverse
range of material. Murano can opt this method into business so that they become able to
conclude a beneficial judgement for long term. This questionnaire includes 10 questions which
determine viewpoints of 80 respondents which consider as regular customer of restaurant.
QUESTIONNAIRE
2
Paraphrase This Document
Need a fresh take? Get an instant paraphrase of this document with our AI Paraphraser
Name:
Age:
Gender:
Q1. What is your perspective towards restaurant offerings?
a) Positive
b) Negative
Q2. Have you ever visit twice in a week due to attractive interior design?
a) Yes
b) No
Q3. From which price category you belong to?
a) More than €30
b) Between €15 to €25
c) More than €40
Q4. Do you think that all working staff are well trained?
a) Yes
b) No
Q5. Is location of restaurant appropriate in nature?
a) Yes
b) No
Q6. Where you want to see a new chain of restaurant. Please prefer a location?
a) Sea side
b) Middle of the city
c) Near to beach
Q7. Do you really want restaurant to based on a theme?
a) Agree
b) Disagree
Q8. Have you ever feel that offers and discount vouchers are not exiting and appropriate?
a) Yes
b) No
Q9. Please provide rating for a restaurant from 1-5?
a) 1-2
3
b) 2-3
c) 3-4
d) 4-5
Q10. Any further suggestion or recommendations?
This questionnaire will support to management of a company in order to improve
working condition and take suitable decision for business through which better and appropriate
outcome could be gain. This will support in sustainability of a company in order to which high
rated outcome could be gain. Thus, this data should have to be disseminate in an appropriate
frame so that better judgement gets encourage.
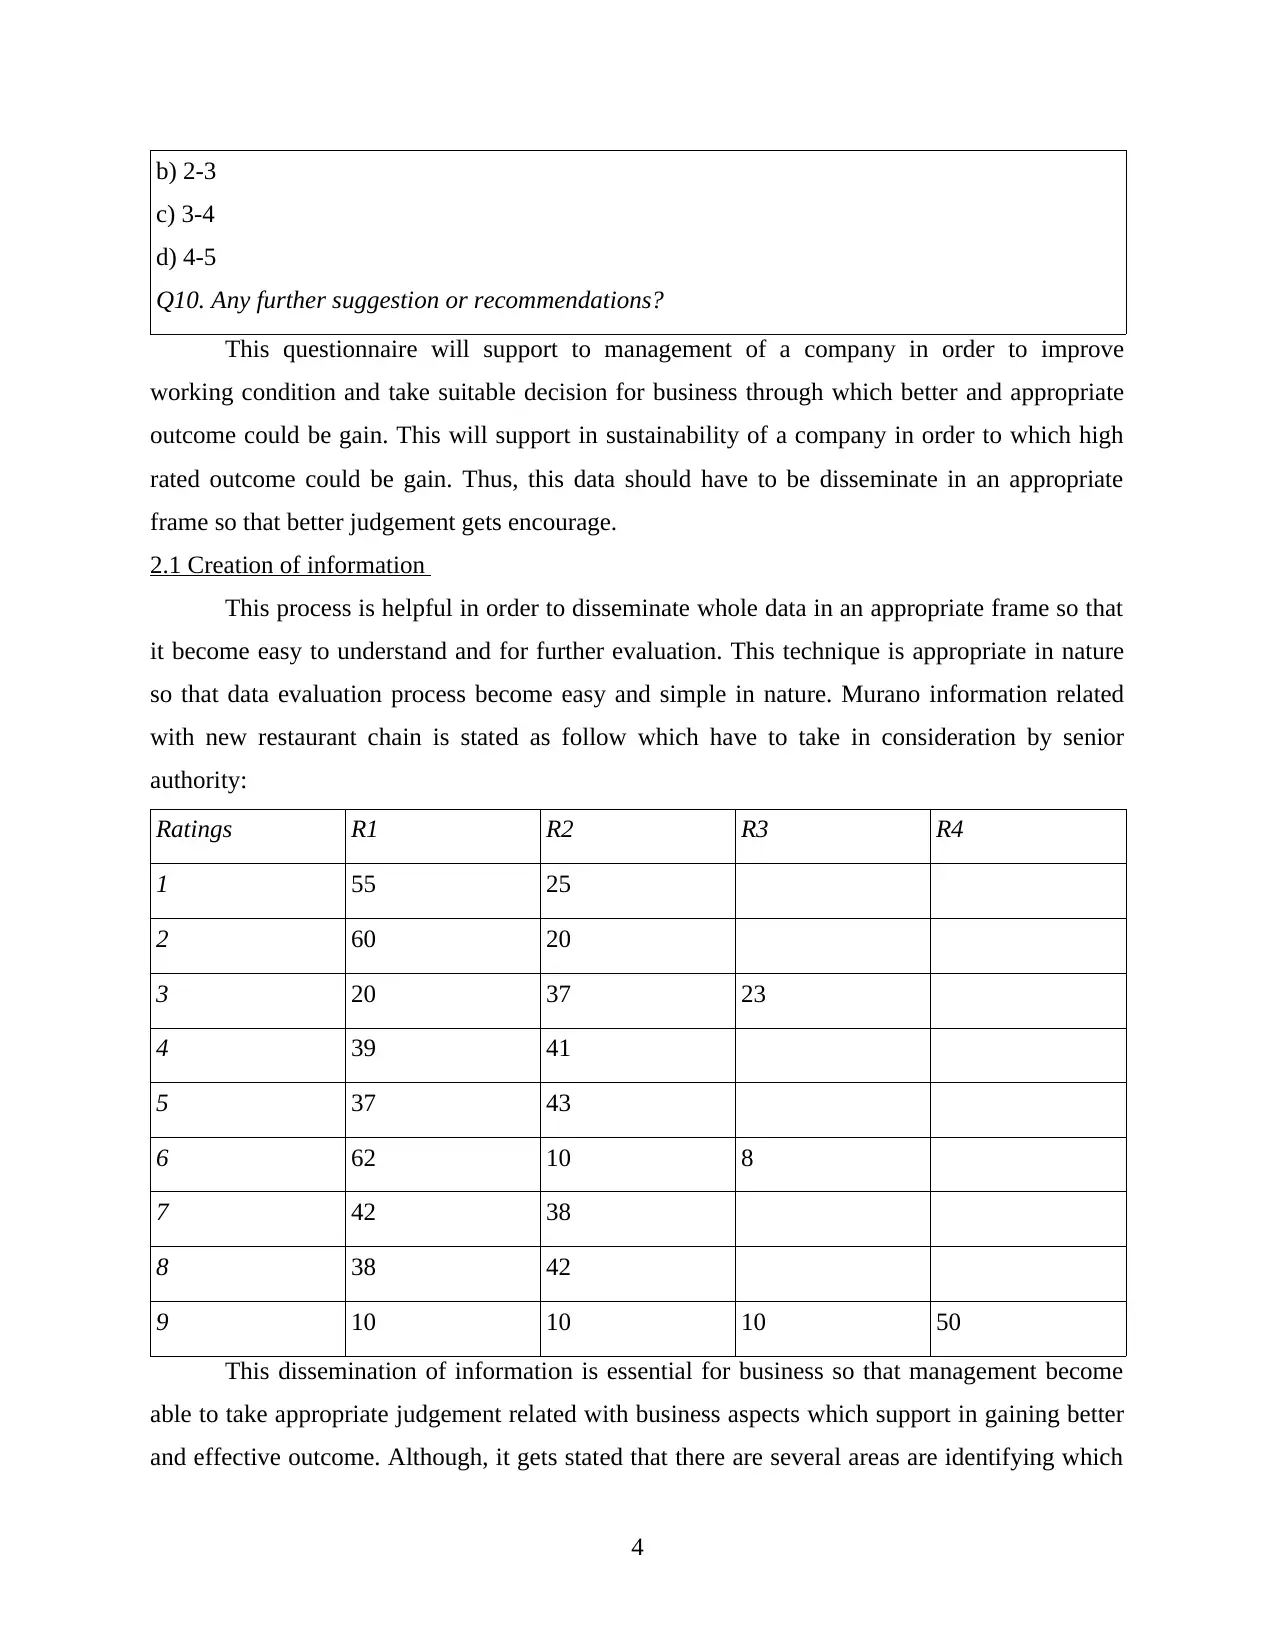
2.1 Creation of information
This process is helpful in order to disseminate whole data in an appropriate frame so that
it become easy to understand and for further evaluation. This technique is appropriate in nature
so that data evaluation process become easy and simple in nature. Murano information related
with new restaurant chain is stated as follow which have to take in consideration by senior
authority:
Ratings R1 R2 R3 R4
1 55 25
2 60 20
3 20 37 23
4 39 41
5 37 43
6 62 10 8
7 42 38
8 38 42
9 10 10 10 50
This dissemination of information is essential for business so that management become
able to take appropriate judgement related with business aspects which support in gaining better
and effective outcome. Although, it gets stated that there are several areas are identifying which
4
c) 3-4
d) 4-5
Q10. Any further suggestion or recommendations?
This questionnaire will support to management of a company in order to improve
working condition and take suitable decision for business through which better and appropriate
outcome could be gain. This will support in sustainability of a company in order to which high
rated outcome could be gain. Thus, this data should have to be disseminate in an appropriate
frame so that better judgement gets encourage.
2.1 Creation of information
This process is helpful in order to disseminate whole data in an appropriate frame so that
it become easy to understand and for further evaluation. This technique is appropriate in nature
so that data evaluation process become easy and simple in nature. Murano information related
with new restaurant chain is stated as follow which have to take in consideration by senior
authority:
Ratings R1 R2 R3 R4
1 55 25
2 60 20
3 20 37 23
4 39 41
5 37 43
6 62 10 8
7 42 38
8 38 42
9 10 10 10 50
This dissemination of information is essential for business so that management become
able to take appropriate judgement related with business aspects which support in gaining better
and effective outcome. Although, it gets stated that there are several areas are identifying which
4
⊘ This is a preview!⊘
Do you want full access?
Subscribe today to unlock all pages.
Trusted by 1+ million students worldwide
need to improve by management in their new restaurant chain which is staff behaviour and have
to start their chain near to seas side their existing location is not appropriate but still customers
prefer it just because of quality of food and services. It also get analyse from this disseminate
data that quality of working is appropriate and high in standard as most number of individual
rated 5 star towards work. This enables in effective and appropriate work so that chances of
suitable and appropriate gains are high in frame. Along with this, restaurant need to be based on
a theme through which many users lead to get attracted. As in modern terms, many users are
attracted towards an organisation so that chances of sustainability get supported in order to
increase profit and growth rate. This analysis signifies that new idea of another outlet chain is not
bad in frame but good as Murano can implement it in a better and suitable manner.
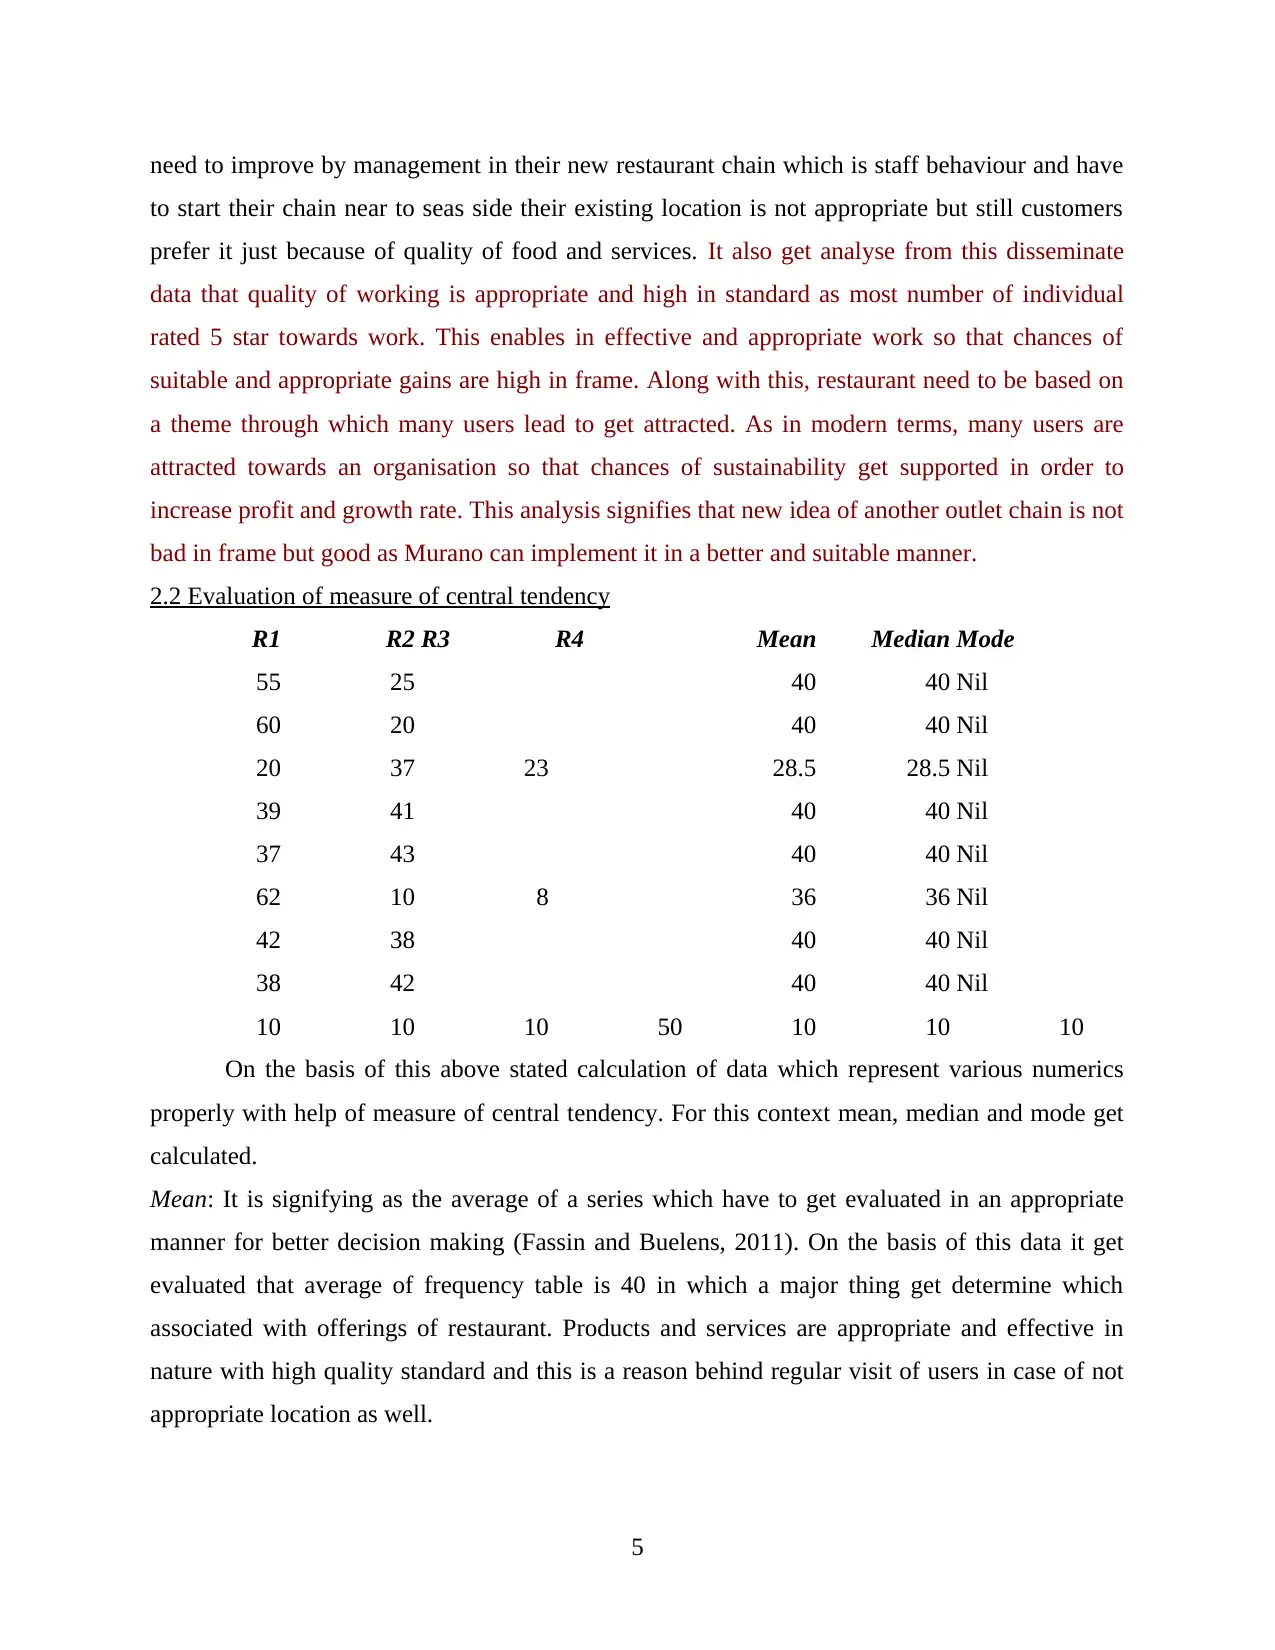
2.2 Evaluation of measure of central tendency
R1 R2 R3 R4 Mean Median Mode
55 25 40 40 Nil
60 20 40 40 Nil
20 37 23 28.5 28.5 Nil
39 41 40 40 Nil
37 43 40 40 Nil
62 10 8 36 36 Nil
42 38 40 40 Nil
38 42 40 40 Nil
10 10 10 50 10 10 10
On the basis of this above stated calculation of data which represent various numerics
properly with help of measure of central tendency. For this context mean, median and mode get
calculated.
Mean: It is signifying as the average of a series which have to get evaluated in an appropriate
manner for better decision making (Fassin and Buelens, 2011). On the basis of this data it get
evaluated that average of frequency table is 40 in which a major thing get determine which
associated with offerings of restaurant. Products and services are appropriate and effective in
nature with high quality standard and this is a reason behind regular visit of users in case of not
appropriate location as well.
5
to start their chain near to seas side their existing location is not appropriate but still customers
prefer it just because of quality of food and services. It also get analyse from this disseminate
data that quality of working is appropriate and high in standard as most number of individual
rated 5 star towards work. This enables in effective and appropriate work so that chances of
suitable and appropriate gains are high in frame. Along with this, restaurant need to be based on
a theme through which many users lead to get attracted. As in modern terms, many users are
attracted towards an organisation so that chances of sustainability get supported in order to
increase profit and growth rate. This analysis signifies that new idea of another outlet chain is not
bad in frame but good as Murano can implement it in a better and suitable manner.
2.2 Evaluation of measure of central tendency
R1 R2 R3 R4 Mean Median Mode
55 25 40 40 Nil
60 20 40 40 Nil
20 37 23 28.5 28.5 Nil
39 41 40 40 Nil
37 43 40 40 Nil
62 10 8 36 36 Nil
42 38 40 40 Nil
38 42 40 40 Nil
10 10 10 50 10 10 10
On the basis of this above stated calculation of data which represent various numerics
properly with help of measure of central tendency. For this context mean, median and mode get
calculated.
Mean: It is signifying as the average of a series which have to get evaluated in an appropriate
manner for better decision making (Fassin and Buelens, 2011). On the basis of this data it get
evaluated that average of frequency table is 40 in which a major thing get determine which
associated with offerings of restaurant. Products and services are appropriate and effective in
nature with high quality standard and this is a reason behind regular visit of users in case of not
appropriate location as well.
5
Paraphrase This Document
Need a fresh take? Get an instant paraphrase of this document with our AI Paraphraser
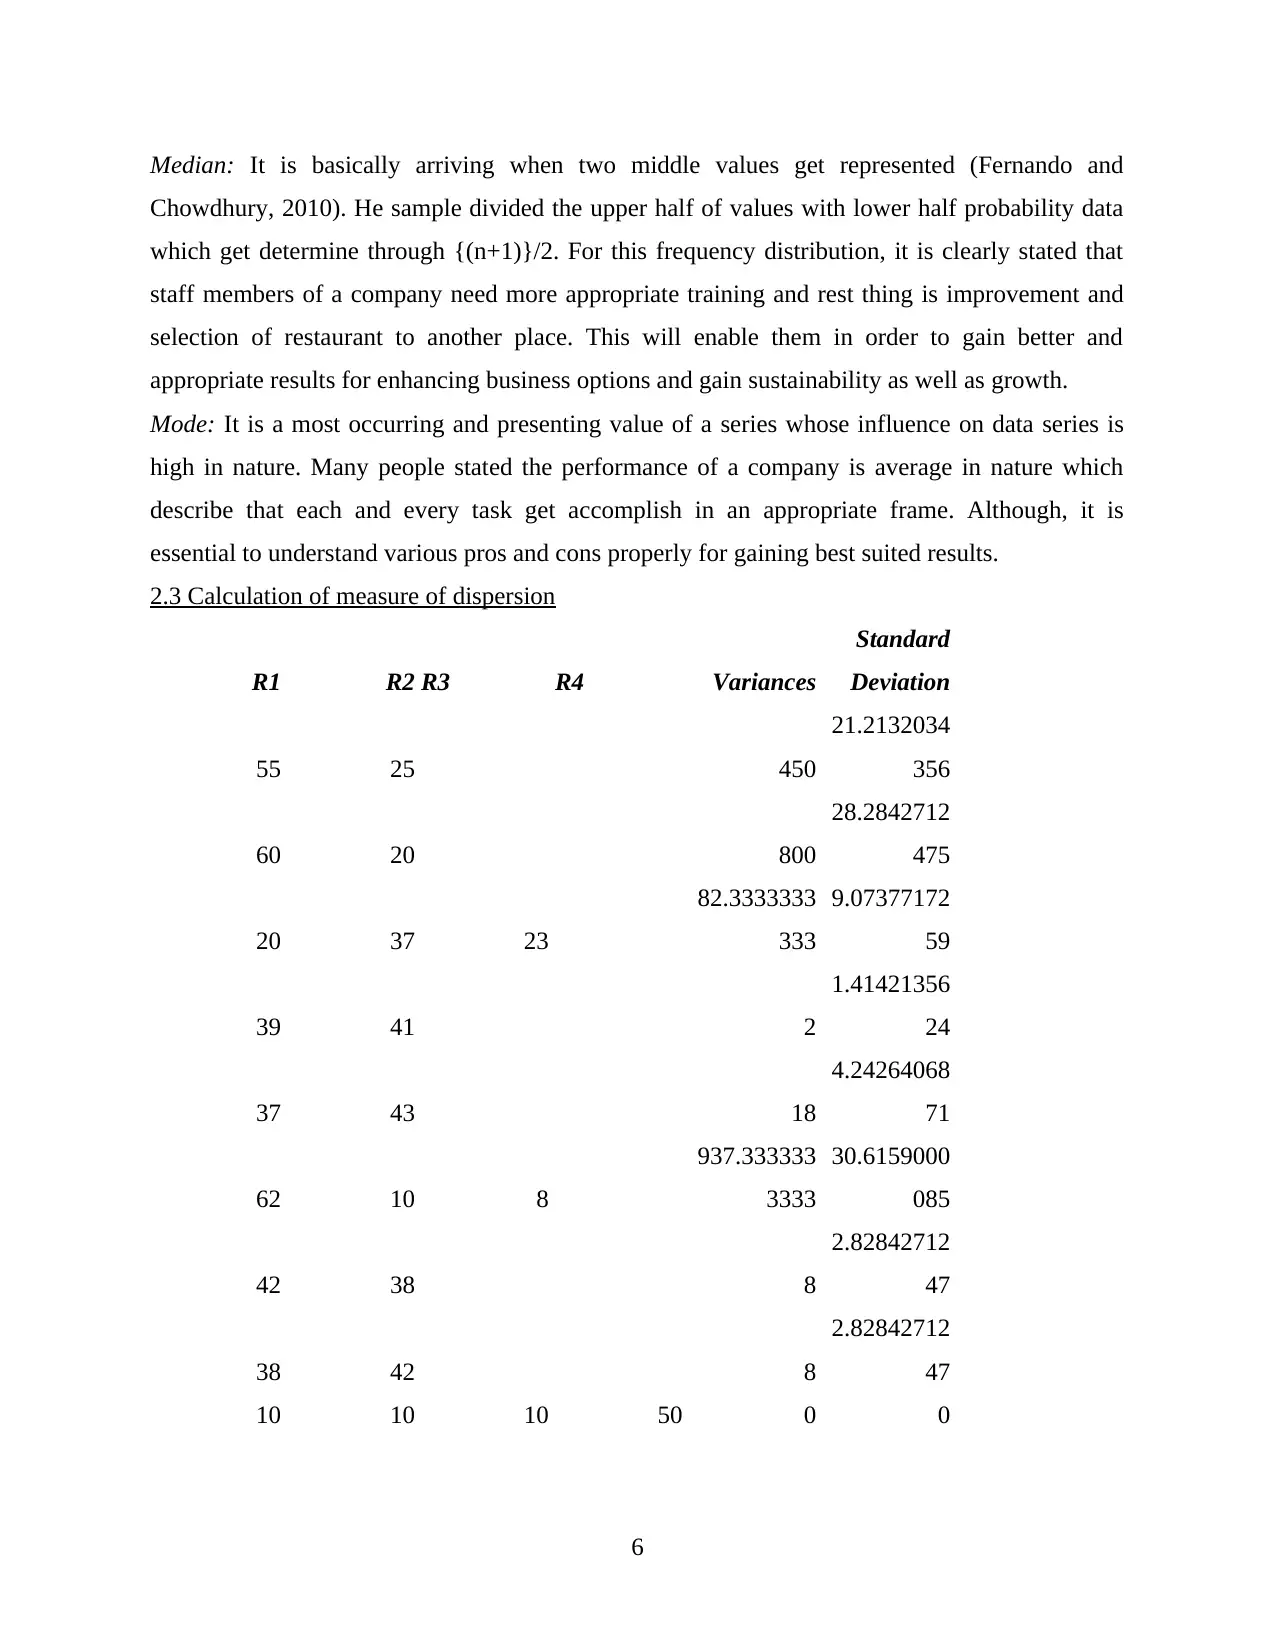
Median: It is basically arriving when two middle values get represented (Fernando and
Chowdhury, 2010). He sample divided the upper half of values with lower half probability data
which get determine through {(n+1)}/2. For this frequency distribution, it is clearly stated that
staff members of a company need more appropriate training and rest thing is improvement and
selection of restaurant to another place. This will enable them in order to gain better and
appropriate results for enhancing business options and gain sustainability as well as growth.
Mode: It is a most occurring and presenting value of a series whose influence on data series is
high in nature. Many people stated the performance of a company is average in nature which
describe that each and every task get accomplish in an appropriate frame. Although, it is
essential to understand various pros and cons properly for gaining best suited results.
2.3 Calculation of measure of dispersion
R1 R2 R3 R4 Variances
Standard
Deviation
55 25 450
21.2132034
356
60 20 800
28.2842712
475
20 37 23
82.3333333
333
9.07377172
59
39 41 2
1.41421356
24
37 43 18
4.24264068
71
62 10 8
937.333333
3333
30.6159000
085
42 38 8
2.82842712
47
38 42 8
2.82842712
47
10 10 10 50 0 0
6
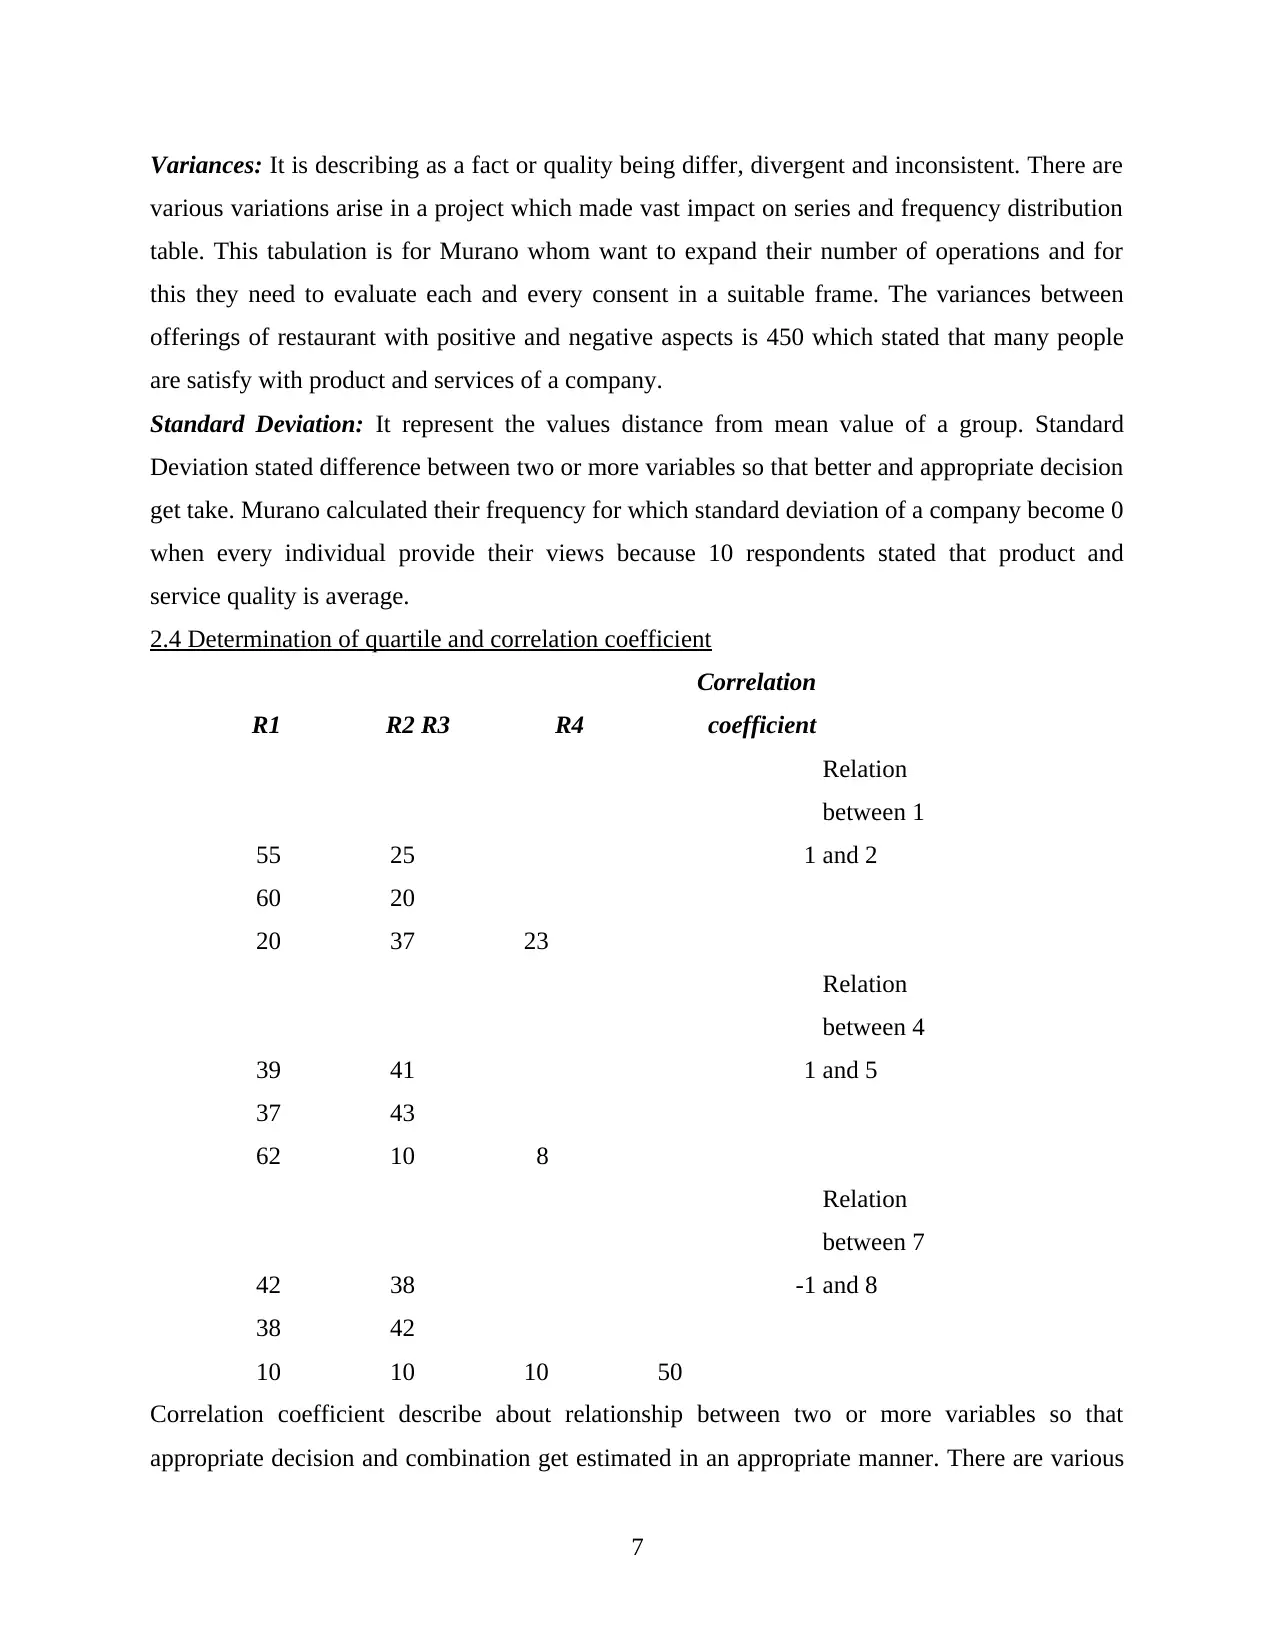
Variances: It is describing as a fact or quality being differ, divergent and inconsistent. There are
various variations arise in a project which made vast impact on series and frequency distribution
table. This tabulation is for Murano whom want to expand their number of operations and for
this they need to evaluate each and every consent in a suitable frame. The variances between
offerings of restaurant with positive and negative aspects is 450 which stated that many people
are satisfy with product and services of a company.
Standard Deviation: It represent the values distance from mean value of a group. Standard
Deviation stated difference between two or more variables so that better and appropriate decision
get take. Murano calculated their frequency for which standard deviation of a company become 0
when every individual provide their views because 10 respondents stated that product and
service quality is average.
2.4 Determination of quartile and correlation coefficient
R1 R2 R3 R4
Correlation
coefficient
55 25 1
Relation
between 1
and 2
60 20
20 37 23
39 41 1
Relation
between 4
and 5
37 43
62 10 8
42 38 -1
Relation
between 7
and 8
38 42
10 10 10 50
Correlation coefficient describe about relationship between two or more variables so that
appropriate decision and combination get estimated in an appropriate manner. There are various
7
⊘ This is a preview!⊘
Do you want full access?
Subscribe today to unlock all pages.
Trusted by 1+ million students worldwide
frequencies are interrelated with each other which made positive and negative relationship with
each other. If data is more than 1 or less than 1 then it will have impacted upon activities most.
The relationship between offerings and visit is positive in nature which stated that appropriate
working and decision could be made.
TASK 2
3.1 Creation of graphs and charts
1 2
0
10
20
30
40
50
60 55
25
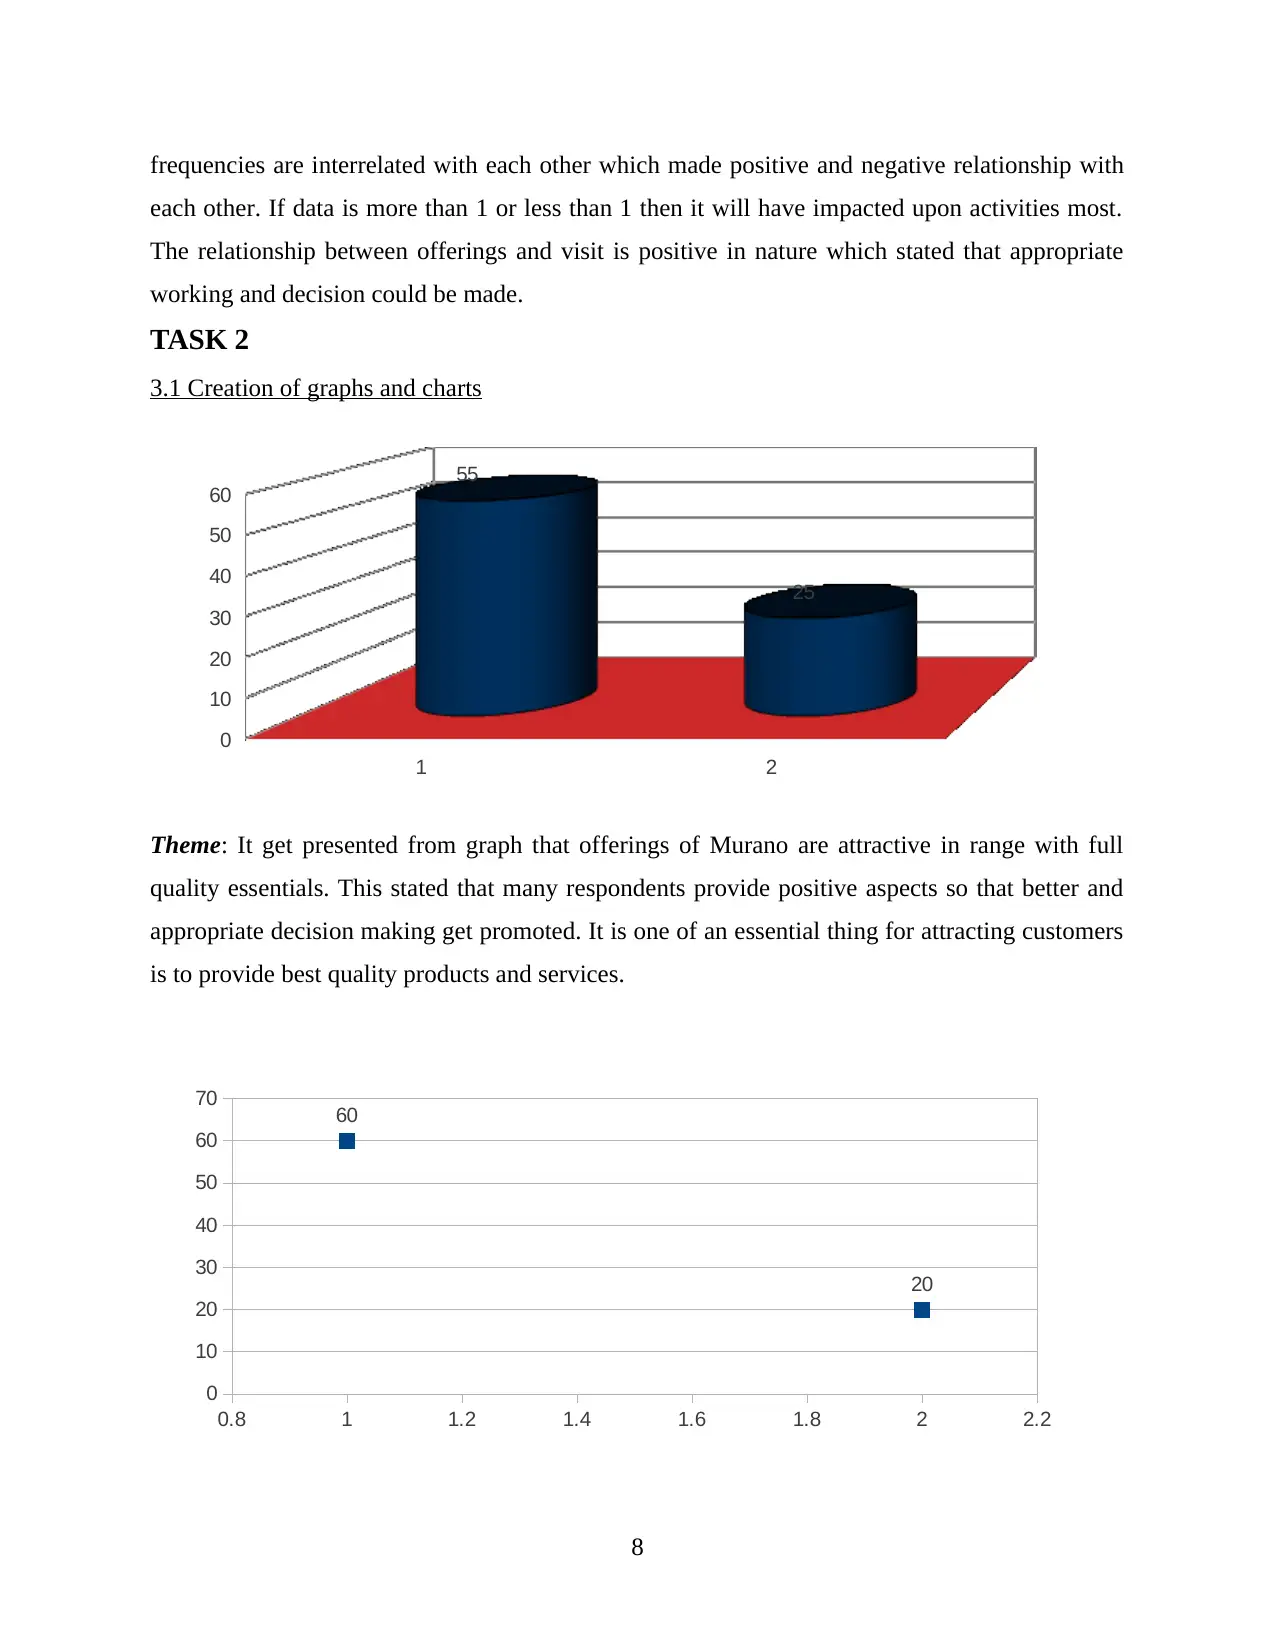
Theme: It get presented from graph that offerings of Murano are attractive in range with full
quality essentials. This stated that many respondents provide positive aspects so that better and
appropriate decision making get promoted. It is one of an essential thing for attracting customers
is to provide best quality products and services.
0.8 1 1.2 1.4 1.6 1.8 2 2.2
0
10
20
30
40
50
60
70 60
20
8
each other. If data is more than 1 or less than 1 then it will have impacted upon activities most.
The relationship between offerings and visit is positive in nature which stated that appropriate
working and decision could be made.
TASK 2
3.1 Creation of graphs and charts
1 2
0
10
20
30
40
50
60 55
25
Theme: It get presented from graph that offerings of Murano are attractive in range with full
quality essentials. This stated that many respondents provide positive aspects so that better and
appropriate decision making get promoted. It is one of an essential thing for attracting customers
is to provide best quality products and services.
0.8 1 1.2 1.4 1.6 1.8 2 2.2
0
10
20
30
40
50
60
70 60
20
8
Paraphrase This Document
Need a fresh take? Get an instant paraphrase of this document with our AI Paraphraser
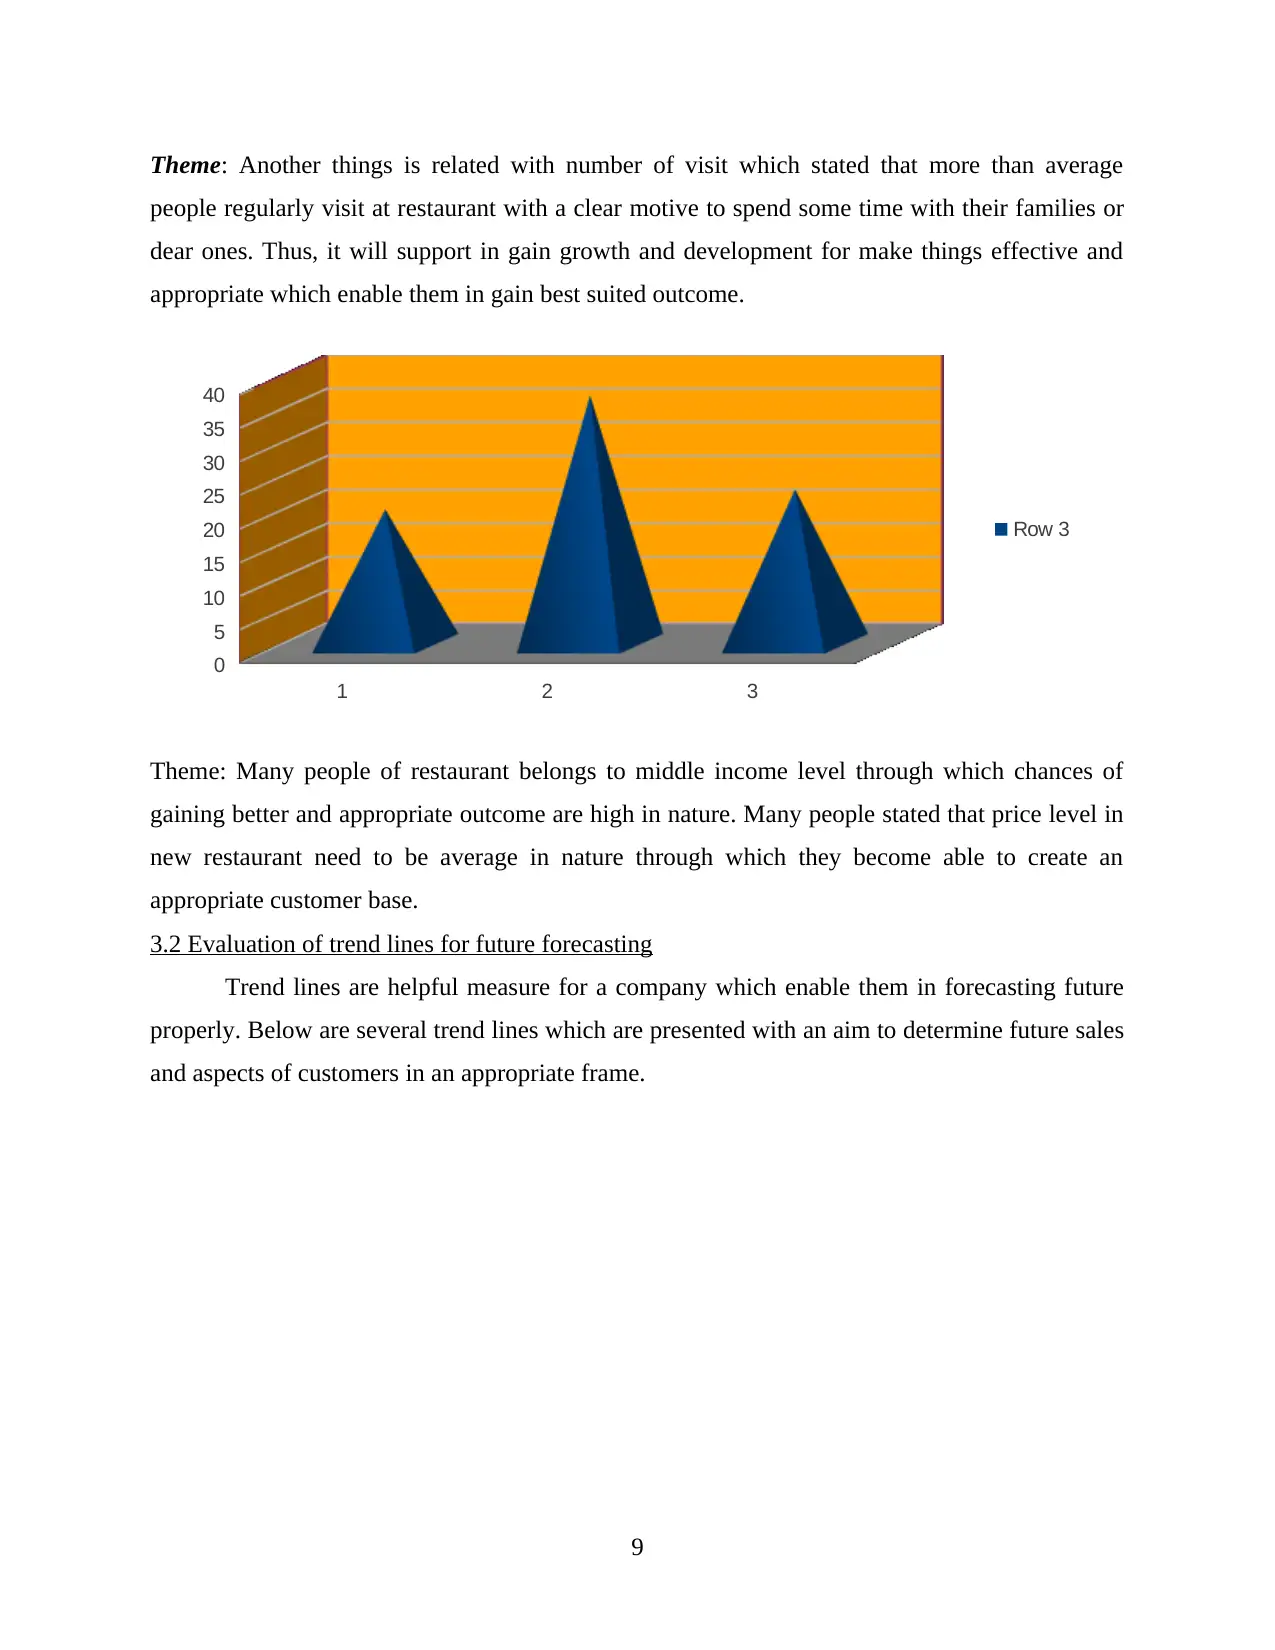
Theme: Another things is related with number of visit which stated that more than average
people regularly visit at restaurant with a clear motive to spend some time with their families or
dear ones. Thus, it will support in gain growth and development for make things effective and
appropriate which enable them in gain best suited outcome.
1 2 3
0
5
10
15
20
25
30
35
40
Row 3
Theme: Many people of restaurant belongs to middle income level through which chances of
gaining better and appropriate outcome are high in nature. Many people stated that price level in
new restaurant need to be average in nature through which they become able to create an
appropriate customer base.
3.2 Evaluation of trend lines for future forecasting
Trend lines are helpful measure for a company which enable them in forecasting future
properly. Below are several trend lines which are presented with an aim to determine future sales
and aspects of customers in an appropriate frame.
9
1 2 3
0
10
20
30
40
50
60
70
62
10 8
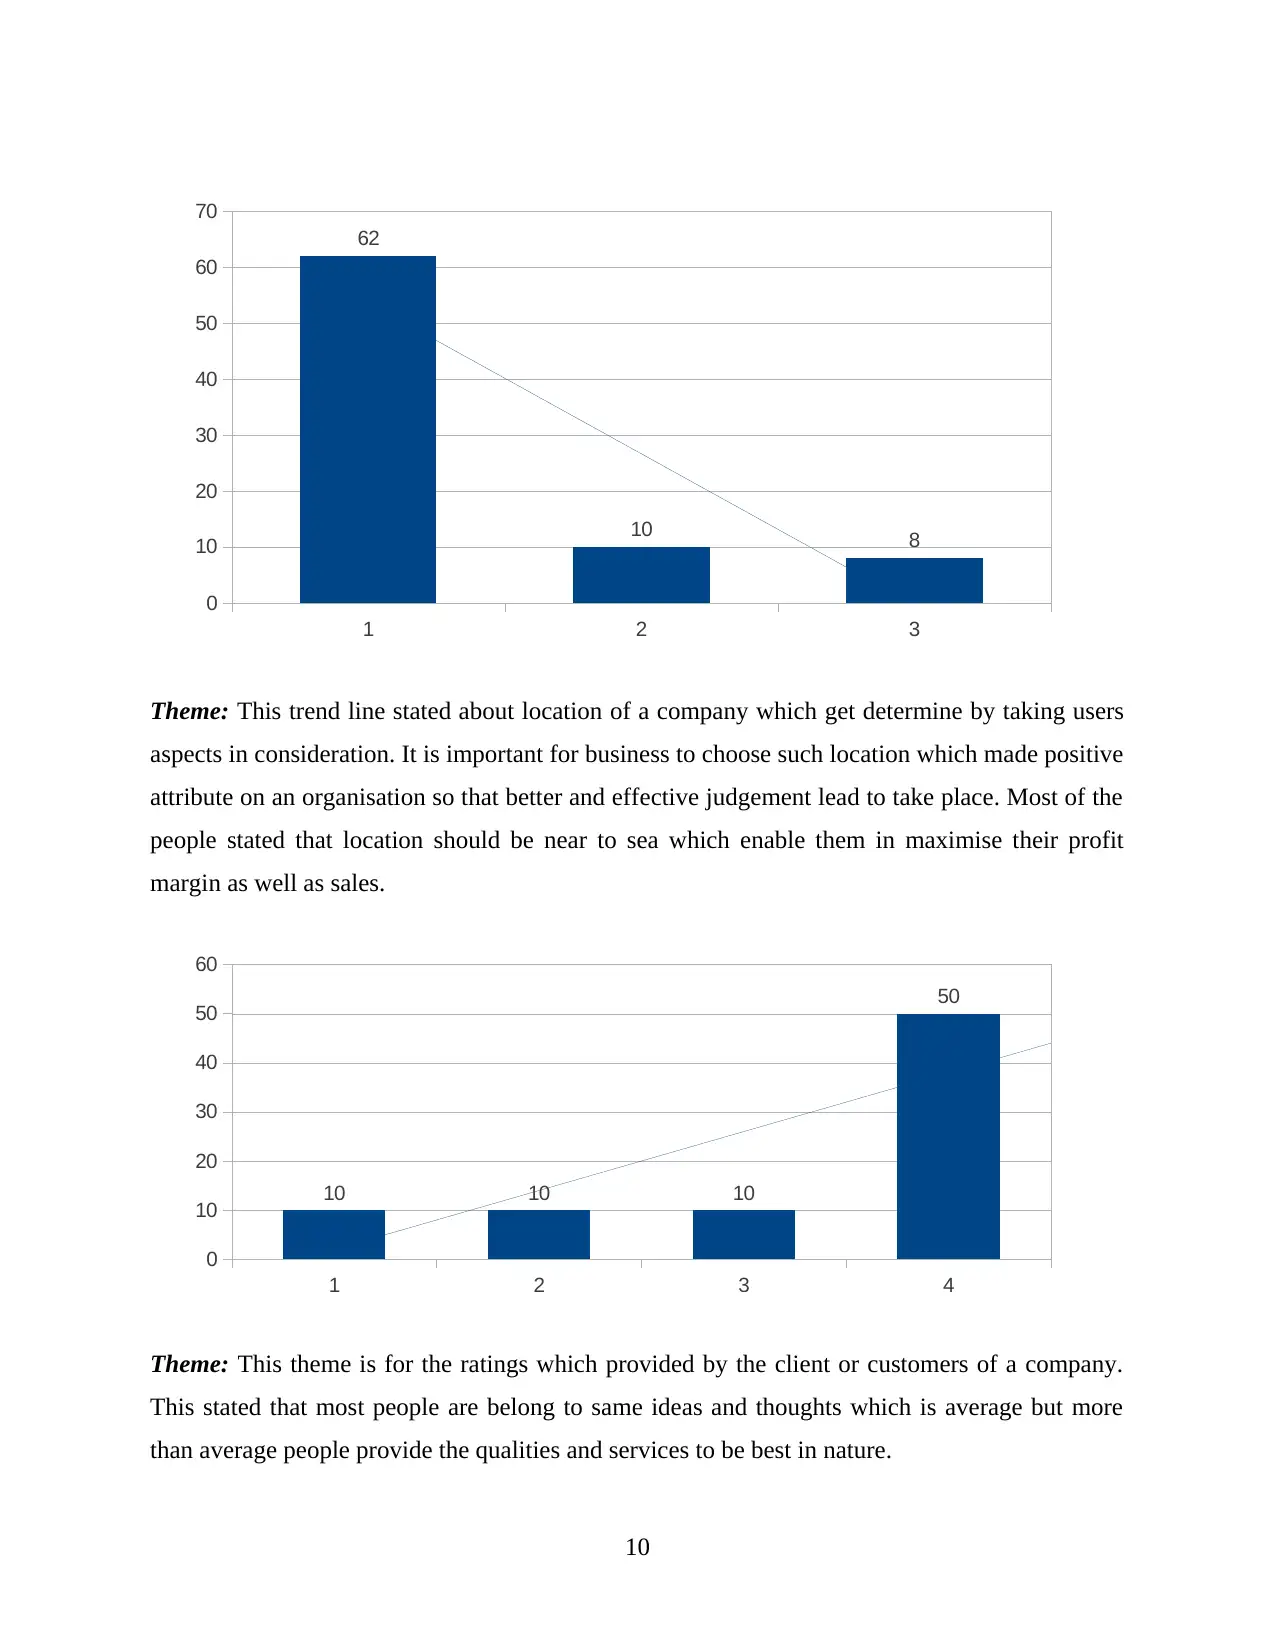
Theme: This trend line stated about location of a company which get determine by taking users
aspects in consideration. It is important for business to choose such location which made positive
attribute on an organisation so that better and effective judgement lead to take place. Most of the
people stated that location should be near to sea which enable them in maximise their profit
margin as well as sales.
1 2 3 4
0
10
20
30
40
50
60
10 10 10
50
Theme: This theme is for the ratings which provided by the client or customers of a company.
This stated that most people are belong to same ideas and thoughts which is average but more
than average people provide the qualities and services to be best in nature.
10
0
10
20
30
40
50
60
70
62
10 8
Theme: This trend line stated about location of a company which get determine by taking users
aspects in consideration. It is important for business to choose such location which made positive
attribute on an organisation so that better and effective judgement lead to take place. Most of the
people stated that location should be near to sea which enable them in maximise their profit
margin as well as sales.
1 2 3 4
0
10
20
30
40
50
60
10 10 10
50
Theme: This theme is for the ratings which provided by the client or customers of a company.
This stated that most people are belong to same ideas and thoughts which is average but more
than average people provide the qualities and services to be best in nature.
10
⊘ This is a preview!⊘
Do you want full access?
Subscribe today to unlock all pages.
Trusted by 1+ million students worldwide
1 out of 18
Related Documents


Your All-in-One AI-Powered Toolkit for Academic Success.
+13062052269
info@desklib.com
Available 24*7 on WhatsApp / Email
![[object Object]](/_next/static/media/star-bottom.7253800d.svg)
Unlock your academic potential
Copyright © 2020–2026 A2Z Services. All Rights Reserved. Developed and managed by ZUCOL.