Financial Ratio Analysis of Facebook and Twitter (2014-2016) Report
VerifiedAdded on 2023/06/15
|9
|2727
|123
Report
AI Summary
This report provides a comparative financial analysis of Facebook and Twitter from 2014 to 2016, focusing on profitability, liquidity, solvency, and efficiency ratios. The analysis reveals that Facebook exhibits stronger profitability, liquidity, and solvency positions compared to Twitter. Facebook demonstrates a significant increase in net profit, gross profit margin, and return on assets, indicating effective resource management and investment returns. While Twitter shows satisfactory liquidity and efficiency ratios, its profitability remains weak due to incurred losses. The report concludes that Facebook presents a more favorable investment opportunity due to its superior financial health and lower debt component. The document includes detailed ratio calculations and segmental analysis to support the findings. Desklib provides access to this and other solved assignments for students.
11.0 Comparison of the Financial Ratios for the last three years (2016,2015,2014)
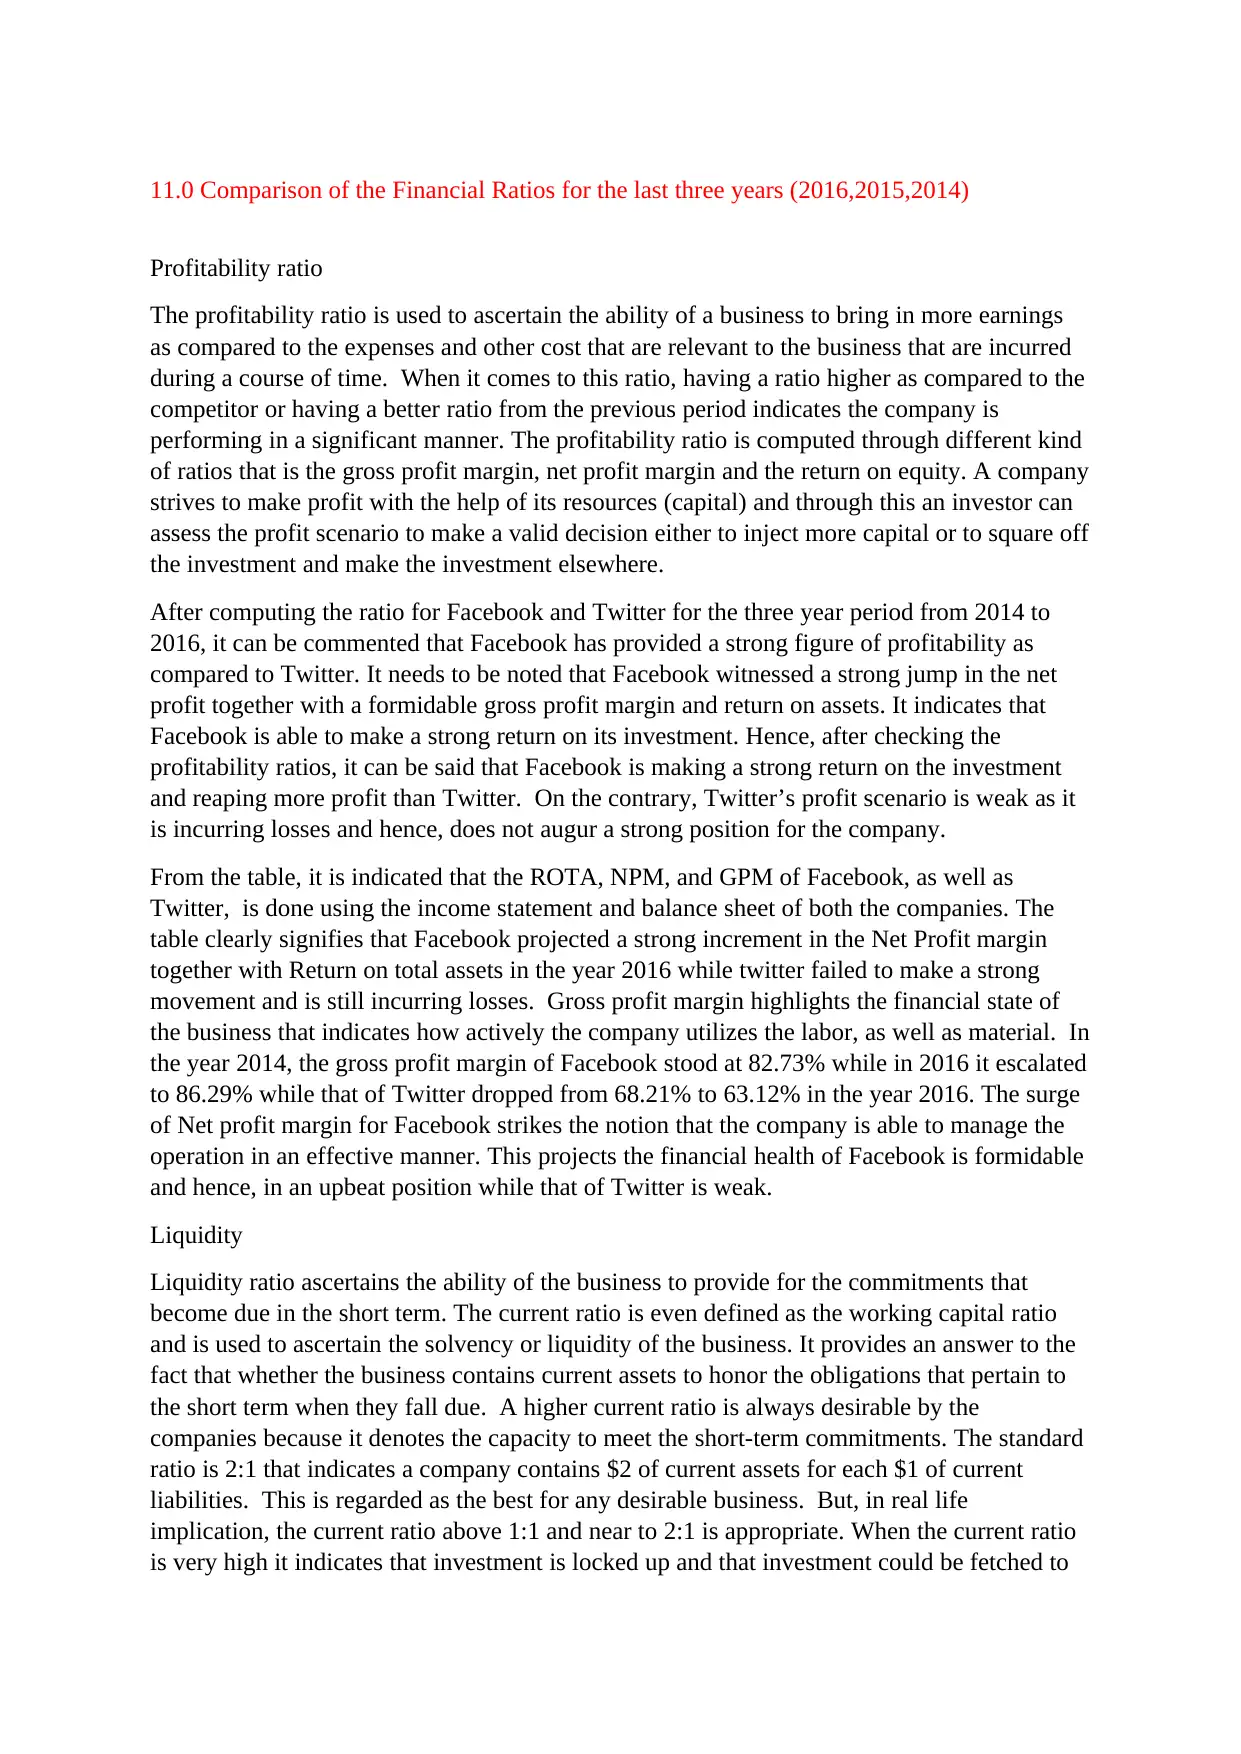
Profitability ratio
The profitability ratio is used to ascertain the ability of a business to bring in more earnings
as compared to the expenses and other cost that are relevant to the business that are incurred
during a course of time. When it comes to this ratio, having a ratio higher as compared to the
competitor or having a better ratio from the previous period indicates the company is
performing in a significant manner. The profitability ratio is computed through different kind
of ratios that is the gross profit margin, net profit margin and the return on equity. A company
strives to make profit with the help of its resources (capital) and through this an investor can
assess the profit scenario to make a valid decision either to inject more capital or to square off
the investment and make the investment elsewhere.
After computing the ratio for Facebook and Twitter for the three year period from 2014 to
2016, it can be commented that Facebook has provided a strong figure of profitability as
compared to Twitter. It needs to be noted that Facebook witnessed a strong jump in the net
profit together with a formidable gross profit margin and return on assets. It indicates that
Facebook is able to make a strong return on its investment. Hence, after checking the
profitability ratios, it can be said that Facebook is making a strong return on the investment
and reaping more profit than Twitter. On the contrary, Twitter’s profit scenario is weak as it
is incurring losses and hence, does not augur a strong position for the company.
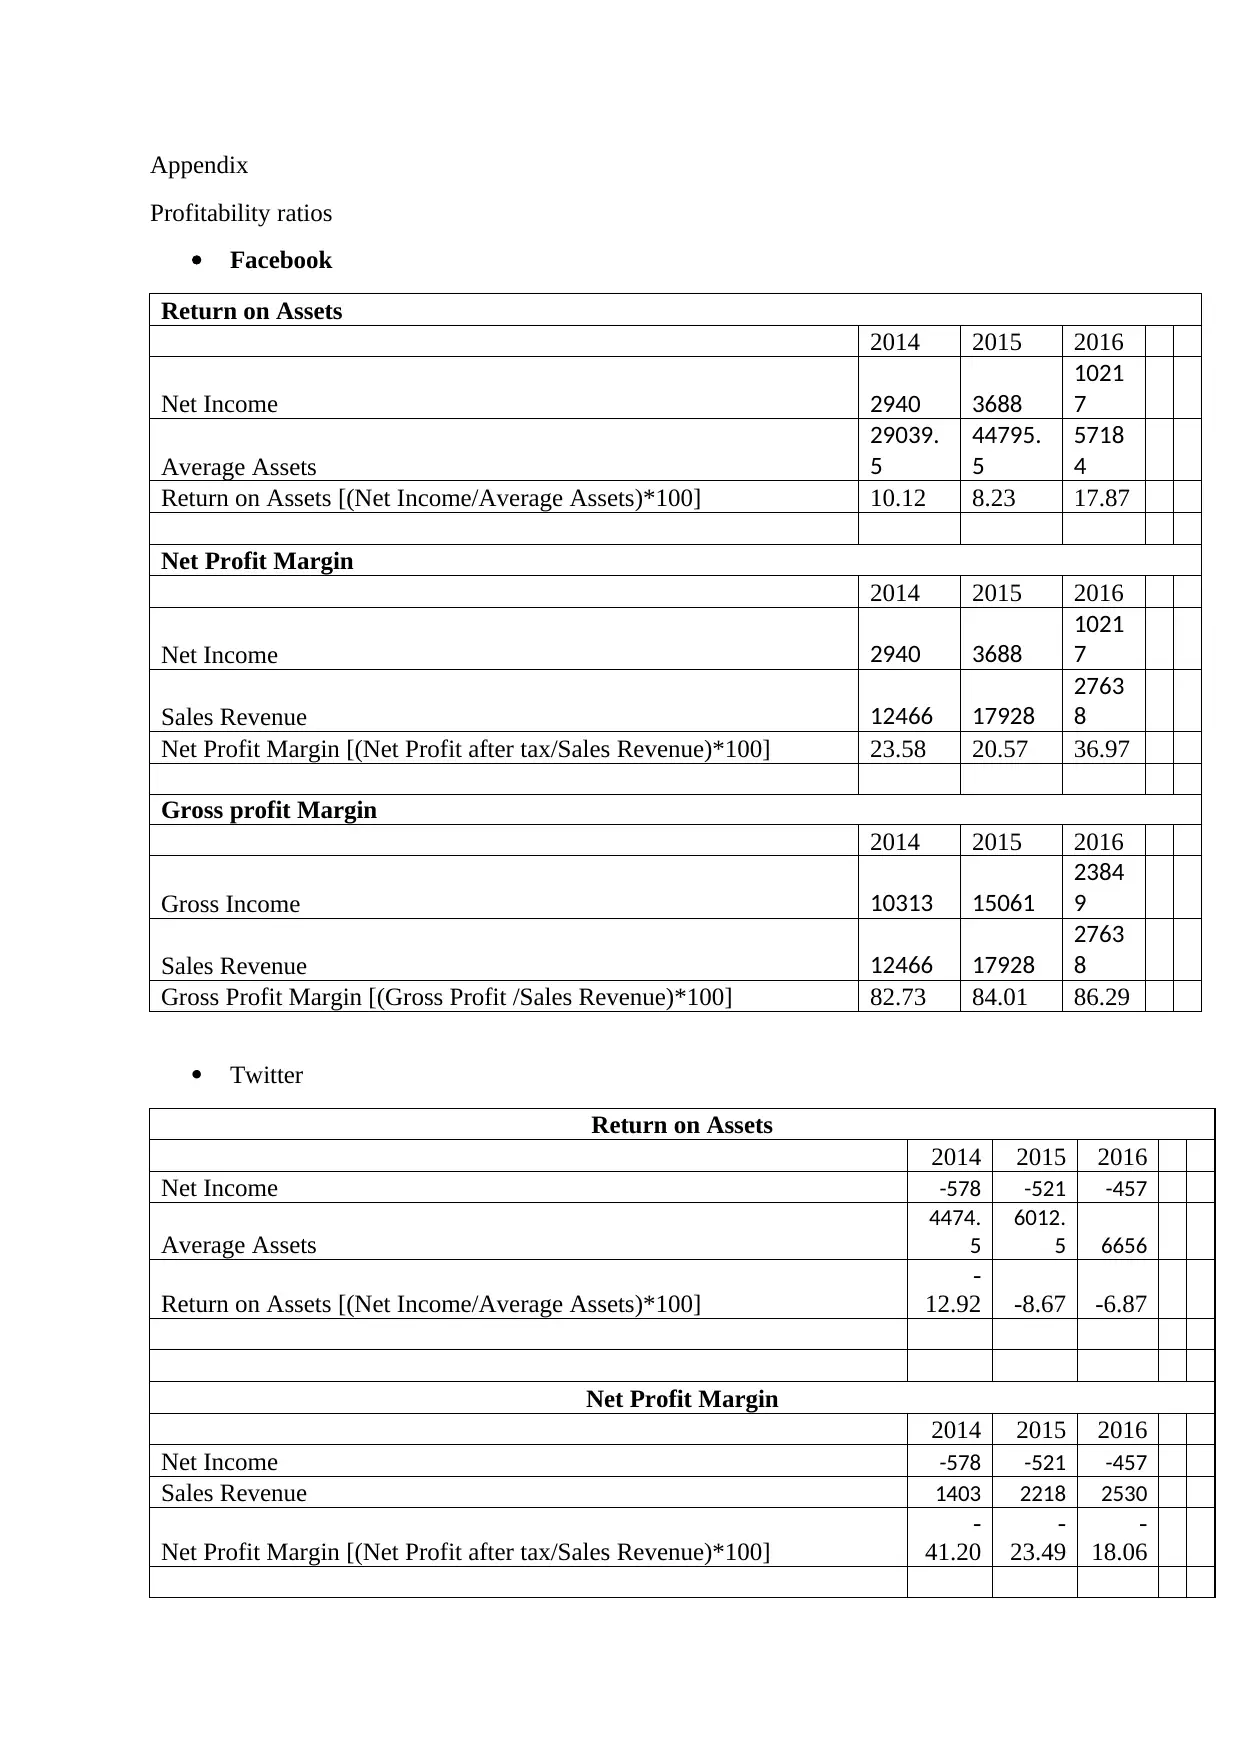
From the table, it is indicated that the ROTA, NPM, and GPM of Facebook, as well as
Twitter, is done using the income statement and balance sheet of both the companies. The
table clearly signifies that Facebook projected a strong increment in the Net Profit margin
together with Return on total assets in the year 2016 while twitter failed to make a strong
movement and is still incurring losses. Gross profit margin highlights the financial state of
the business that indicates how actively the company utilizes the labor, as well as material. In
the year 2014, the gross profit margin of Facebook stood at 82.73% while in 2016 it escalated
to 86.29% while that of Twitter dropped from 68.21% to 63.12% in the year 2016. The surge
of Net profit margin for Facebook strikes the notion that the company is able to manage the
operation in an effective manner. This projects the financial health of Facebook is formidable
and hence, in an upbeat position while that of Twitter is weak.
Liquidity
Liquidity ratio ascertains the ability of the business to provide for the commitments that
become due in the short term. The current ratio is even defined as the working capital ratio
and is used to ascertain the solvency or liquidity of the business. It provides an answer to the
fact that whether the business contains current assets to honor the obligations that pertain to
the short term when they fall due. A higher current ratio is always desirable by the
companies because it denotes the capacity to meet the short-term commitments. The standard
ratio is 2:1 that indicates a company contains $2 of current assets for each $1 of current
liabilities. This is regarded as the best for any desirable business. But, in real life
implication, the current ratio above 1:1 and near to 2:1 is appropriate. When the current ratio
is very high it indicates that investment is locked up and that investment could be fetched to
Profitability ratio
The profitability ratio is used to ascertain the ability of a business to bring in more earnings
as compared to the expenses and other cost that are relevant to the business that are incurred
during a course of time. When it comes to this ratio, having a ratio higher as compared to the
competitor or having a better ratio from the previous period indicates the company is
performing in a significant manner. The profitability ratio is computed through different kind
of ratios that is the gross profit margin, net profit margin and the return on equity. A company
strives to make profit with the help of its resources (capital) and through this an investor can
assess the profit scenario to make a valid decision either to inject more capital or to square off
the investment and make the investment elsewhere.
After computing the ratio for Facebook and Twitter for the three year period from 2014 to
2016, it can be commented that Facebook has provided a strong figure of profitability as
compared to Twitter. It needs to be noted that Facebook witnessed a strong jump in the net
profit together with a formidable gross profit margin and return on assets. It indicates that
Facebook is able to make a strong return on its investment. Hence, after checking the
profitability ratios, it can be said that Facebook is making a strong return on the investment
and reaping more profit than Twitter. On the contrary, Twitter’s profit scenario is weak as it
is incurring losses and hence, does not augur a strong position for the company.
From the table, it is indicated that the ROTA, NPM, and GPM of Facebook, as well as
Twitter, is done using the income statement and balance sheet of both the companies. The
table clearly signifies that Facebook projected a strong increment in the Net Profit margin
together with Return on total assets in the year 2016 while twitter failed to make a strong
movement and is still incurring losses. Gross profit margin highlights the financial state of
the business that indicates how actively the company utilizes the labor, as well as material. In
the year 2014, the gross profit margin of Facebook stood at 82.73% while in 2016 it escalated
to 86.29% while that of Twitter dropped from 68.21% to 63.12% in the year 2016. The surge
of Net profit margin for Facebook strikes the notion that the company is able to manage the
operation in an effective manner. This projects the financial health of Facebook is formidable
and hence, in an upbeat position while that of Twitter is weak.
Liquidity
Liquidity ratio ascertains the ability of the business to provide for the commitments that
become due in the short term. The current ratio is even defined as the working capital ratio
and is used to ascertain the solvency or liquidity of the business. It provides an answer to the
fact that whether the business contains current assets to honor the obligations that pertain to
the short term when they fall due. A higher current ratio is always desirable by the
companies because it denotes the capacity to meet the short-term commitments. The standard
ratio is 2:1 that indicates a company contains $2 of current assets for each $1 of current
liabilities. This is regarded as the best for any desirable business. But, in real life
implication, the current ratio above 1:1 and near to 2:1 is appropriate. When the current ratio
is very high it indicates that investment is locked up and that investment could be fetched to
Paraphrase This Document
Need a fresh take? Get an instant paraphrase of this document with our AI Paraphraser
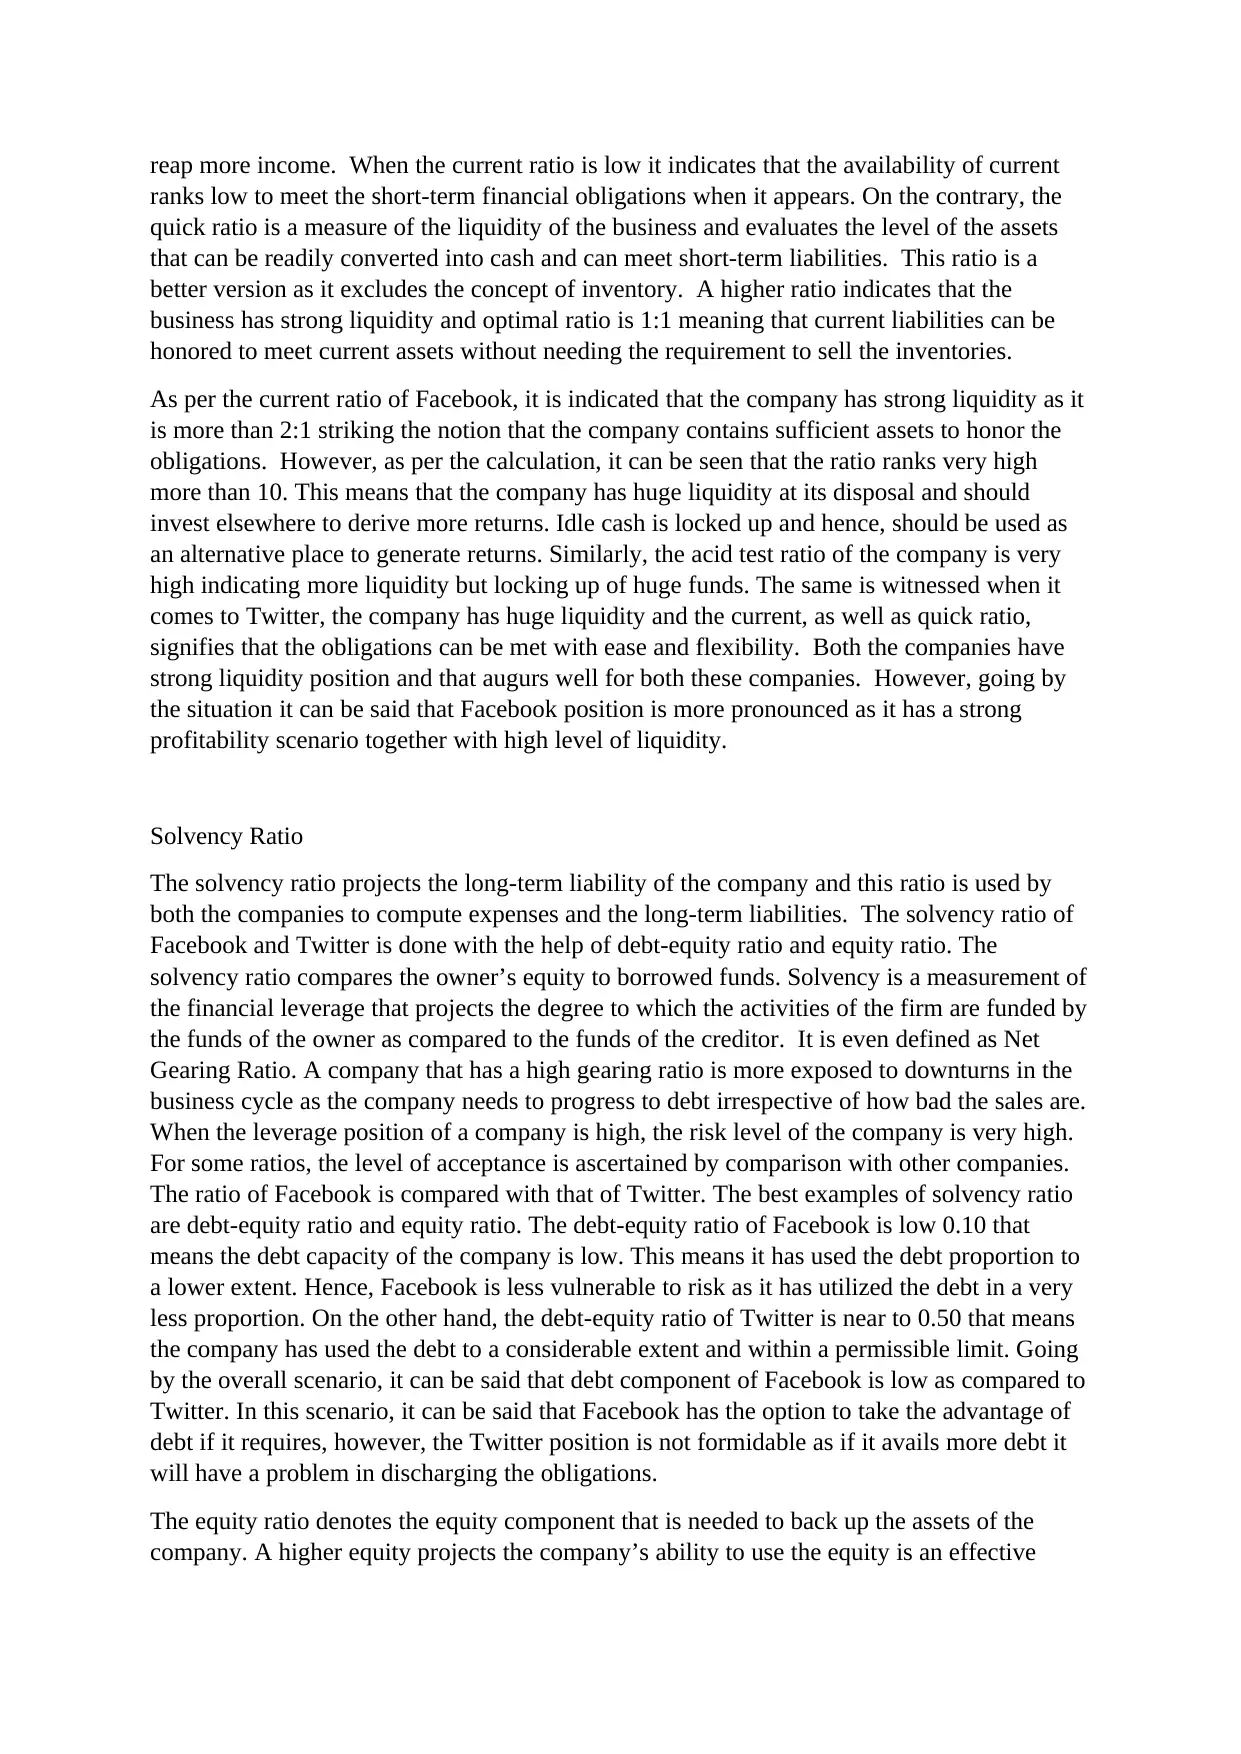
reap more income. When the current ratio is low it indicates that the availability of current
ranks low to meet the short-term financial obligations when it appears. On the contrary, the
quick ratio is a measure of the liquidity of the business and evaluates the level of the assets
that can be readily converted into cash and can meet short-term liabilities. This ratio is a
better version as it excludes the concept of inventory. A higher ratio indicates that the
business has strong liquidity and optimal ratio is 1:1 meaning that current liabilities can be
honored to meet current assets without needing the requirement to sell the inventories.
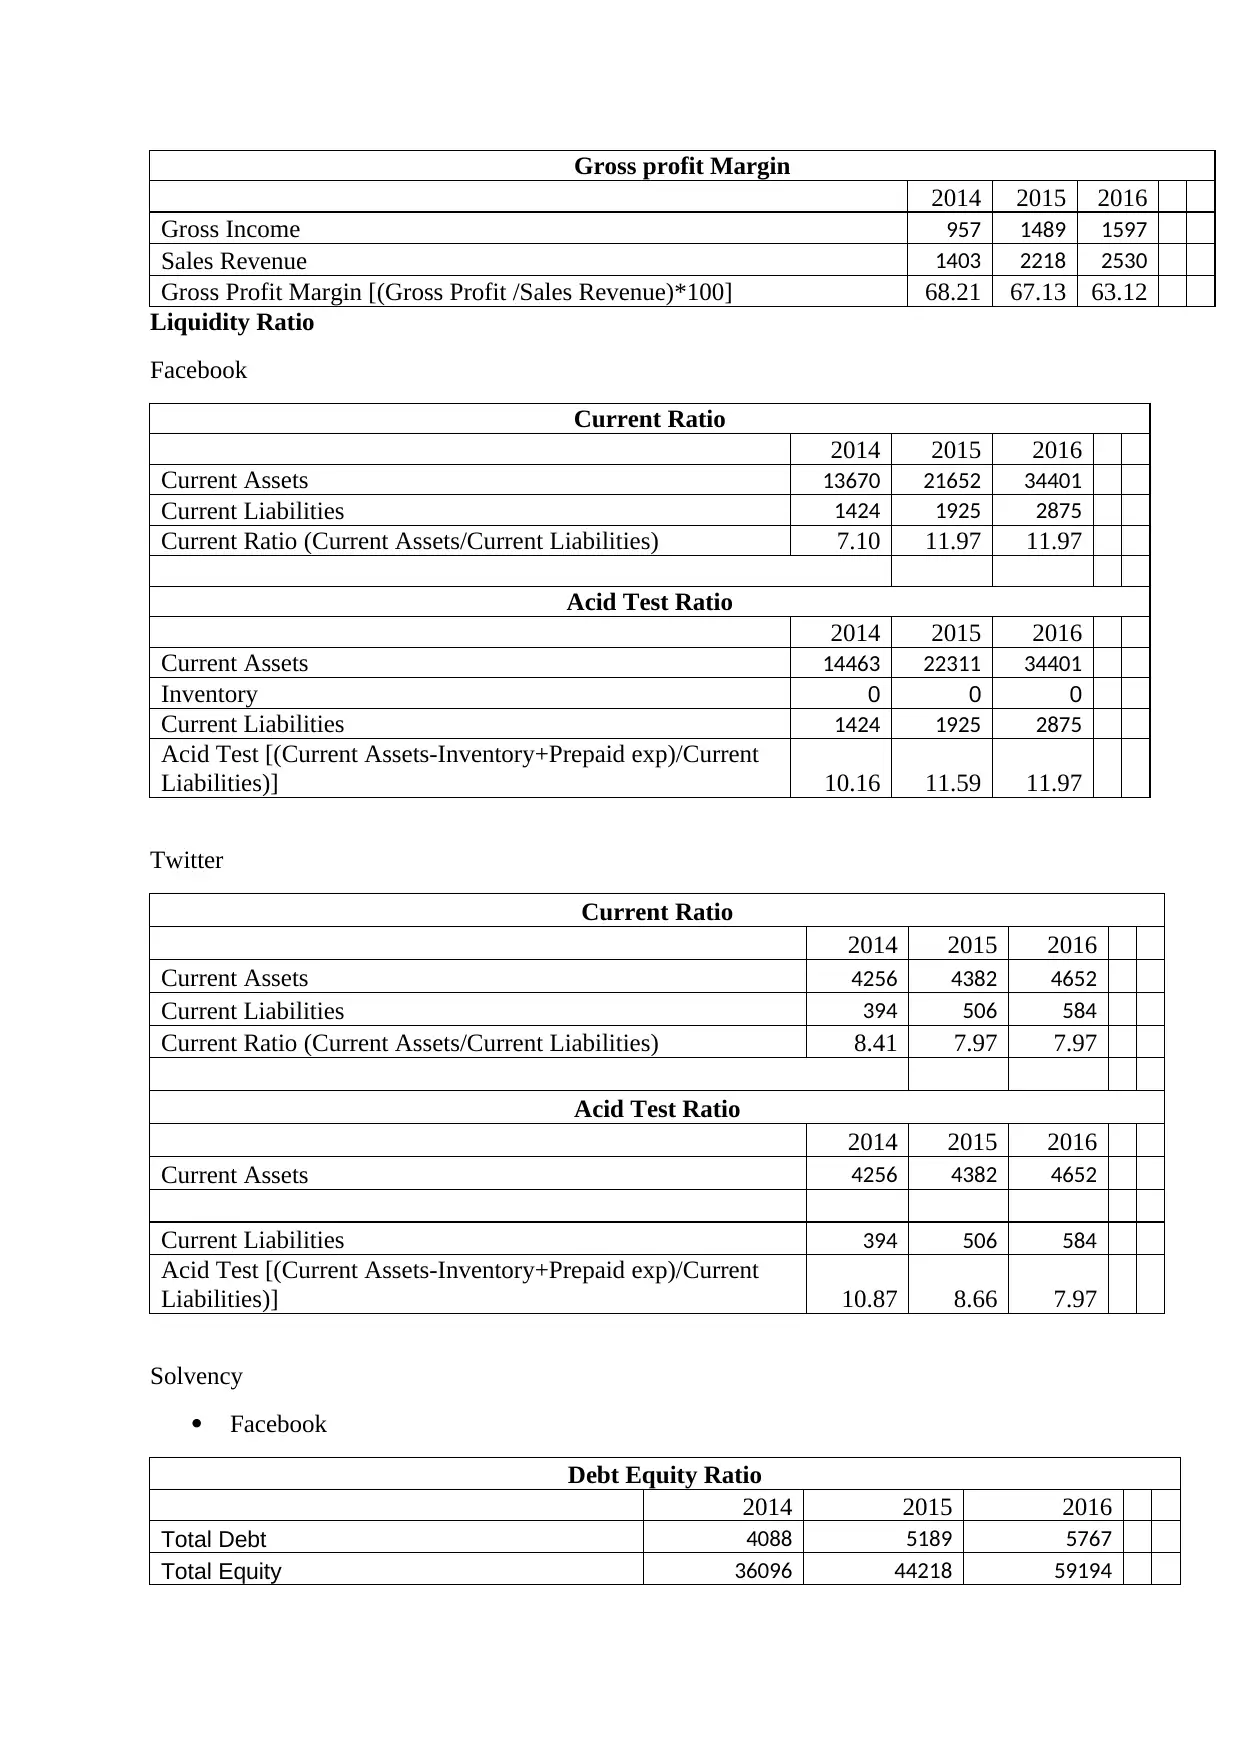
As per the current ratio of Facebook, it is indicated that the company has strong liquidity as it
is more than 2:1 striking the notion that the company contains sufficient assets to honor the
obligations. However, as per the calculation, it can be seen that the ratio ranks very high
more than 10. This means that the company has huge liquidity at its disposal and should
invest elsewhere to derive more returns. Idle cash is locked up and hence, should be used as
an alternative place to generate returns. Similarly, the acid test ratio of the company is very
high indicating more liquidity but locking up of huge funds. The same is witnessed when it
comes to Twitter, the company has huge liquidity and the current, as well as quick ratio,
signifies that the obligations can be met with ease and flexibility. Both the companies have
strong liquidity position and that augurs well for both these companies. However, going by
the situation it can be said that Facebook position is more pronounced as it has a strong
profitability scenario together with high level of liquidity.
Solvency Ratio
The solvency ratio projects the long-term liability of the company and this ratio is used by
both the companies to compute expenses and the long-term liabilities. The solvency ratio of
Facebook and Twitter is done with the help of debt-equity ratio and equity ratio. The
solvency ratio compares the owner’s equity to borrowed funds. Solvency is a measurement of
the financial leverage that projects the degree to which the activities of the firm are funded by
the funds of the owner as compared to the funds of the creditor. It is even defined as Net
Gearing Ratio. A company that has a high gearing ratio is more exposed to downturns in the
business cycle as the company needs to progress to debt irrespective of how bad the sales are.
When the leverage position of a company is high, the risk level of the company is very high.
For some ratios, the level of acceptance is ascertained by comparison with other companies.
The ratio of Facebook is compared with that of Twitter. The best examples of solvency ratio
are debt-equity ratio and equity ratio. The debt-equity ratio of Facebook is low 0.10 that
means the debt capacity of the company is low. This means it has used the debt proportion to
a lower extent. Hence, Facebook is less vulnerable to risk as it has utilized the debt in a very
less proportion. On the other hand, the debt-equity ratio of Twitter is near to 0.50 that means
the company has used the debt to a considerable extent and within a permissible limit. Going
by the overall scenario, it can be said that debt component of Facebook is low as compared to
Twitter. In this scenario, it can be said that Facebook has the option to take the advantage of
debt if it requires, however, the Twitter position is not formidable as if it avails more debt it
will have a problem in discharging the obligations.
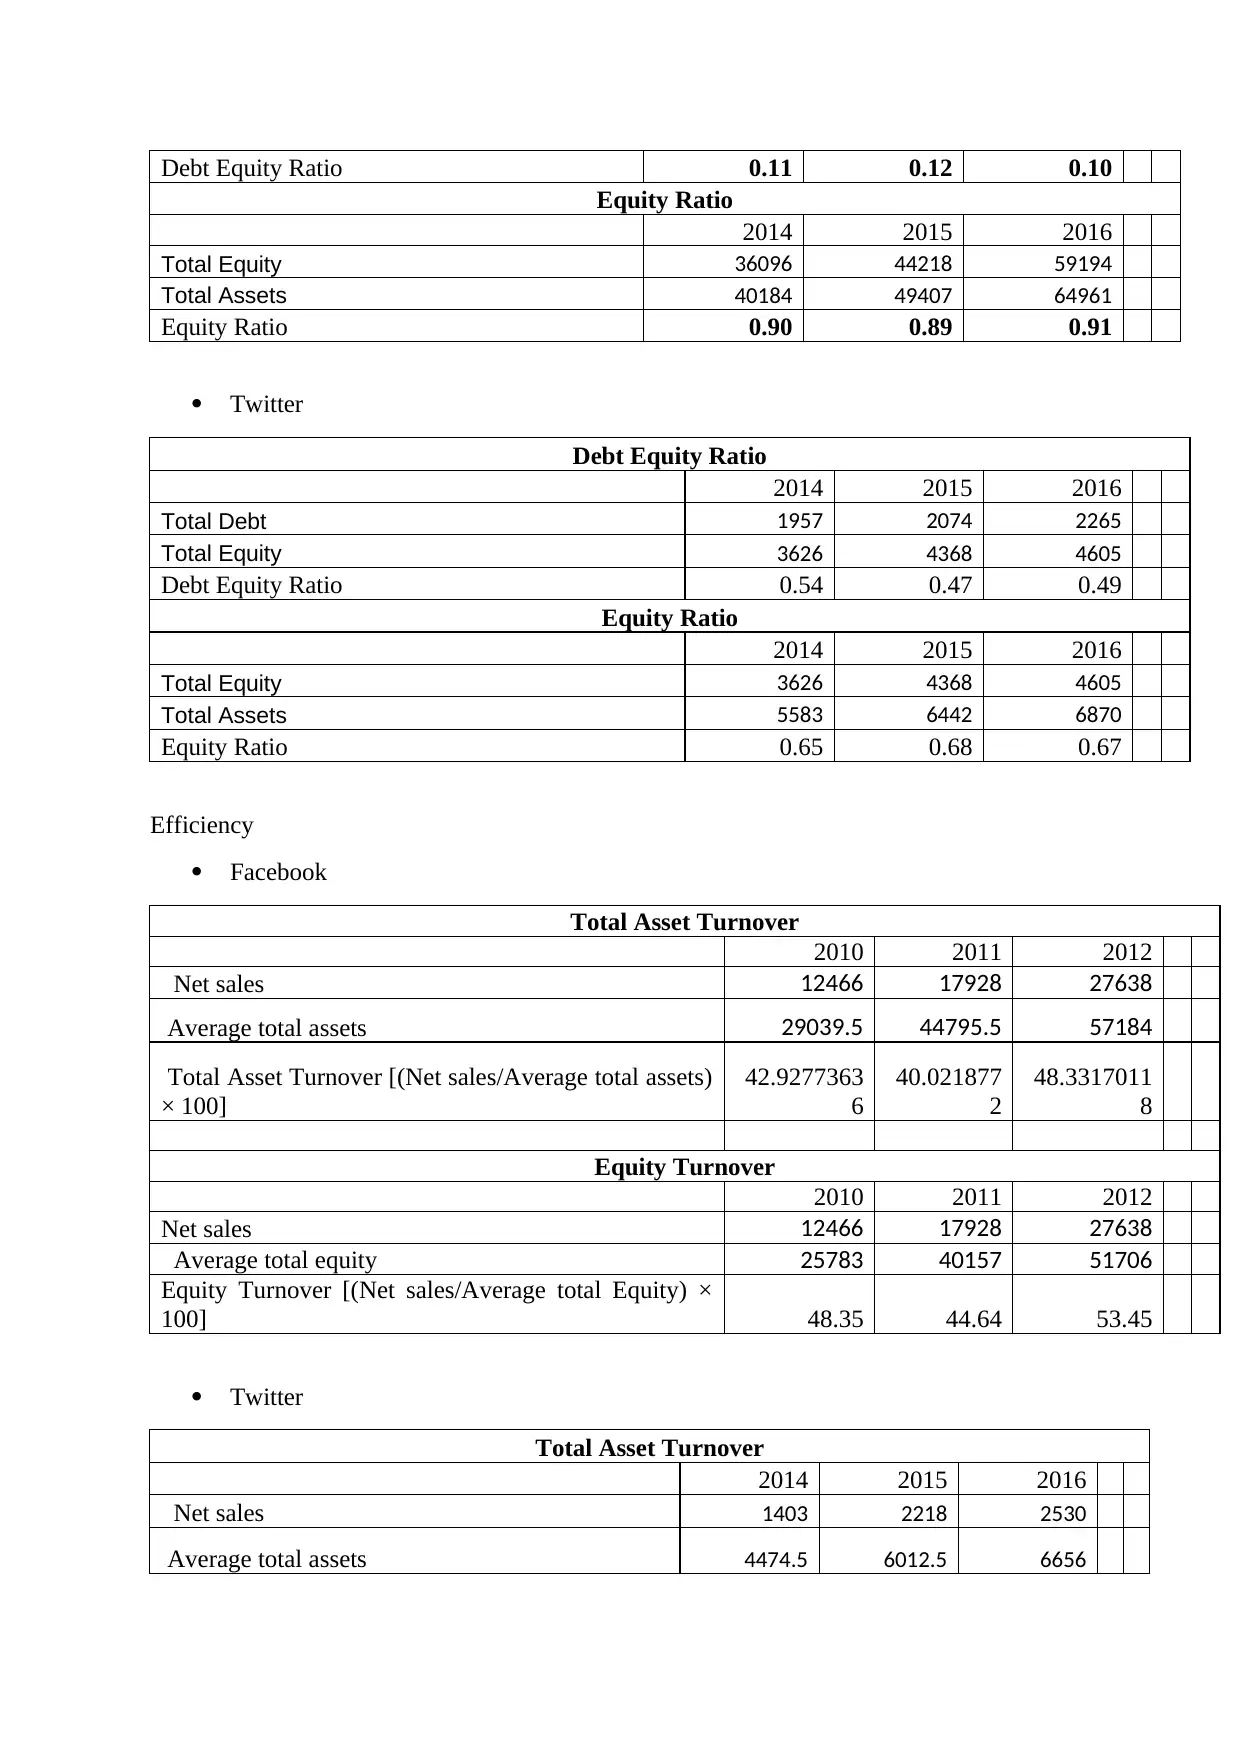
The equity ratio denotes the equity component that is needed to back up the assets of the
company. A higher equity projects the company’s ability to use the equity is an effective
ranks low to meet the short-term financial obligations when it appears. On the contrary, the
quick ratio is a measure of the liquidity of the business and evaluates the level of the assets
that can be readily converted into cash and can meet short-term liabilities. This ratio is a
better version as it excludes the concept of inventory. A higher ratio indicates that the
business has strong liquidity and optimal ratio is 1:1 meaning that current liabilities can be
honored to meet current assets without needing the requirement to sell the inventories.
As per the current ratio of Facebook, it is indicated that the company has strong liquidity as it
is more than 2:1 striking the notion that the company contains sufficient assets to honor the
obligations. However, as per the calculation, it can be seen that the ratio ranks very high
more than 10. This means that the company has huge liquidity at its disposal and should
invest elsewhere to derive more returns. Idle cash is locked up and hence, should be used as
an alternative place to generate returns. Similarly, the acid test ratio of the company is very
high indicating more liquidity but locking up of huge funds. The same is witnessed when it
comes to Twitter, the company has huge liquidity and the current, as well as quick ratio,
signifies that the obligations can be met with ease and flexibility. Both the companies have
strong liquidity position and that augurs well for both these companies. However, going by
the situation it can be said that Facebook position is more pronounced as it has a strong
profitability scenario together with high level of liquidity.
Solvency Ratio
The solvency ratio projects the long-term liability of the company and this ratio is used by
both the companies to compute expenses and the long-term liabilities. The solvency ratio of
Facebook and Twitter is done with the help of debt-equity ratio and equity ratio. The
solvency ratio compares the owner’s equity to borrowed funds. Solvency is a measurement of
the financial leverage that projects the degree to which the activities of the firm are funded by
the funds of the owner as compared to the funds of the creditor. It is even defined as Net
Gearing Ratio. A company that has a high gearing ratio is more exposed to downturns in the
business cycle as the company needs to progress to debt irrespective of how bad the sales are.
When the leverage position of a company is high, the risk level of the company is very high.
For some ratios, the level of acceptance is ascertained by comparison with other companies.
The ratio of Facebook is compared with that of Twitter. The best examples of solvency ratio
are debt-equity ratio and equity ratio. The debt-equity ratio of Facebook is low 0.10 that
means the debt capacity of the company is low. This means it has used the debt proportion to
a lower extent. Hence, Facebook is less vulnerable to risk as it has utilized the debt in a very
less proportion. On the other hand, the debt-equity ratio of Twitter is near to 0.50 that means
the company has used the debt to a considerable extent and within a permissible limit. Going
by the overall scenario, it can be said that debt component of Facebook is low as compared to
Twitter. In this scenario, it can be said that Facebook has the option to take the advantage of
debt if it requires, however, the Twitter position is not formidable as if it avails more debt it
will have a problem in discharging the obligations.
The equity ratio denotes the equity component that is needed to back up the assets of the
company. A higher equity projects the company’s ability to use the equity is an effective
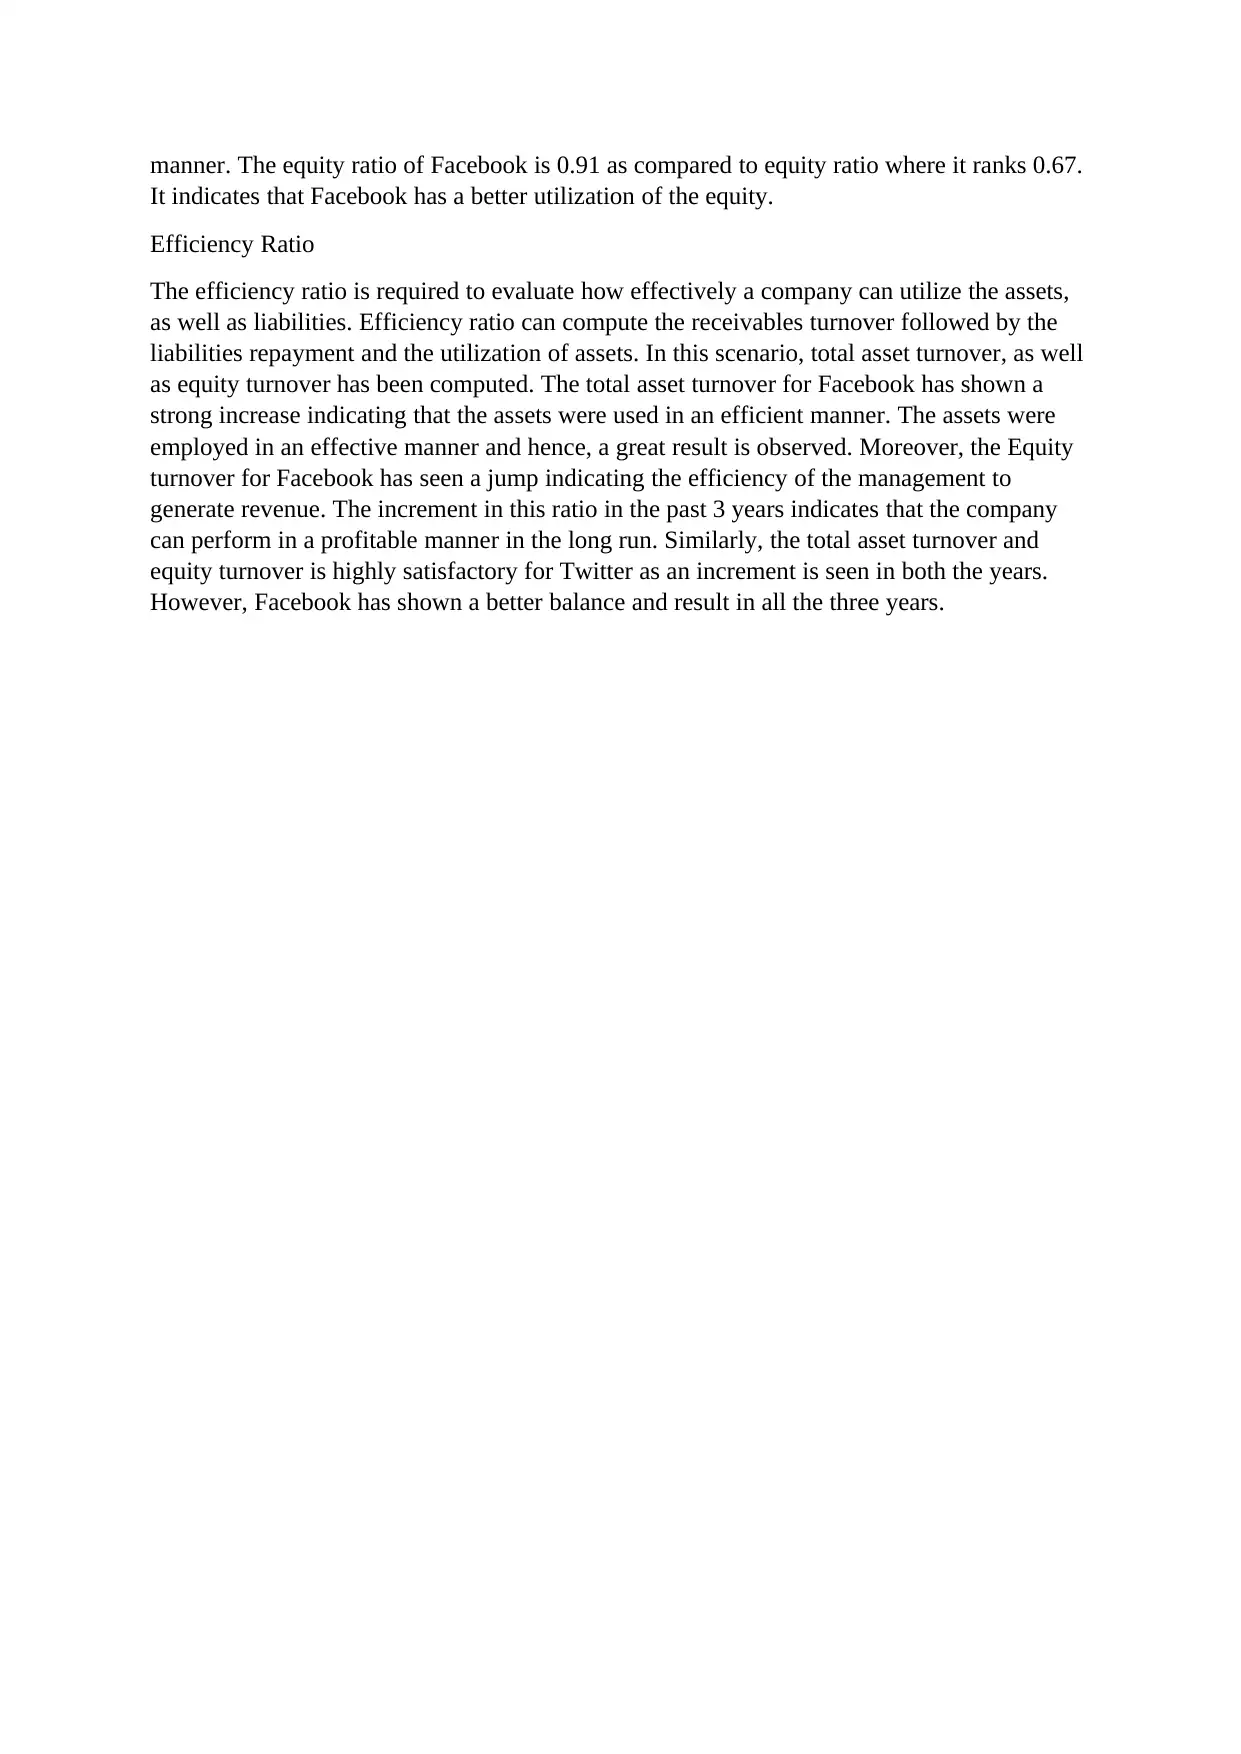
manner. The equity ratio of Facebook is 0.91 as compared to equity ratio where it ranks 0.67.
It indicates that Facebook has a better utilization of the equity.
Efficiency Ratio
The efficiency ratio is required to evaluate how effectively a company can utilize the assets,
as well as liabilities. Efficiency ratio can compute the receivables turnover followed by the
liabilities repayment and the utilization of assets. In this scenario, total asset turnover, as well
as equity turnover has been computed. The total asset turnover for Facebook has shown a
strong increase indicating that the assets were used in an efficient manner. The assets were
employed in an effective manner and hence, a great result is observed. Moreover, the Equity
turnover for Facebook has seen a jump indicating the efficiency of the management to
generate revenue. The increment in this ratio in the past 3 years indicates that the company
can perform in a profitable manner in the long run. Similarly, the total asset turnover and
equity turnover is highly satisfactory for Twitter as an increment is seen in both the years.
However, Facebook has shown a better balance and result in all the three years.
⊘ This is a preview!⊘
Do you want full access?
Subscribe today to unlock all pages.
Trusted by 1+ million students worldwide
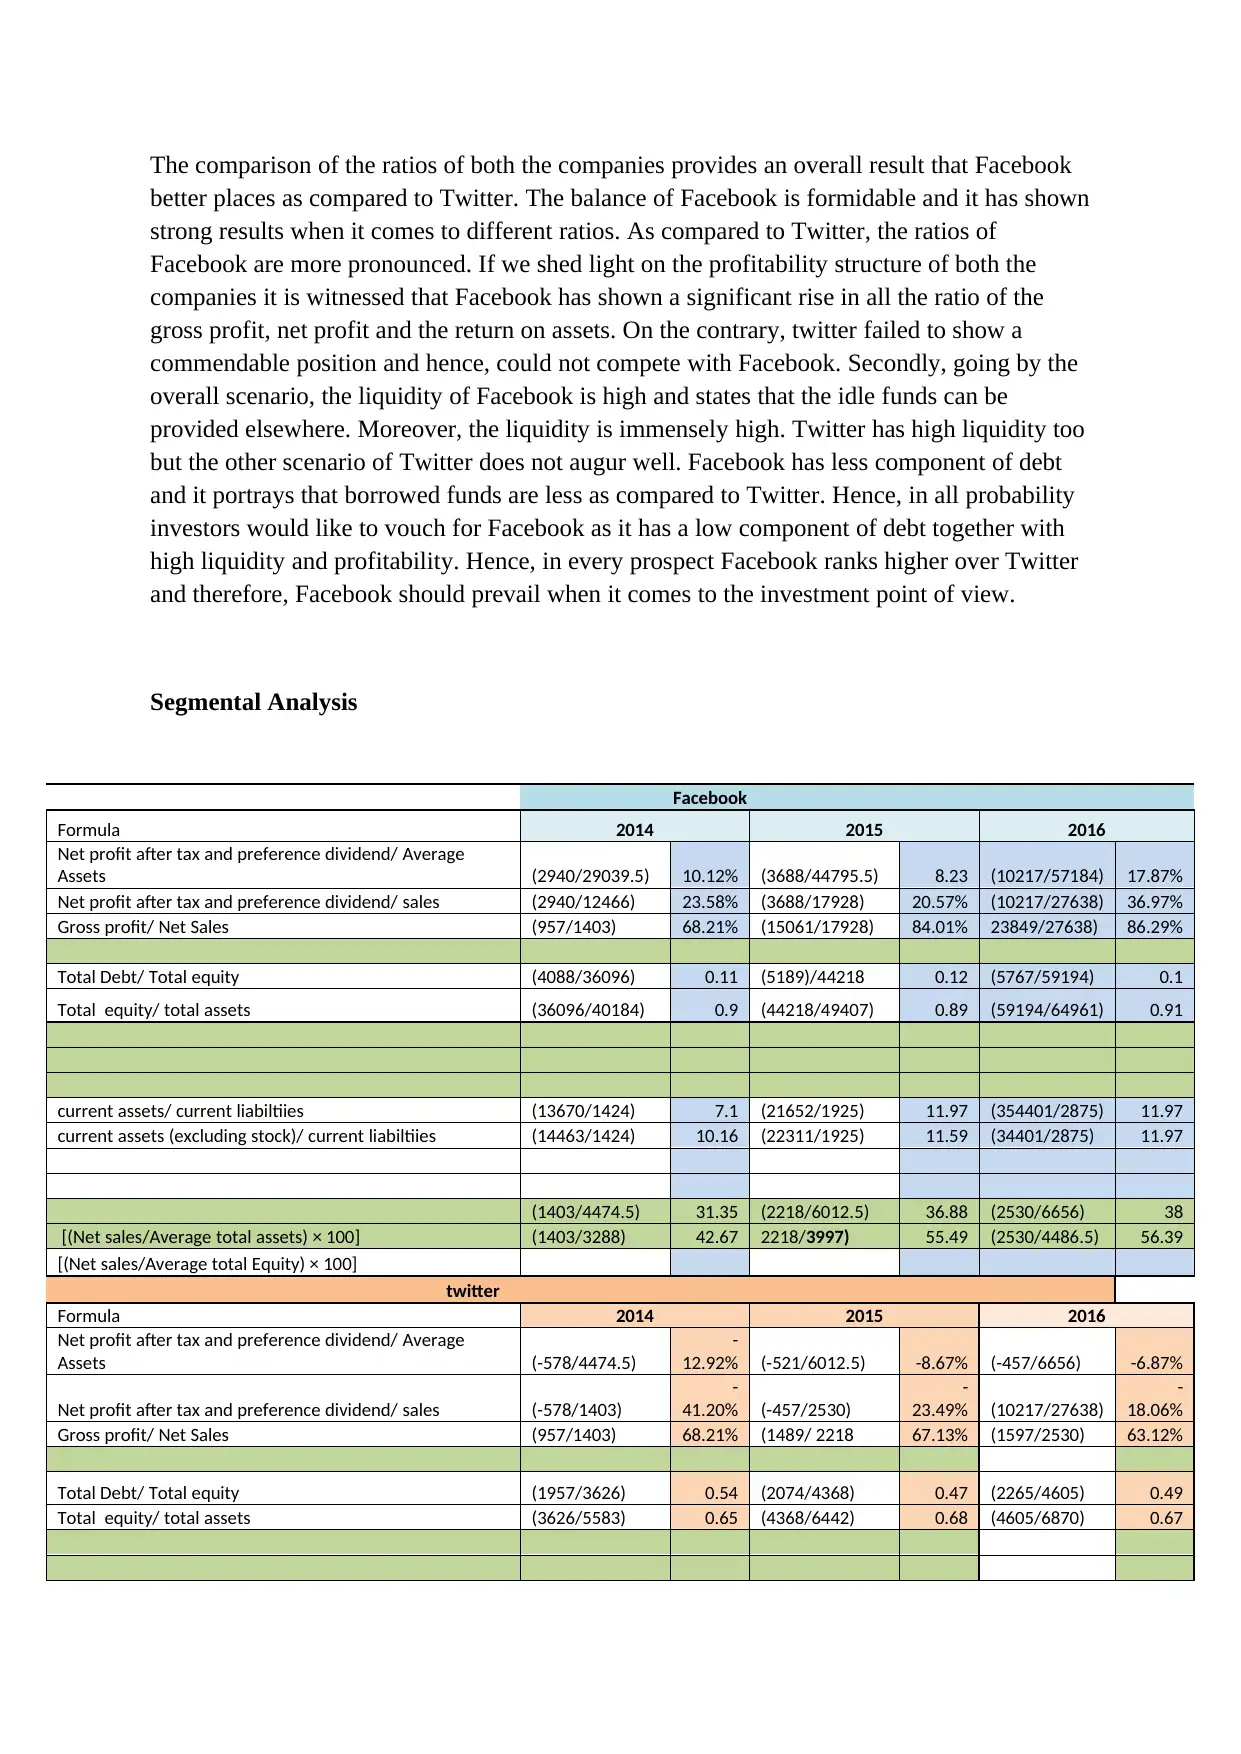
The comparison of the ratios of both the companies provides an overall result that Facebook
better places as compared to Twitter. The balance of Facebook is formidable and it has shown
strong results when it comes to different ratios. As compared to Twitter, the ratios of
Facebook are more pronounced. If we shed light on the profitability structure of both the
companies it is witnessed that Facebook has shown a significant rise in all the ratio of the
gross profit, net profit and the return on assets. On the contrary, twitter failed to show a
commendable position and hence, could not compete with Facebook. Secondly, going by the
overall scenario, the liquidity of Facebook is high and states that the idle funds can be
provided elsewhere. Moreover, the liquidity is immensely high. Twitter has high liquidity too
but the other scenario of Twitter does not augur well. Facebook has less component of debt
and it portrays that borrowed funds are less as compared to Twitter. Hence, in all probability
investors would like to vouch for Facebook as it has a low component of debt together with
high liquidity and profitability. Hence, in every prospect Facebook ranks higher over Twitter
and therefore, Facebook should prevail when it comes to the investment point of view.
Segmental Analysis
Facebook
Formula 2014 2015 2016
Net profit after tax and preference dividend/ Average
Assets (2940/29039.5) 10.12% (3688/44795.5) 8.23 (10217/57184) 17.87%
Net profit after tax and preference dividend/ sales (2940/12466) 23.58% (3688/17928) 20.57% (10217/27638) 36.97%
Gross profit/ Net Sales (957/1403) 68.21% (15061/17928) 84.01% 23849/27638) 86.29%
Total Debt/ Total equity (4088/36096) 0.11 (5189)/44218 0.12 (5767/59194) 0.1
Total equity/ total assets (36096/40184) 0.9 (44218/49407) 0.89 (59194/64961) 0.91
current assets/ current liabiltiies (13670/1424) 7.1 (21652/1925) 11.97 (354401/2875) 11.97
current assets (excluding stock)/ current liabiltiies (14463/1424) 10.16 (22311/1925) 11.59 (34401/2875) 11.97
(1403/4474.5) 31.35 (2218/6012.5) 36.88 (2530/6656) 38
[(Net sales/Average total assets) × 100] (1403/3288) 42.67 2218/3997) 55.49 (2530/4486.5) 56.39
[(Net sales/Average total Equity) × 100]
twitter
Formula 2014 2015 2016
Net profit after tax and preference dividend/ Average
Assets (-578/4474.5)
-
12.92% (-521/6012.5) -8.67% (-457/6656) -6.87%
Net profit after tax and preference dividend/ sales (-578/1403)
-
41.20% (-457/2530)
-
23.49% (10217/27638)
-
18.06%
Gross profit/ Net Sales (957/1403) 68.21% (1489/ 2218 67.13% (1597/2530) 63.12%
Total Debt/ Total equity (1957/3626) 0.54 (2074/4368) 0.47 (2265/4605) 0.49
Total equity/ total assets (3626/5583) 0.65 (4368/6442) 0.68 (4605/6870) 0.67
better places as compared to Twitter. The balance of Facebook is formidable and it has shown
strong results when it comes to different ratios. As compared to Twitter, the ratios of
Facebook are more pronounced. If we shed light on the profitability structure of both the
companies it is witnessed that Facebook has shown a significant rise in all the ratio of the
gross profit, net profit and the return on assets. On the contrary, twitter failed to show a
commendable position and hence, could not compete with Facebook. Secondly, going by the
overall scenario, the liquidity of Facebook is high and states that the idle funds can be
provided elsewhere. Moreover, the liquidity is immensely high. Twitter has high liquidity too
but the other scenario of Twitter does not augur well. Facebook has less component of debt
and it portrays that borrowed funds are less as compared to Twitter. Hence, in all probability
investors would like to vouch for Facebook as it has a low component of debt together with
high liquidity and profitability. Hence, in every prospect Facebook ranks higher over Twitter
and therefore, Facebook should prevail when it comes to the investment point of view.
Segmental Analysis
Formula 2014 2015 2016
Net profit after tax and preference dividend/ Average
Assets (2940/29039.5) 10.12% (3688/44795.5) 8.23 (10217/57184) 17.87%
Net profit after tax and preference dividend/ sales (2940/12466) 23.58% (3688/17928) 20.57% (10217/27638) 36.97%
Gross profit/ Net Sales (957/1403) 68.21% (15061/17928) 84.01% 23849/27638) 86.29%
Total Debt/ Total equity (4088/36096) 0.11 (5189)/44218 0.12 (5767/59194) 0.1
Total equity/ total assets (36096/40184) 0.9 (44218/49407) 0.89 (59194/64961) 0.91
current assets/ current liabiltiies (13670/1424) 7.1 (21652/1925) 11.97 (354401/2875) 11.97
current assets (excluding stock)/ current liabiltiies (14463/1424) 10.16 (22311/1925) 11.59 (34401/2875) 11.97
(1403/4474.5) 31.35 (2218/6012.5) 36.88 (2530/6656) 38
[(Net sales/Average total assets) × 100] (1403/3288) 42.67 2218/3997) 55.49 (2530/4486.5) 56.39
[(Net sales/Average total Equity) × 100]
Formula 2014 2015 2016
Net profit after tax and preference dividend/ Average
Assets (-578/4474.5)
-
12.92% (-521/6012.5) -8.67% (-457/6656) -6.87%
Net profit after tax and preference dividend/ sales (-578/1403)
-
41.20% (-457/2530)
-
23.49% (10217/27638)
-
18.06%
Gross profit/ Net Sales (957/1403) 68.21% (1489/ 2218 67.13% (1597/2530) 63.12%
Total Debt/ Total equity (1957/3626) 0.54 (2074/4368) 0.47 (2265/4605) 0.49
Total equity/ total assets (3626/5583) 0.65 (4368/6442) 0.68 (4605/6870) 0.67
Paraphrase This Document
Need a fresh take? Get an instant paraphrase of this document with our AI Paraphraser
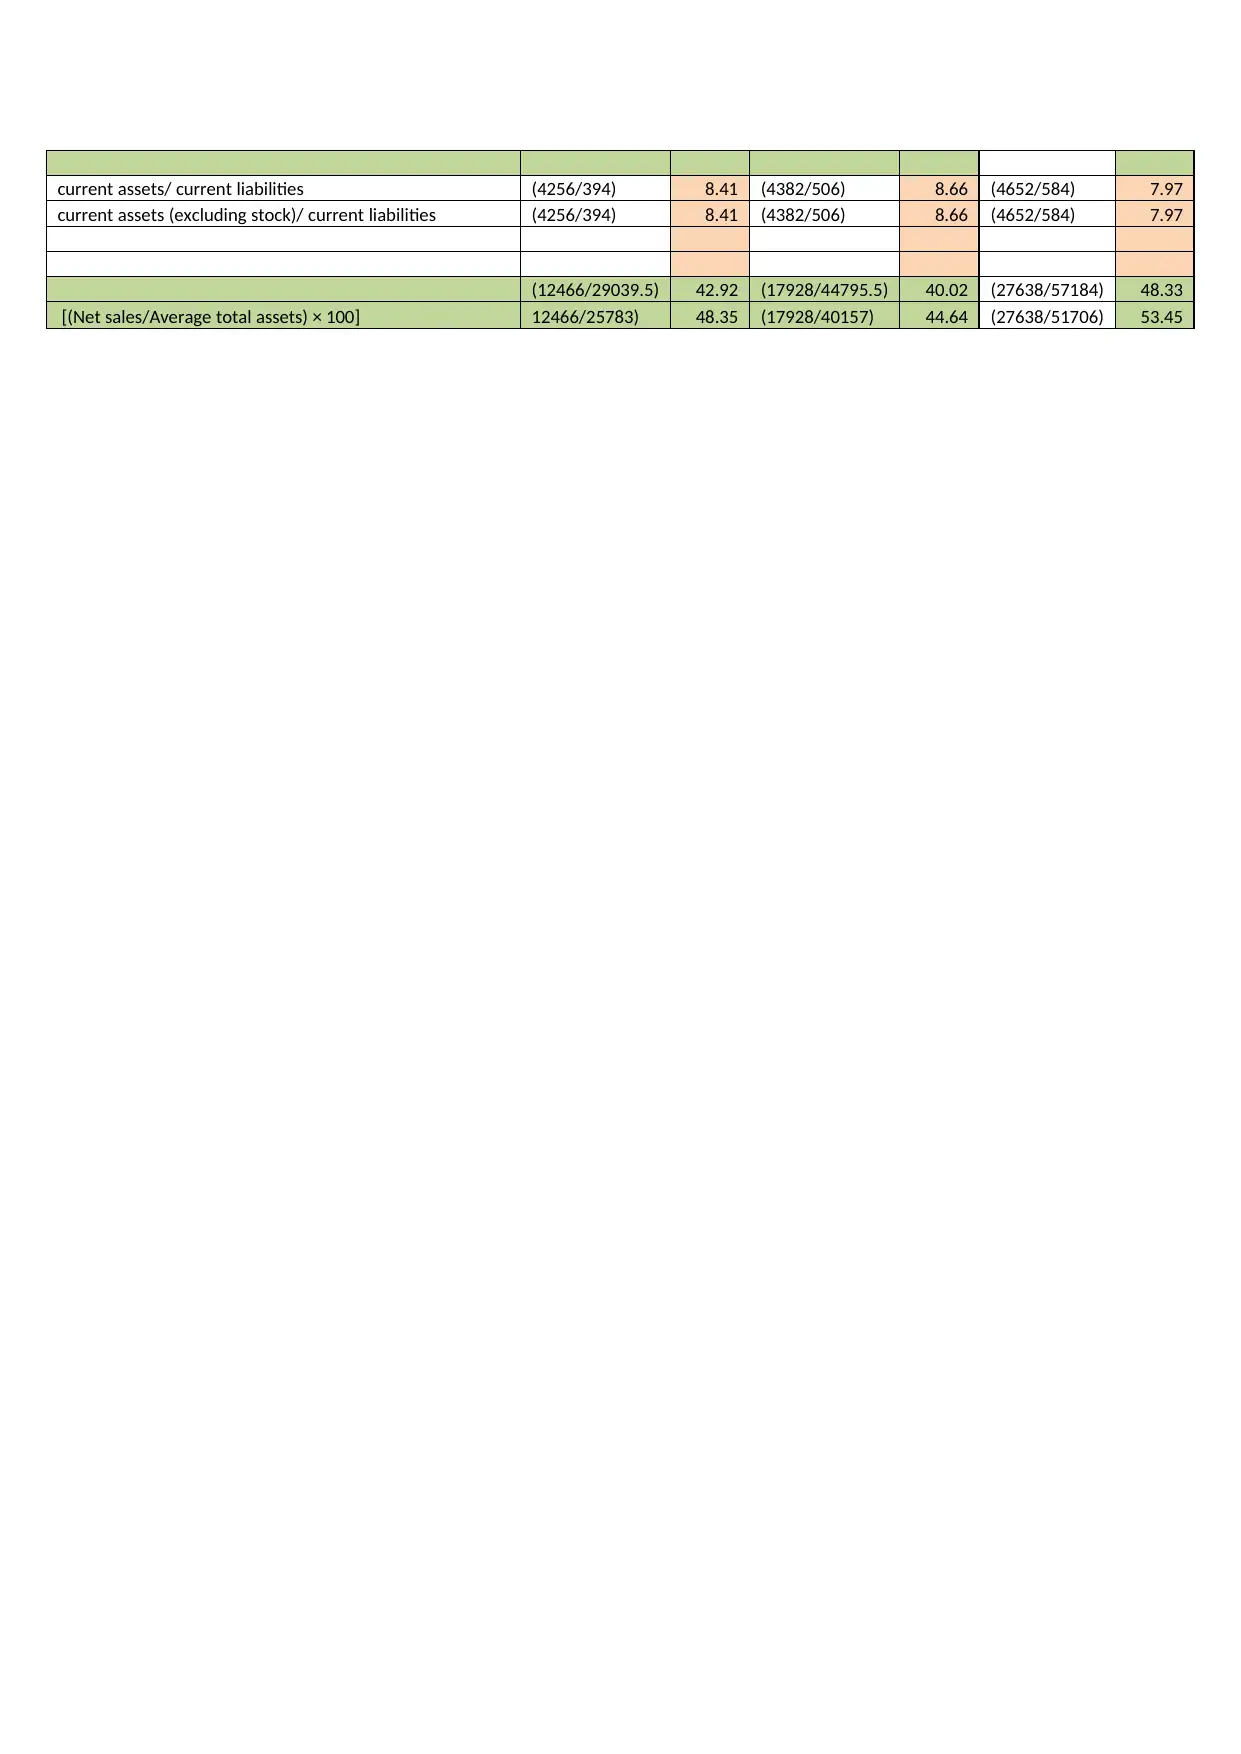
current assets/ current liabilities (4256/394) 8.41 (4382/506) 8.66 (4652/584) 7.97
current assets (excluding stock)/ current liabilities (4256/394) 8.41 (4382/506) 8.66 (4652/584) 7.97
(12466/29039.5) 42.92 (17928/44795.5) 40.02 (27638/57184) 48.33
[(Net sales/Average total assets) × 100] 12466/25783) 48.35 (17928/40157) 44.64 (27638/51706) 53.45
current assets (excluding stock)/ current liabilities (4256/394) 8.41 (4382/506) 8.66 (4652/584) 7.97
(12466/29039.5) 42.92 (17928/44795.5) 40.02 (27638/57184) 48.33
[(Net sales/Average total assets) × 100] 12466/25783) 48.35 (17928/40157) 44.64 (27638/51706) 53.45
Appendix
Profitability ratios
Facebook
Return on Assets
2014 2015 2016
Net Income 2940 3688
1021
7
Average Assets
29039.
5
44795.
5
5718
4
Return on Assets [(Net Income/Average Assets)*100] 10.12 8.23 17.87
Net Profit Margin
2014 2015 2016
Net Income 2940 3688
1021
7
Sales Revenue 12466 17928
2763
8
Net Profit Margin [(Net Profit after tax/Sales Revenue)*100] 23.58 20.57 36.97
Gross profit Margin
2014 2015 2016
Gross Income 10313 15061
2384
9
Sales Revenue 12466 17928
2763
8
Gross Profit Margin [(Gross Profit /Sales Revenue)*100] 82.73 84.01 86.29
Twitter
Return on Assets
2014 2015 2016
Net Income -578 -521 -457
Average Assets
4474.
5
6012.
5 6656
Return on Assets [(Net Income/Average Assets)*100]
-
12.92 -8.67 -6.87
Net Profit Margin
2014 2015 2016
Net Income -578 -521 -457
Sales Revenue 1403 2218 2530
Net Profit Margin [(Net Profit after tax/Sales Revenue)*100]
-
41.20
-
23.49
-
18.06
Profitability ratios
Return on Assets
2014 2015 2016
Net Income 2940 3688
1021
7
Average Assets
29039.
5
44795.
5
5718
4
Return on Assets [(Net Income/Average Assets)*100] 10.12 8.23 17.87
Net Profit Margin
2014 2015 2016
Net Income 2940 3688
1021
7
Sales Revenue 12466 17928
2763
8
Net Profit Margin [(Net Profit after tax/Sales Revenue)*100] 23.58 20.57 36.97
Gross profit Margin
2014 2015 2016
Gross Income 10313 15061
2384
9
Sales Revenue 12466 17928
2763
8
Gross Profit Margin [(Gross Profit /Sales Revenue)*100] 82.73 84.01 86.29
Return on Assets
2014 2015 2016
Net Income -578 -521 -457
Average Assets
4474.
5
6012.
5 6656
Return on Assets [(Net Income/Average Assets)*100]
-
12.92 -8.67 -6.87
Net Profit Margin
2014 2015 2016
Net Income -578 -521 -457
Sales Revenue 1403 2218 2530
Net Profit Margin [(Net Profit after tax/Sales Revenue)*100]
-
41.20
-
23.49
-
18.06
⊘ This is a preview!⊘
Do you want full access?
Subscribe today to unlock all pages.
Trusted by 1+ million students worldwide
Gross profit Margin
2014 2015 2016
Gross Income 957 1489 1597
Sales Revenue 1403 2218 2530
Gross Profit Margin [(Gross Profit /Sales Revenue)*100] 68.21 67.13 63.12
Liquidity Ratio
Facebook
Current Ratio
2014 2015 2016
Current Assets 13670 21652 34401
Current Liabilities 1424 1925 2875
Current Ratio (Current Assets/Current Liabilities) 7.10 11.97 11.97
Acid Test Ratio
2014 2015 2016
Current Assets 14463 22311 34401
Inventory 0 0 0
Current Liabilities 1424 1925 2875
Acid Test [(Current Assets-Inventory+Prepaid exp)/Current
Liabilities)] 10.16 11.59 11.97
Twitter
Current Ratio
2014 2015 2016
Current Assets 4256 4382 4652
Current Liabilities 394 506 584
Current Ratio (Current Assets/Current Liabilities) 8.41 7.97 7.97
Acid Test Ratio
2014 2015 2016
Current Assets 4256 4382 4652
Current Liabilities 394 506 584
Acid Test [(Current Assets-Inventory+Prepaid exp)/Current
Liabilities)] 10.87 8.66 7.97
Solvency
Facebook
Debt Equity Ratio
2014 2015 2016
Total Debt 4088 5189 5767
Total Equity 36096 44218 59194
2014 2015 2016
Gross Income 957 1489 1597
Sales Revenue 1403 2218 2530
Gross Profit Margin [(Gross Profit /Sales Revenue)*100] 68.21 67.13 63.12
Liquidity Ratio
Current Ratio
2014 2015 2016
Current Assets 13670 21652 34401
Current Liabilities 1424 1925 2875
Current Ratio (Current Assets/Current Liabilities) 7.10 11.97 11.97
Acid Test Ratio
2014 2015 2016
Current Assets 14463 22311 34401
Inventory 0 0 0
Current Liabilities 1424 1925 2875
Acid Test [(Current Assets-Inventory+Prepaid exp)/Current
Liabilities)] 10.16 11.59 11.97
Current Ratio
2014 2015 2016
Current Assets 4256 4382 4652
Current Liabilities 394 506 584
Current Ratio (Current Assets/Current Liabilities) 8.41 7.97 7.97
Acid Test Ratio
2014 2015 2016
Current Assets 4256 4382 4652
Current Liabilities 394 506 584
Acid Test [(Current Assets-Inventory+Prepaid exp)/Current
Liabilities)] 10.87 8.66 7.97
Solvency
Debt Equity Ratio
2014 2015 2016
Total Debt 4088 5189 5767
Total Equity 36096 44218 59194
Paraphrase This Document
Need a fresh take? Get an instant paraphrase of this document with our AI Paraphraser
Debt Equity Ratio 0.11 0.12 0.10
Equity Ratio
2014 2015 2016
Total Equity 36096 44218 59194
Total Assets 40184 49407 64961
Equity Ratio 0.90 0.89 0.91
Twitter
Debt Equity Ratio
2014 2015 2016
Total Debt 1957 2074 2265
Total Equity 3626 4368 4605
Debt Equity Ratio 0.54 0.47 0.49
Equity Ratio
2014 2015 2016
Total Equity 3626 4368 4605
Total Assets 5583 6442 6870
Equity Ratio 0.65 0.68 0.67
Efficiency
Facebook
Total Asset Turnover
2010 2011 2012
Net sales 12466 17928 27638
Average total assets 29039.5 44795.5 57184
Total Asset Turnover [(Net sales/Average total assets)
× 100]
42.9277363
6
40.021877
2
48.3317011
8
Equity Turnover
2010 2011 2012
Net sales 12466 17928 27638
Average total equity 25783 40157 51706
Equity Turnover [(Net sales/Average total Equity) ×
100] 48.35 44.64 53.45
Twitter
Total Asset Turnover
2014 2015 2016
Net sales 1403 2218 2530
Average total assets 4474.5 6012.5 6656
Equity Ratio
2014 2015 2016
Total Equity 36096 44218 59194
Total Assets 40184 49407 64961
Equity Ratio 0.90 0.89 0.91
Debt Equity Ratio
2014 2015 2016
Total Debt 1957 2074 2265
Total Equity 3626 4368 4605
Debt Equity Ratio 0.54 0.47 0.49
Equity Ratio
2014 2015 2016
Total Equity 3626 4368 4605
Total Assets 5583 6442 6870
Equity Ratio 0.65 0.68 0.67
Efficiency
Total Asset Turnover
2010 2011 2012
Net sales 12466 17928 27638
Average total assets 29039.5 44795.5 57184
Total Asset Turnover [(Net sales/Average total assets)
× 100]
42.9277363
6
40.021877
2
48.3317011
8
Equity Turnover
2010 2011 2012
Net sales 12466 17928 27638
Average total equity 25783 40157 51706
Equity Turnover [(Net sales/Average total Equity) ×
100] 48.35 44.64 53.45
Total Asset Turnover
2014 2015 2016
Net sales 1403 2218 2530
Average total assets 4474.5 6012.5 6656
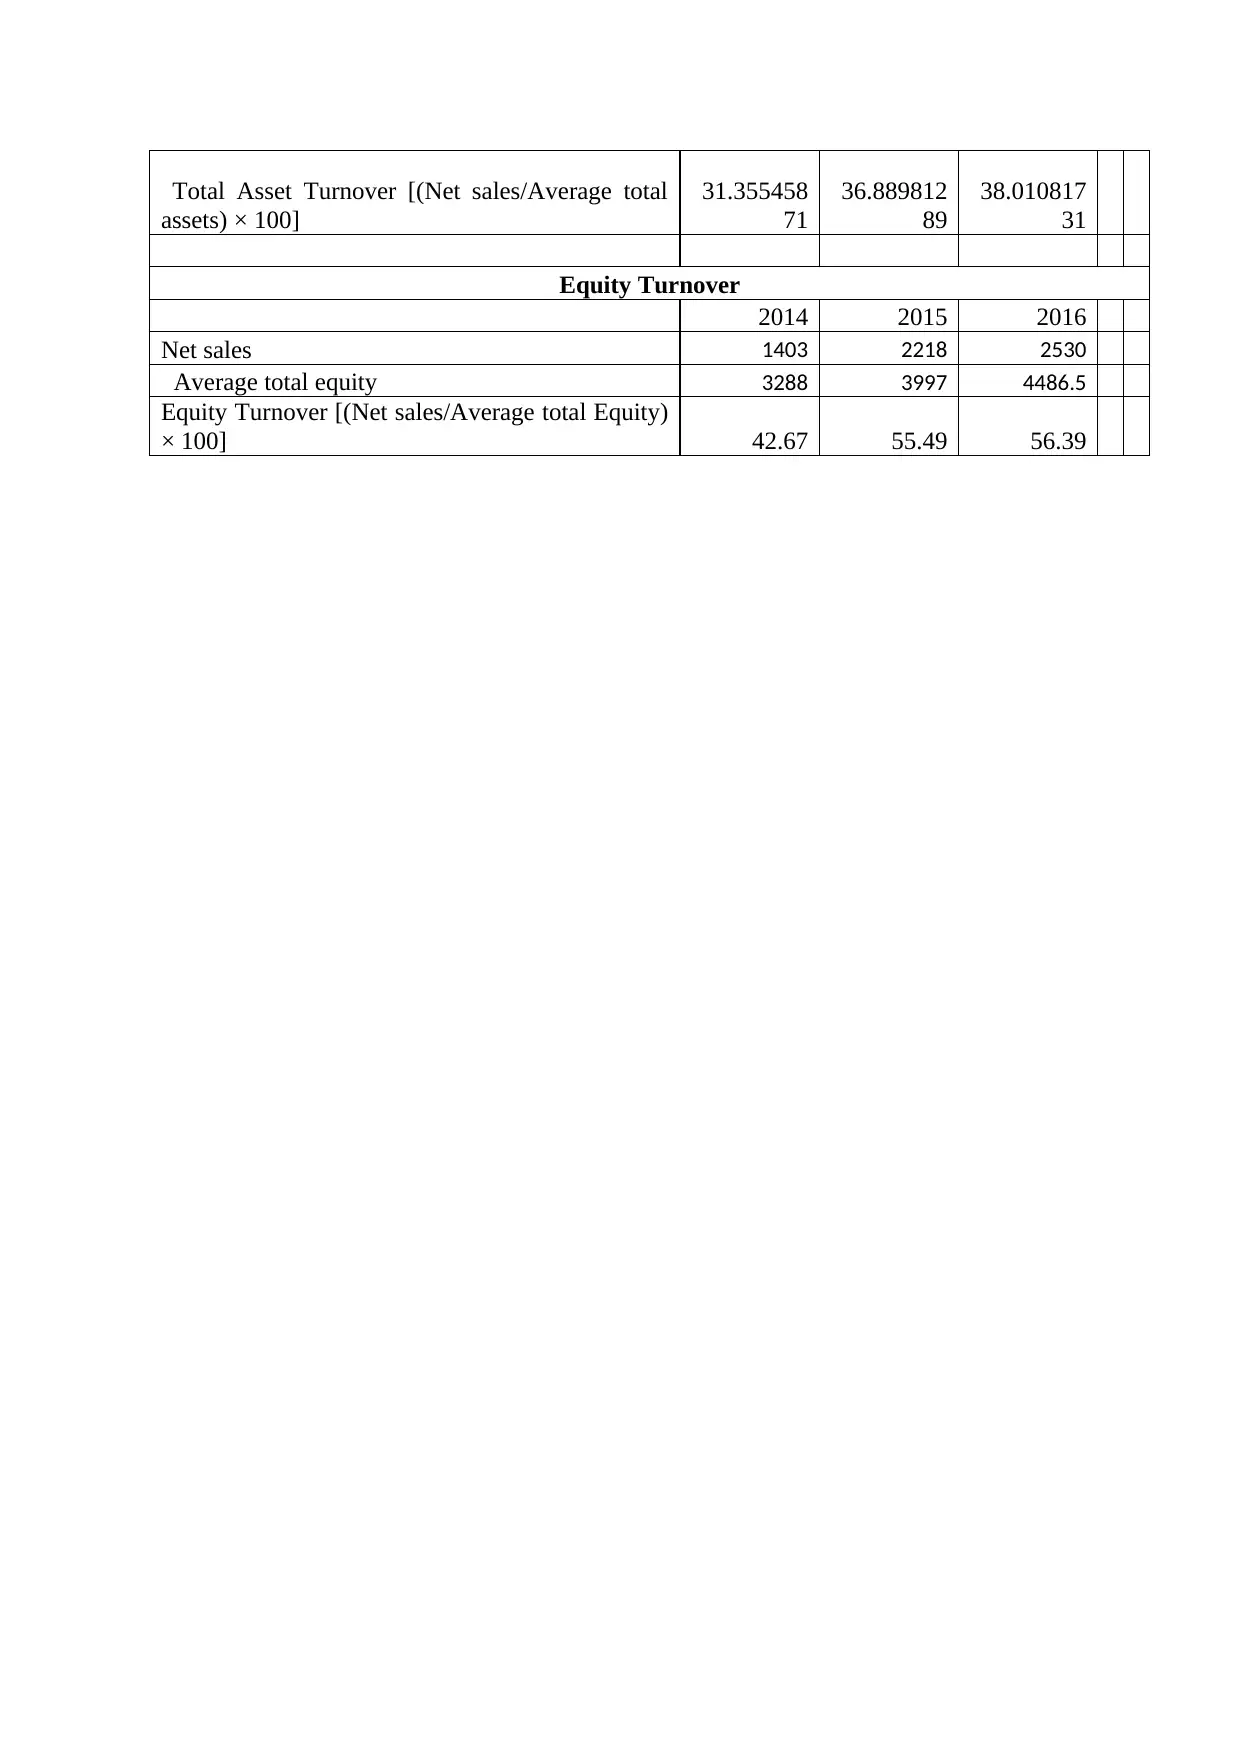
Total Asset Turnover [(Net sales/Average total
assets) × 100]
31.355458
71
36.889812
89
38.010817
31
Equity Turnover
2014 2015 2016
Net sales 1403 2218 2530
Average total equity 3288 3997 4486.5
Equity Turnover [(Net sales/Average total Equity)
× 100] 42.67 55.49 56.39
assets) × 100]
31.355458
71
36.889812
89
38.010817
31
Equity Turnover
2014 2015 2016
Net sales 1403 2218 2530
Average total equity 3288 3997 4486.5
Equity Turnover [(Net sales/Average total Equity)
× 100] 42.67 55.49 56.39
⊘ This is a preview!⊘
Do you want full access?
Subscribe today to unlock all pages.
Trusted by 1+ million students worldwide
1 out of 9
Related Documents


Your All-in-One AI-Powered Toolkit for Academic Success.
+13062052269
info@desklib.com
Available 24*7 on WhatsApp / Email
![[object Object]](/_next/static/media/star-bottom.7253800d.svg)
Unlock your academic potential
Copyright © 2020–2026 A2Z Services. All Rights Reserved. Developed and managed by ZUCOL.