Corporate Finance Strategy Assignment: Risk, Cost of Capital, and M-M
VerifiedAdded on 2022/09/07
|9
|1217
|17
Homework Assignment
AI Summary
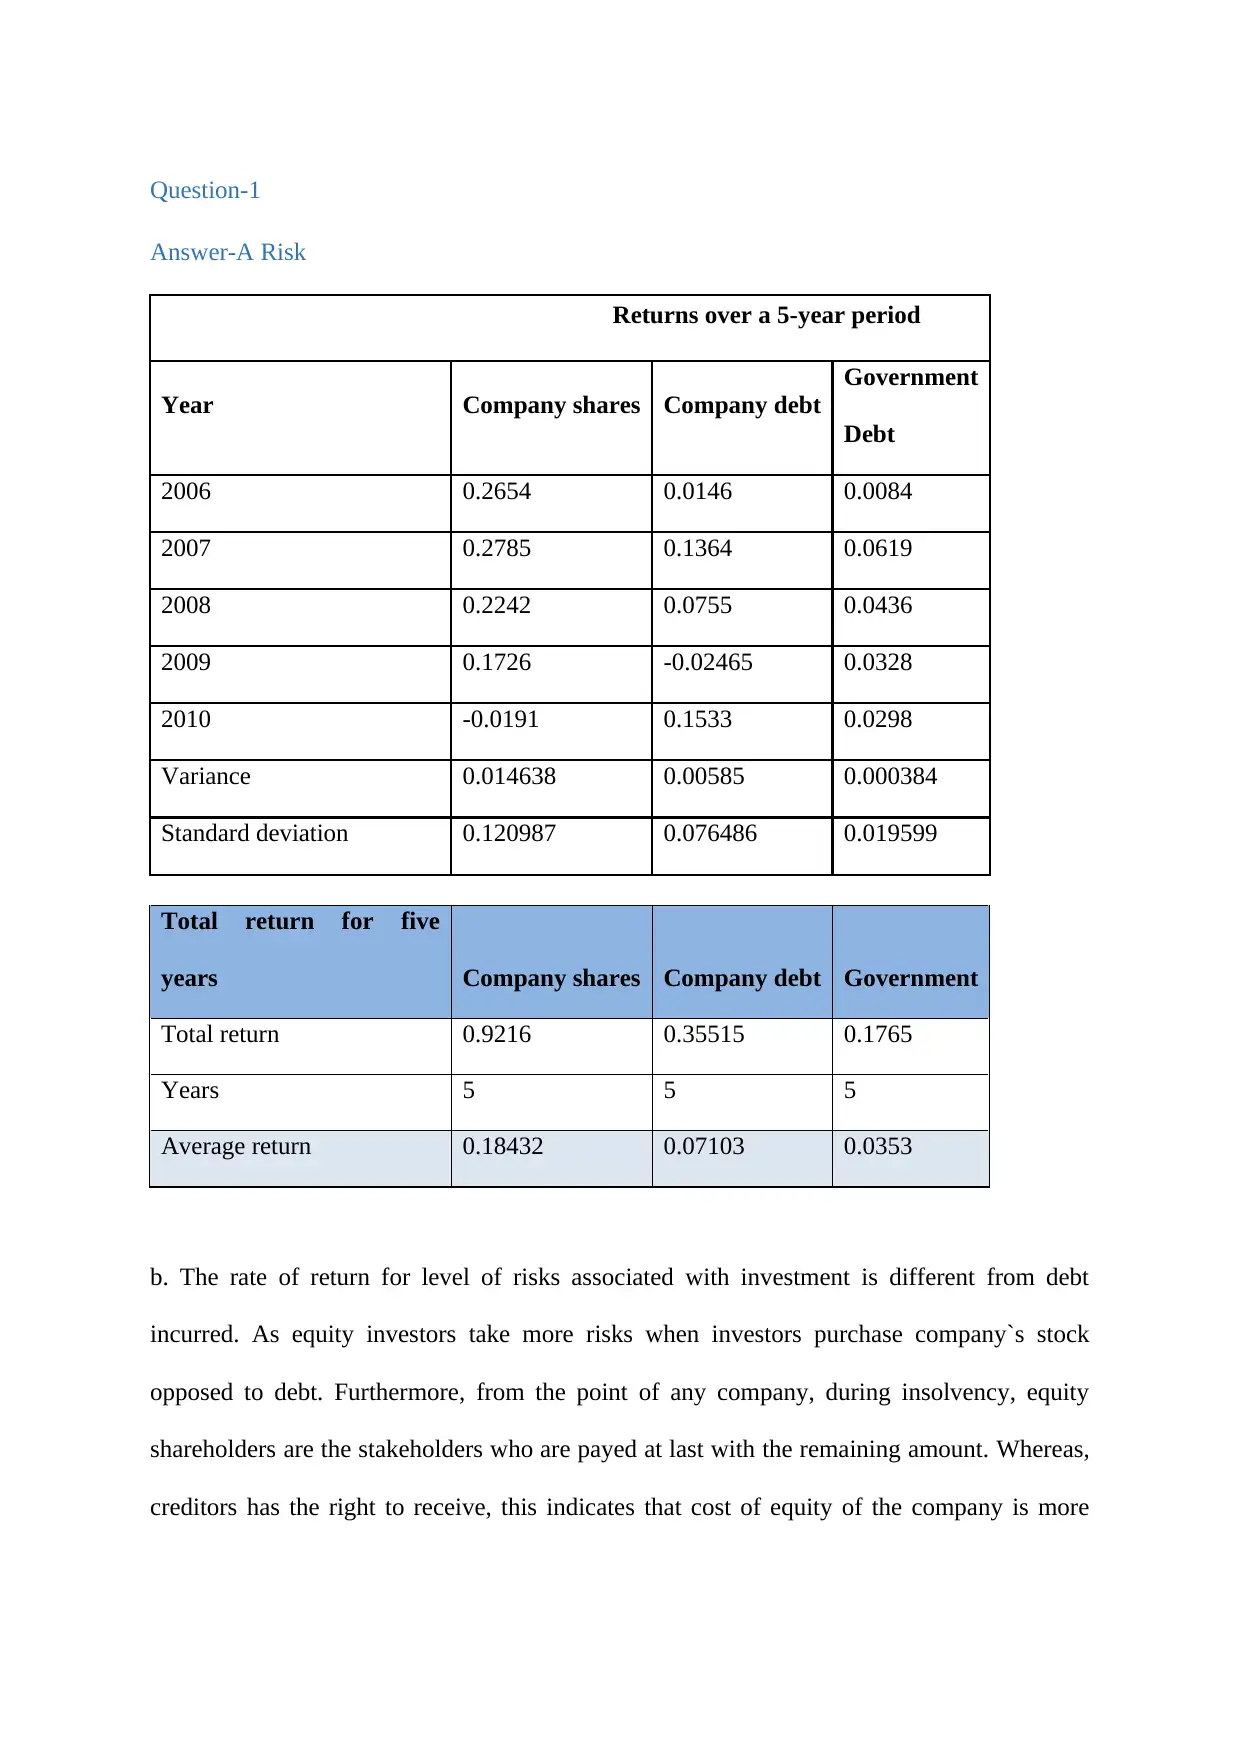
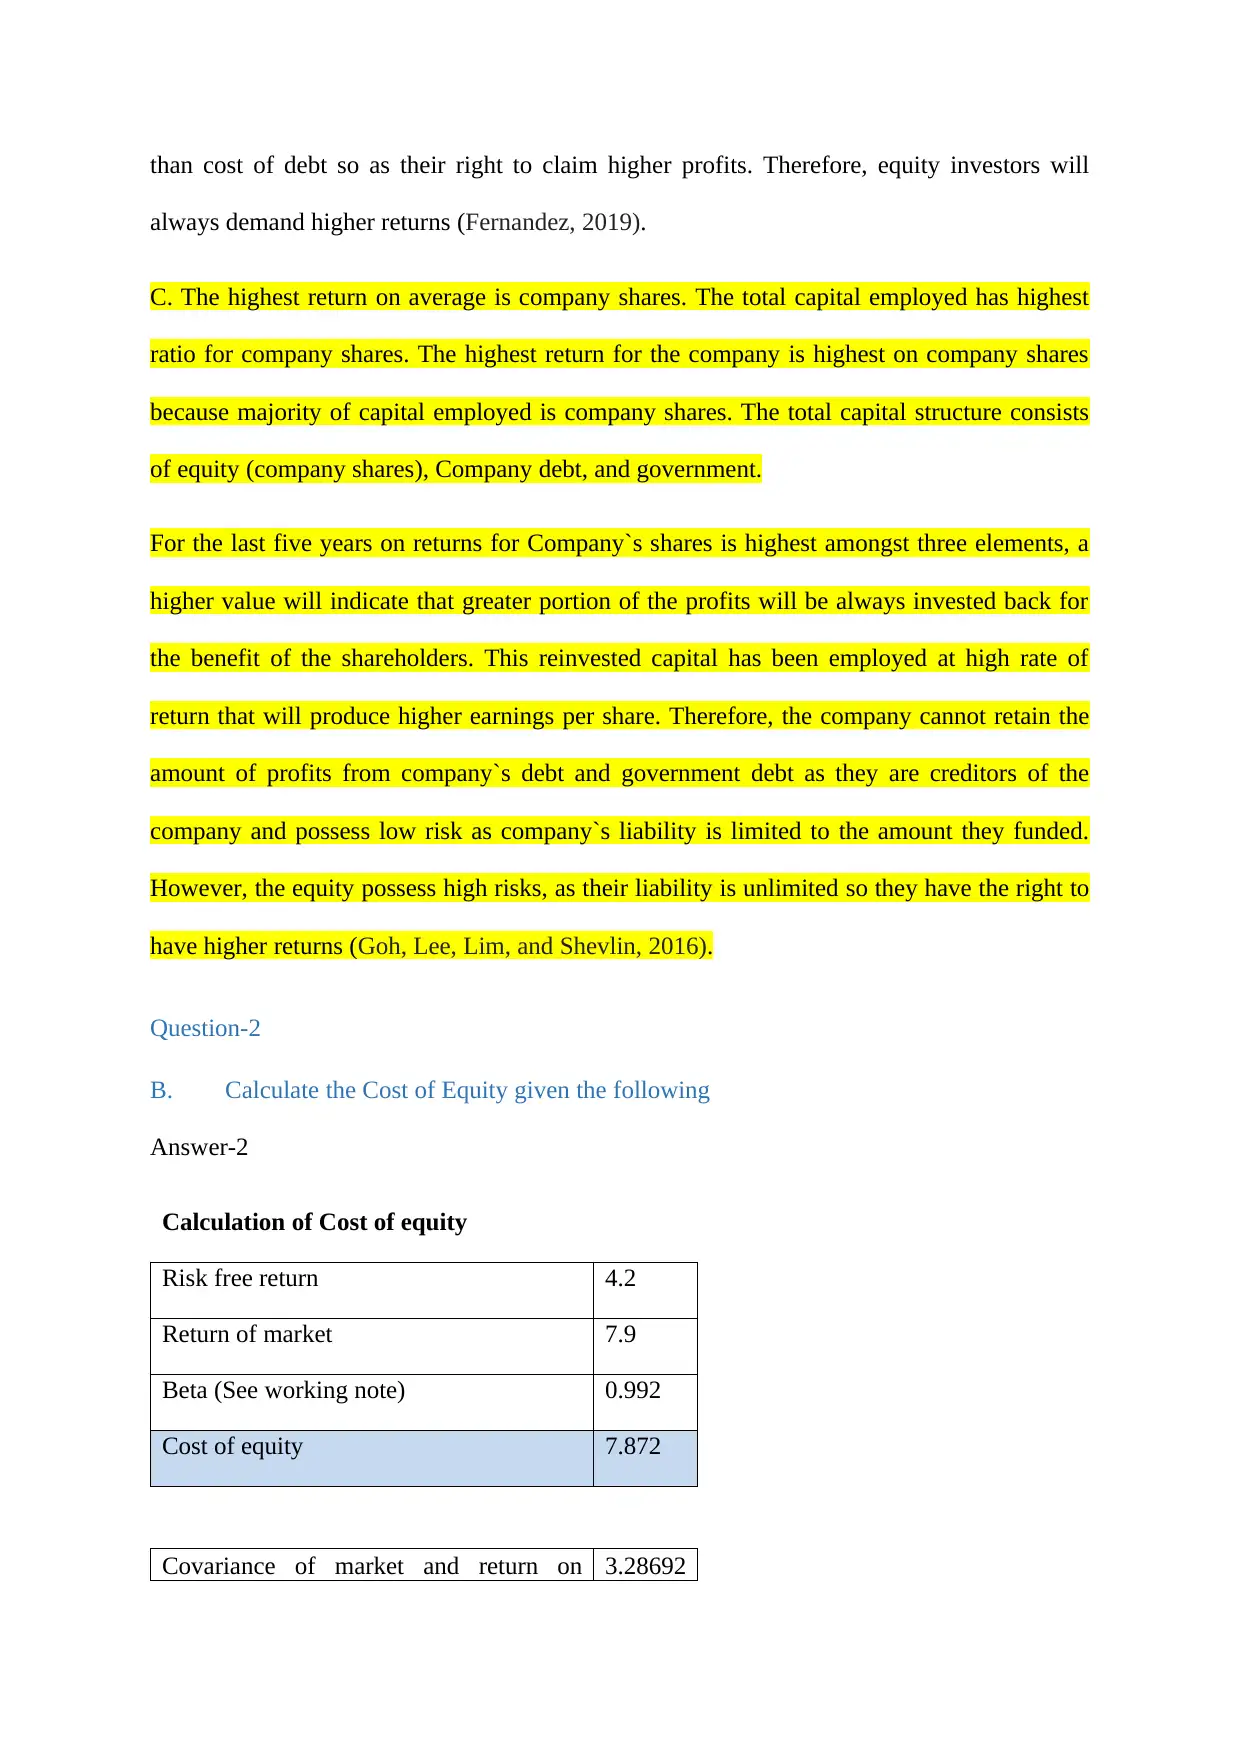
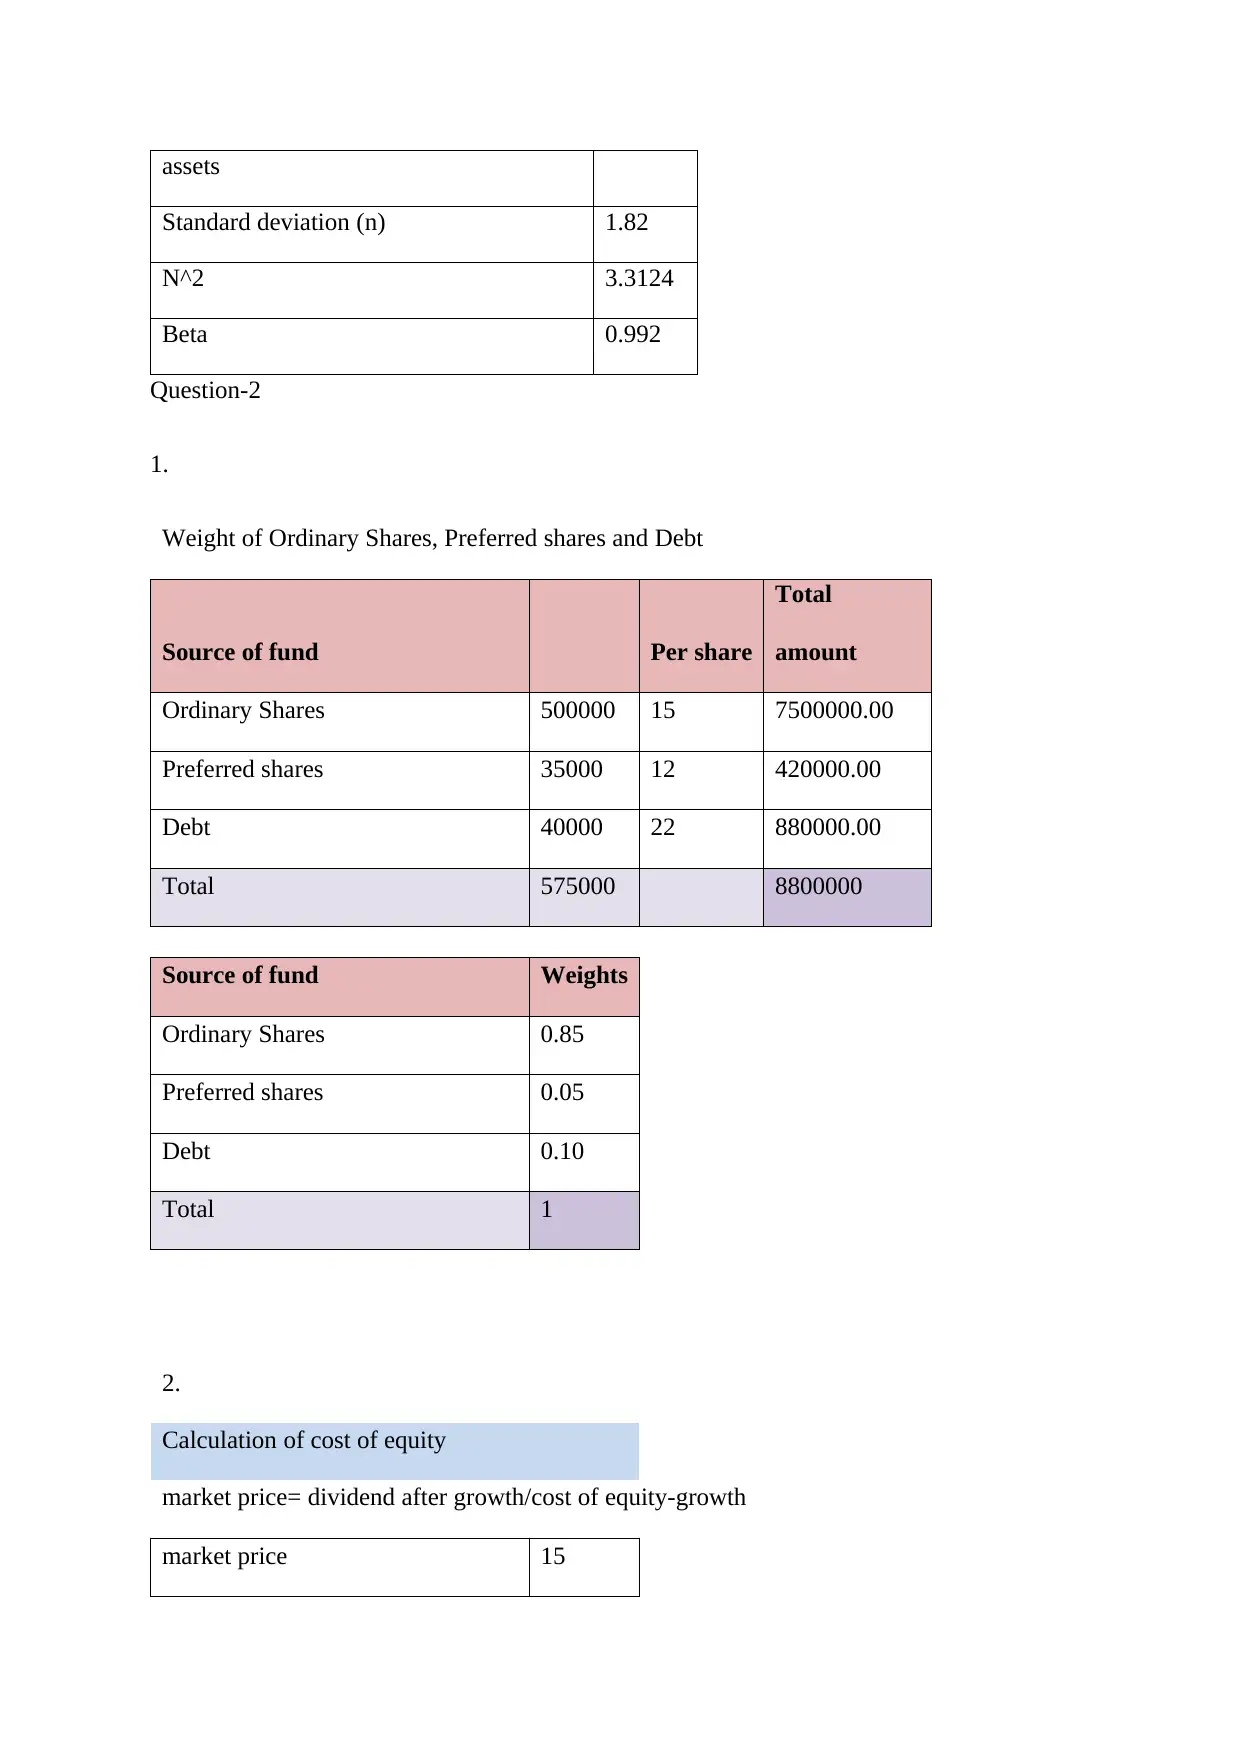
This document provides a comprehensive solution to a corporate finance assignment. It begins by analyzing risk, calculating average returns for company shares, debt, and government debt, and explaining why equity returns should be higher than debt returns. The assignment then delves into calculating the cost of equity using the Capital Asset Pricing Model (CAPM) and determining the cost of capital for a company with ordinary shares, preference shares, and debt, including the Weighted Average Cost of Capital (WACC). Finally, the assignment explores the Modigliani-Miller (M-M) theory on capital structure, discussing its relevance, assumptions, and implications for financing decisions, including the impact of debt and equity proportions and the effects of dividend policies and tax benefits. The solution is supported by relevant academic references.

CORPORATE FINANCE
STRATEGY
STRATEGY
Paraphrase This Document
Need a fresh take? Get an instant paraphrase of this document with our AI Paraphraser

Contents
Question-1.............................................................................................................................................3
Answer-A Risk..................................................................................................................................3
Question-2.............................................................................................................................................4
B. Calculate the Cost of Equity given the following......................................................................4
Question-3.............................................................................................................................................6
References.............................................................................................................................................8

Question-1
Answer-A Risk
Returns over a 5-year period
Year Company shares Company debt
Government
Debt
2006 0.2654 0.0146 0.0084
2007 0.2785 0.1364 0.0619
2008 0.2242 0.0755 0.0436
2009 0.1726 -0.02465 0.0328
2010 -0.0191 0.1533 0.0298
Variance 0.014638 0.00585 0.000384
Standard deviation 0.120987 0.076486 0.019599
Total return for five
years Company shares Company debt Government
Total return 0.9216 0.35515 0.1765
Years 5 5 5
Average return 0.18432 0.07103 0.0353
b. The rate of return for level of risks associated with investment is different from debt
incurred. As equity investors take more risks when investors purchase company`s stock
opposed to debt. Furthermore, from the point of any company, during insolvency, equity
shareholders are the stakeholders who are payed at last with the remaining amount. Whereas,
creditors has the right to receive, this indicates that cost of equity of the company is more
⊘ This is a preview!⊘
Do you want full access?
Subscribe today to unlock all pages.

Trusted by 1+ million students worldwide

than cost of debt so as their right to claim higher profits. Therefore, equity investors will
always demand higher returns (Fernandez, 2019).
C. The highest return on average is company shares. The total capital employed has highest
ratio for company shares. The highest return for the company is highest on company shares
because majority of capital employed is company shares. The total capital structure consists
of equity (company shares), Company debt, and government.
For the last five years on returns for Company`s shares is highest amongst three elements, a
higher value will indicate that greater portion of the profits will be always invested back for
the benefit of the shareholders. This reinvested capital has been employed at high rate of
return that will produce higher earnings per share. Therefore, the company cannot retain the
amount of profits from company`s debt and government debt as they are creditors of the
company and possess low risk as company`s liability is limited to the amount they funded.
However, the equity possess high risks, as their liability is unlimited so they have the right to
have higher returns (Goh, Lee, Lim, and Shevlin, 2016).
Question-2
B. Calculate the Cost of Equity given the following
Answer-2
Calculation of Cost of equity
Risk free return 4.2
Return of market 7.9
Beta (See working note) 0.992
Cost of equity 7.872
Covariance of market and return on 3.28692
Paraphrase This Document
Need a fresh take? Get an instant paraphrase of this document with our AI Paraphraser

assets
Standard deviation (n) 1.82
N^2 3.3124
Beta 0.992
Question-2
1.
Weight of Ordinary Shares, Preferred shares and Debt
Source of fund Per share
Total
amount
Ordinary Shares 500000 15 7500000.00
Preferred shares 35000 12 420000.00
Debt 40000 22 880000.00
Total 575000 8800000
Source of fund Weights
Ordinary Shares 0.85
Preferred shares 0.05
Debt 0.10
Total 1
2.
Calculation of cost of equity
market price= dividend after growth/cost of equity-growth
market price 15

Dividend (D1) 2.1735
Growth 0.05
1.4235
Cost of equity 9.49%
3.
calculation of cost Preference shares
Preference dividend 4.07%
market price 12
Cost of Preference shares 33.92%
4.
calculation of Debt
Given 4.8%
Corporate tax 15%
Cost of debt 4.08%
5.
Calculation of WACC
Weight of Cost of equity 711750
Weight of cost of Preference
shares 142450
Weight of cost of debt 35904
Total 890104
total source of fund 8800000
Weighted WACC 10%
⊘ This is a preview!⊘
Do you want full access?
Subscribe today to unlock all pages.

Trusted by 1+ million students worldwide

Question-3
1.
a. According to M-M theory, deciding the proportion for 100 billion yen is irrelevant as
to finance its operations and assets, the company can use either equal proportion or
different proportion of debt and equity. Every set of capital structure has its both
disadvantages and advantages. This theory suggest that there is no floatation cost and
transaction costs in the market and the market is based on perfect competition.
According to m-m theory, capital structure does not influence the value of the
organisation (Fernandez, 2019). There is a condition that if the company does not
disclose any dividend then it has to face penalties. Financial leverage is related to
proportion of cost of equity. This theory identifies tax benefits as accrued by the
interest incurring. Cost of actual debt is less than the nominal cost of debt. This theory
does not suggest any particular criteria is setting the proportion of capital structure.
The impact of this theory will lead to adopt the debt capital by considering that it is
irrelevant to decide any particular proportion (Andreasen, Schindler, and Valenzuela,
2019).
b. While considering the debt in the astatic, it is seen that profitable organisations will
face taxable earnings where the benefit can be more from debt tax shields. This
concept reveals that the proportion of cost of equity and cost of debt must be equal
(Goh et al., 2016). Further, it shows that the proportion of cost of debt must be equal
to tax shields made on interests.
2.
Paraphrase This Document
Need a fresh take? Get an instant paraphrase of this document with our AI Paraphraser

Additional equity financing can increase the number of outstanding securities. The outcome
will then dilute value of stock for the current shareholders so as the power of each
shareholder (Abeywardhana, 2017). Issuing new shares can further lead to selling to stock
especially when the company has been suffering from interests and struggle financially (Butt,
2019). The share price will dilute and it will weaken the share price (rusov et al., 2018).

References
Fernandez, P., 2019. WACC and CAPM according to Utilities Regulators: Confusions,
Errors, and Inconsistencies. Errors and Inconsistencies (February 1, 2019).
Andreasen, E., Schindler, M. and Valenzuela, P., 2019. Capital controls and the cost of
debt. IMF Economic Review, 67(2), pp.288-314.
Goh, B.W., Lee, J., Lim, C.Y. and Shevlin, T., 2016. The effect of corporate tax avoidance on
the cost of equity. The Accounting Review, 91(6), pp.1647-1670.
Yapa Abeywardhana, D., 2017. Capital structure theory: An overview. Accounting and
finance research, 6(1).
Brusov, P., Filatova, T., Orekhova, N. and Eskindarov, M., 2018. Capital Structure:
Modigliani–Miller Theory. In Modern Corporate Finance, Investments, Taxation and
Ratings (pp. 9-27). Springer, Cham.
Krstevska, A., Nenovski, T. and Pogacnik Kostovska, K., 2017. Testing the Modigliani and
Miller theory in practice: Evidence from the Macedonian banking system. Eastern European
Economics, 55(3), pp.277-289.
Butt, U., 2019. Testing the Static Trade-Off Theory of Capital Structure: A Corporate
Governance Perspective. Theoretical Economics Letters, 9(7), pp.2236-2261.
⊘ This is a preview!⊘
Do you want full access?
Subscribe today to unlock all pages.

Trusted by 1+ million students worldwide
1 out of 9
Related Documents

Your All-in-One AI-Powered Toolkit for Academic Success.
+13062052269
info@desklib.com
Available 24*7 on WhatsApp / Email
Unlock your academic potential
Copyright © 2020–2025 A2Z Services. All Rights Reserved. Developed and managed by ZUCOL.