Finance Assignment: Calculating WACC and Intrinsic Value - FY2013 Data

Verified

Added on  2020/04/21

|5
|591
|147
Homework Assignment
AI Summary
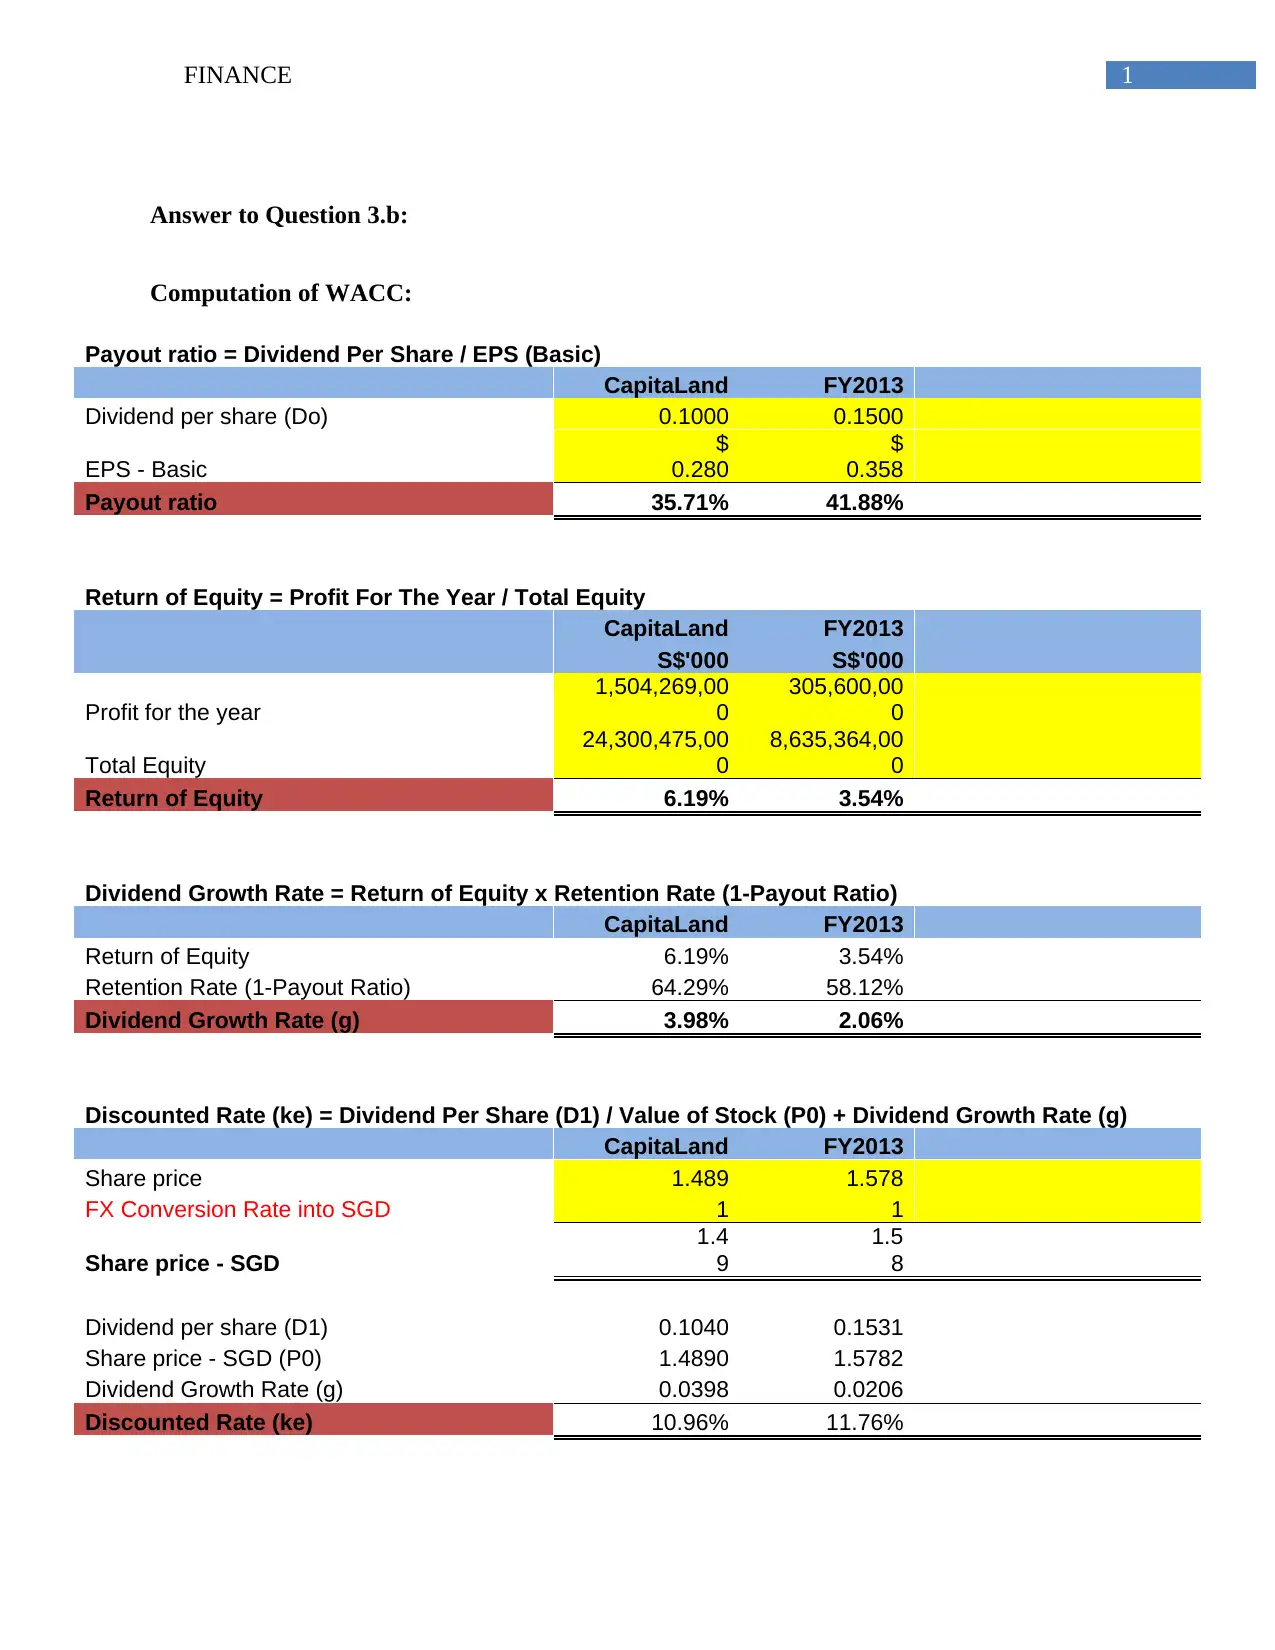
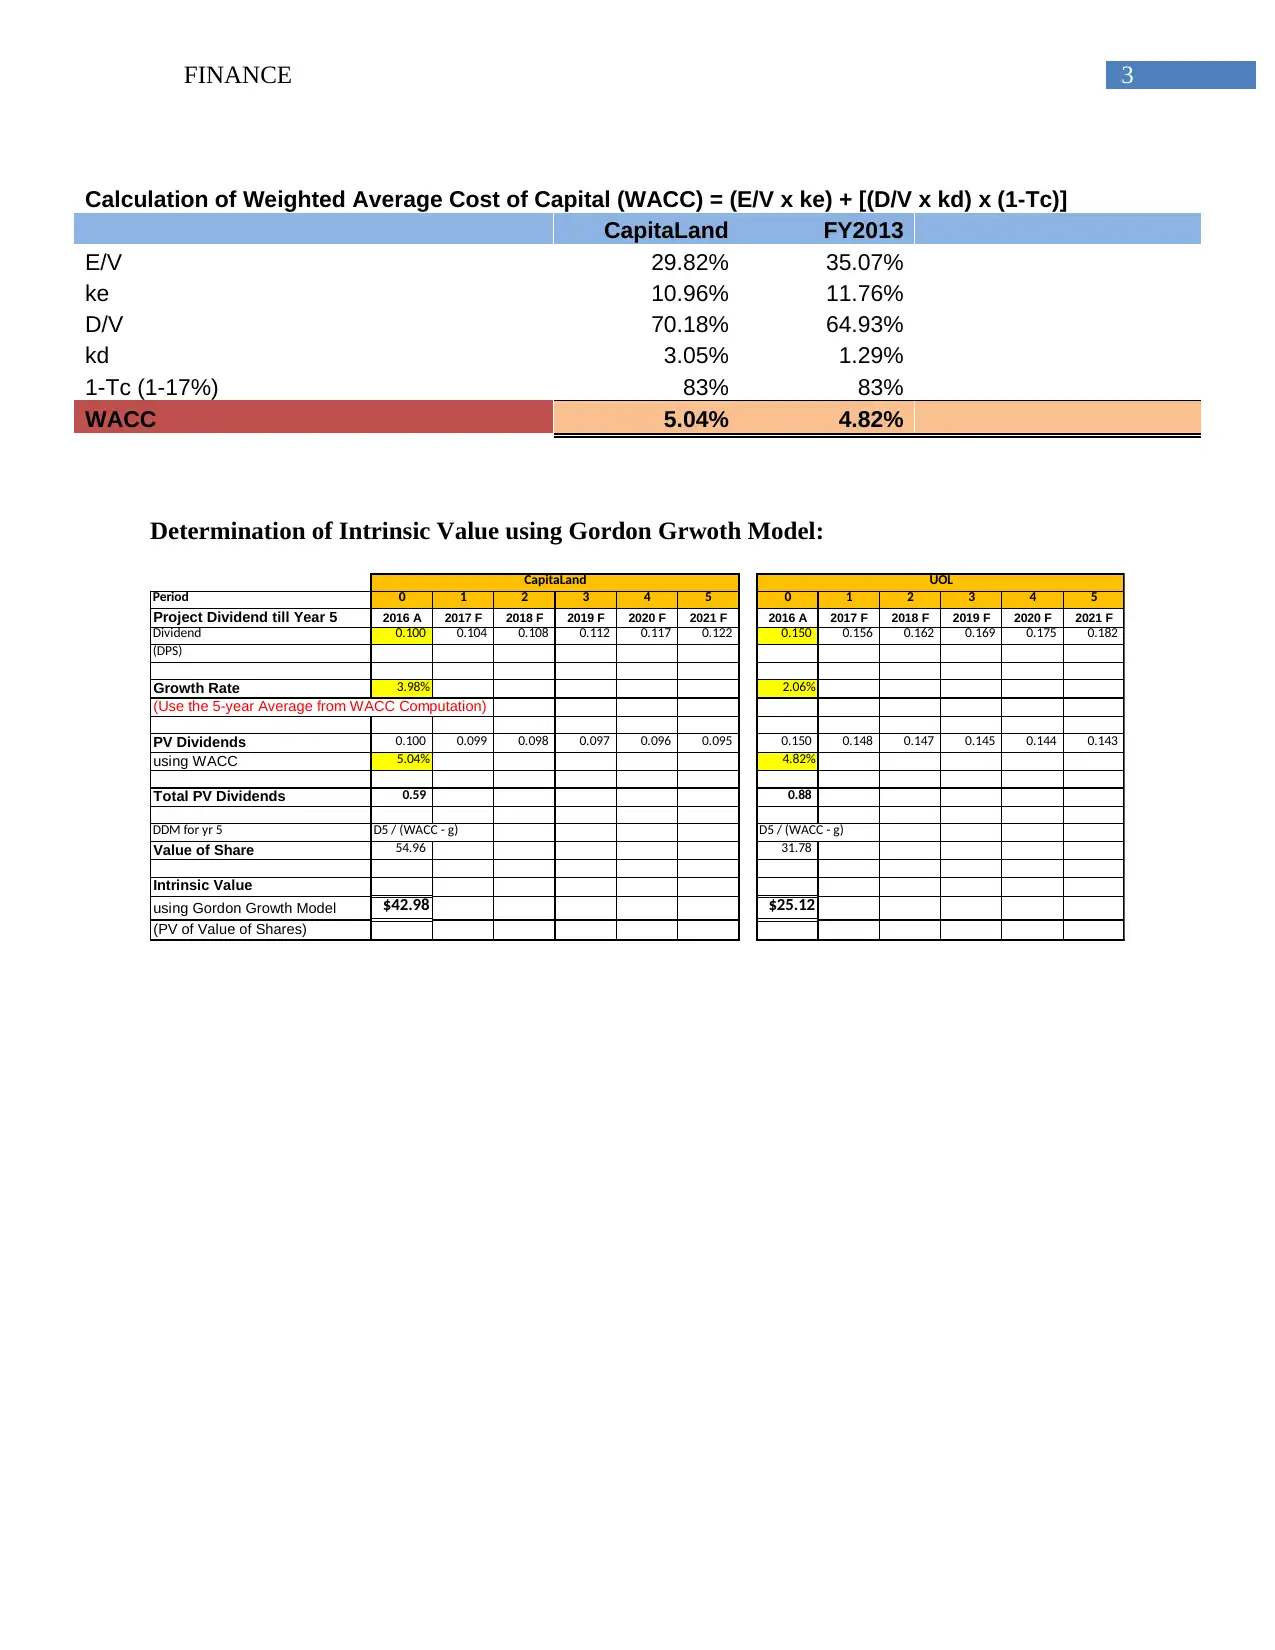
This finance assignment provides a detailed analysis of CapitaLand's financial data for the fiscal year 2013. The solution calculates the Weighted Average Cost of Capital (WACC), including the cost of equity and cost of debt, using financial statements and relevant formulas. It also computes the intrinsic value of the company using the Gordon Growth Model. The assignment demonstrates the steps involved in determining the payout ratio, return on equity, and dividend growth rate. Furthermore, it includes the calculation of the cost of debt based on the company's financial structure. The assignment concludes with a bibliography of sources used for the analysis. This solution is available on Desklib, a platform offering AI-based study tools and academic resources for students.
Document Page
Running head: FINANCE
Finance
Name of the Student:
Name of the University:
Author’s Note:
tabler-icon-diamond-filled.svg

Paraphrase This Document

Need a fresh take? Get an instant paraphrase of this document with our AI Paraphraser
Document Page
1FINANCE
Answer to Question 3.b:
Computation of WACC:
Payout ratio = Dividend Per Share / EPS (Basic)
CapitaLand FY2013
Dividend per share (Do) 0.1000 0.1500
EPS - Basic
$
0.280
$
0.358
Payout ratio 35.71% 41.88%
Return of Equity = Profit For The Year / Total Equity
CapitaLand FY2013
S$'000 S$'000
Profit for the year
1,504,269,00
0
305,600,00
0
Total Equity
24,300,475,00
0
8,635,364,00
0
Return of Equity 6.19% 3.54%
Dividend Growth Rate = Return of Equity x Retention Rate (1-Payout Ratio)
CapitaLand FY2013
Return of Equity 6.19% 3.54%
Retention Rate (1-Payout Ratio) 64.29% 58.12%
Dividend Growth Rate (g) 3.98% 2.06%
Discounted Rate (ke) = Dividend Per Share (D1) / Value of Stock (P0) + Dividend Growth Rate (g)
CapitaLand FY2013
Share price 1.489 1.578
FX Conversion Rate into SGD 1 1
Share price - SGD
1.4
9
1.5
8
Dividend per share (D1) 0.1040 0.1531
Share price - SGD (P0) 1.4890 1.5782
Dividend Growth Rate (g) 0.0398 0.0206
Discounted Rate (ke) 10.96% 11.76%
Document Page
2FINANCE
2.3 COST OF DEBT
Total Debts
CapitaLand FY2013
S$'000 S$'000
Non-Current Laibilites:
Notes
Convertible Bonds
Senior note
5,842,010,00
0
4,272,00
0
Borrowings
6,636,938,00
0
1,617,759,00
0
Current Lailibilies:
Bank debts and current portion of long term
debts
710,642,00
0
Convertible bonds - CL
Senior note - CL
1,662,786,00
0
Trade and otherpayables
Borrowings
728,675,00
0
Total Debts
14,852,376,00
0
2,350,706,00
0
Cost of Debt (kd) = Finance / Total Debts
CapitaLand FY2013
S$'000 S$'000
Finance Costs
452,621,00
0
30,292,00
0
Total Debts
14,852,376,00
0
2,350,706,00
0
Cost of Debt (kd) 3.05% 1.29%
2.4 WEIGHTED AVERAGE COST OF CAPITAL (WACC)
Capital Structure = Equity + Debts
CapitaLand FY2013
S$'000 S$'000
Issues Capital (E)
6,309,496,00
0
1,269,853,00
0
Total Debts (D)
14,852,376,00
0
2,350,706,00
0
V = E + D
21,161,872,00
0
3,620,559,00
0
Document Page
3FINANCE
Calculation of Weighted Average Cost of Capital (WACC) = (E/V x ke) + [(D/V x kd) x (1-Tc)]
CapitaLand FY2013
E/V 29.82% 35.07%
ke 10.96% 11.76%
D/V 70.18% 64.93%
kd 3.05% 1.29%
1-Tc (1-17%) 83% 83%
WACC 5.04% 4.82%
Determination of Intrinsic Value using Gordon Grwoth Model:
Period 0 1 2 3 4 5 0 1 2 3 4 5
Project Dividend till Year 5 2016 A 2017 F 2018 F 2019 F 2020 F 2021 F 2016 A 2017 F 2018 F 2019 F 2020 F 2021 F
Dividend 0.100 0.104 0.108 0.112 0.117 0.122 0.150 0.156 0.162 0.169 0.175 0.182
(DPS)
Growth Rate 3.98% 2.06%
(Use the 5-year Average from WACC Computation)
PV Dividends 0.100 0.099 0.098 0.097 0.096 0.095 0.150 0.148 0.147 0.145 0.144 0.143
using WACC 5.04% 4.82%
Total PV Dividends 0.59 0.88
DDM for yr 5 D5 / (WACC - g) D5 / (WACC - g)
Value of Share 54.96 31.78
Intrinsic Value
using Gordon Growth Model $42.98 $25.12
(PV of Value of Shares)
CapitaLand UOL
tabler-icon-diamond-filled.svg

Paraphrase This Document

Need a fresh take? Get an instant paraphrase of this document with our AI Paraphraser
Document Page
4FINANCE
Bibliography:
Brightman, C., Masturzo, J., & Beck, N. (2015). Are Stocks Overvalued? A Survey of Equity
Valuation Models. Research Affiliates Fundamentals.
Duncan, J., Anderson, S. C., Price, S., & Thomas, C. (2017). The Gordon Growth Model: A
Teaching Case. Journal of Business Case Studies (Online), 13(1), 23.
Ho, K. C., Lee, S. C., Lin, C. T., & Yu, M. T. (2016). A Comparative Analysis of Accounting-
Based Valuation Models. Journal of Accounting, Auditing & Finance,
0148558X15623043.
Livdan, D., & Nezlobin, A. (2017). Accounting rules, equity valuation, and growth
options. Review of Accounting Studies, 22(3), 1122-1155.
chevron_up_icon
1 out of 5
circle_padding
hide_on_mobile
zoom_out_icon
[object Object]