XYZ Car Model Analysis: Financial Performance and Evaluation

Verified

Added on  2020/05/04

|29
|4396
|459
Report
AI Summary
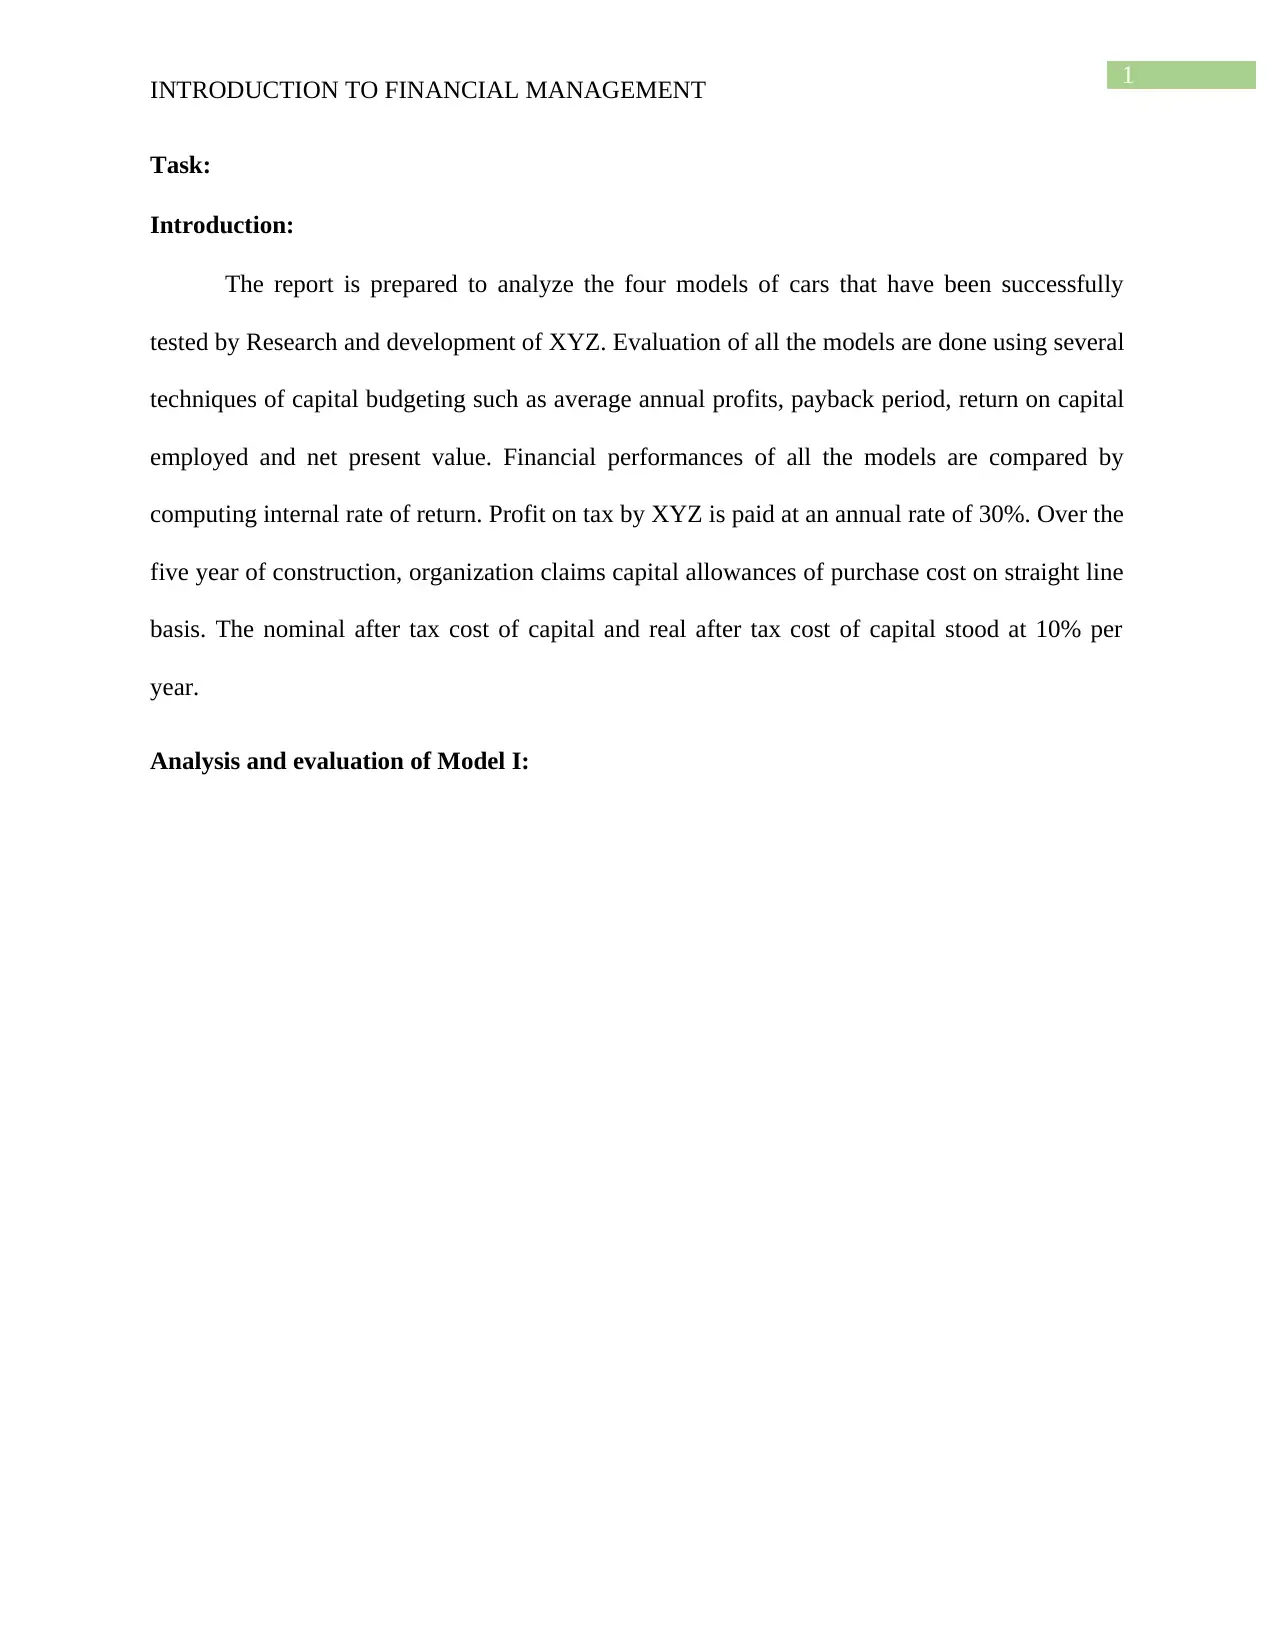
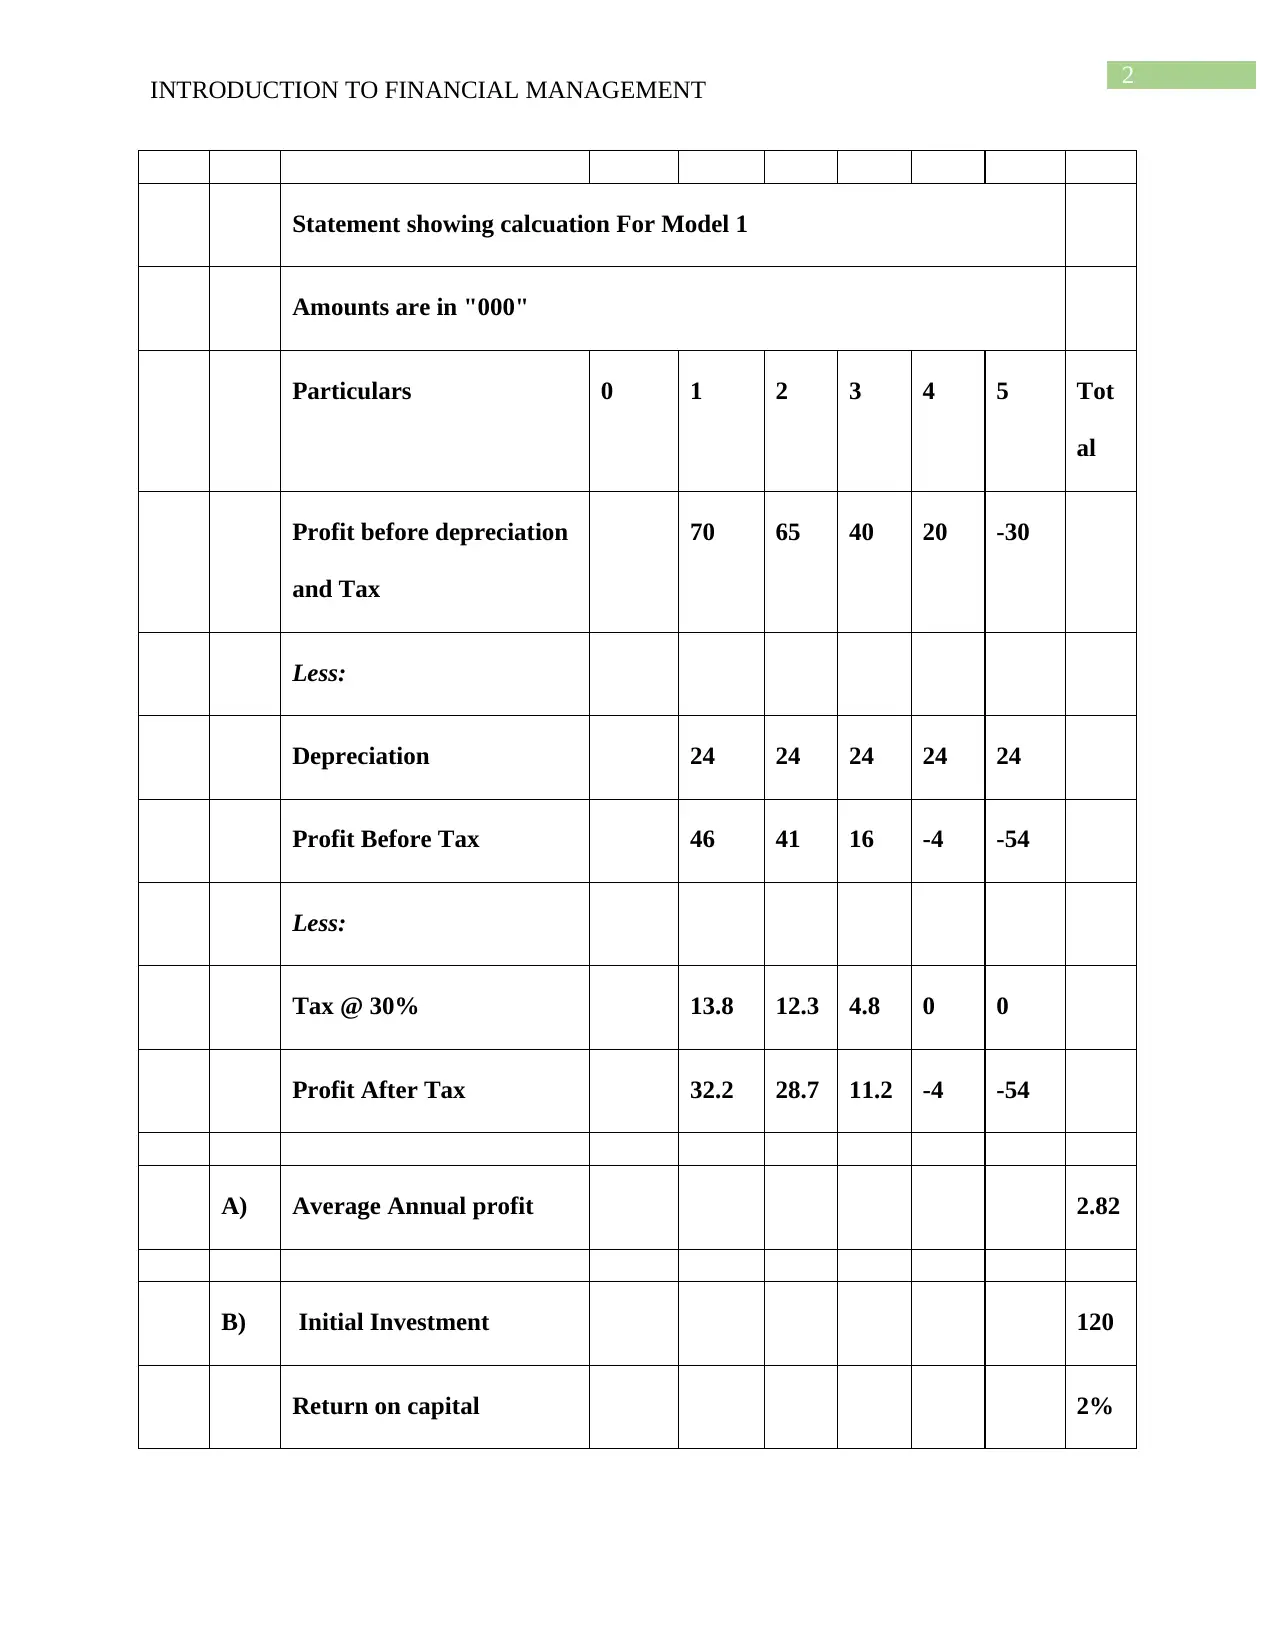
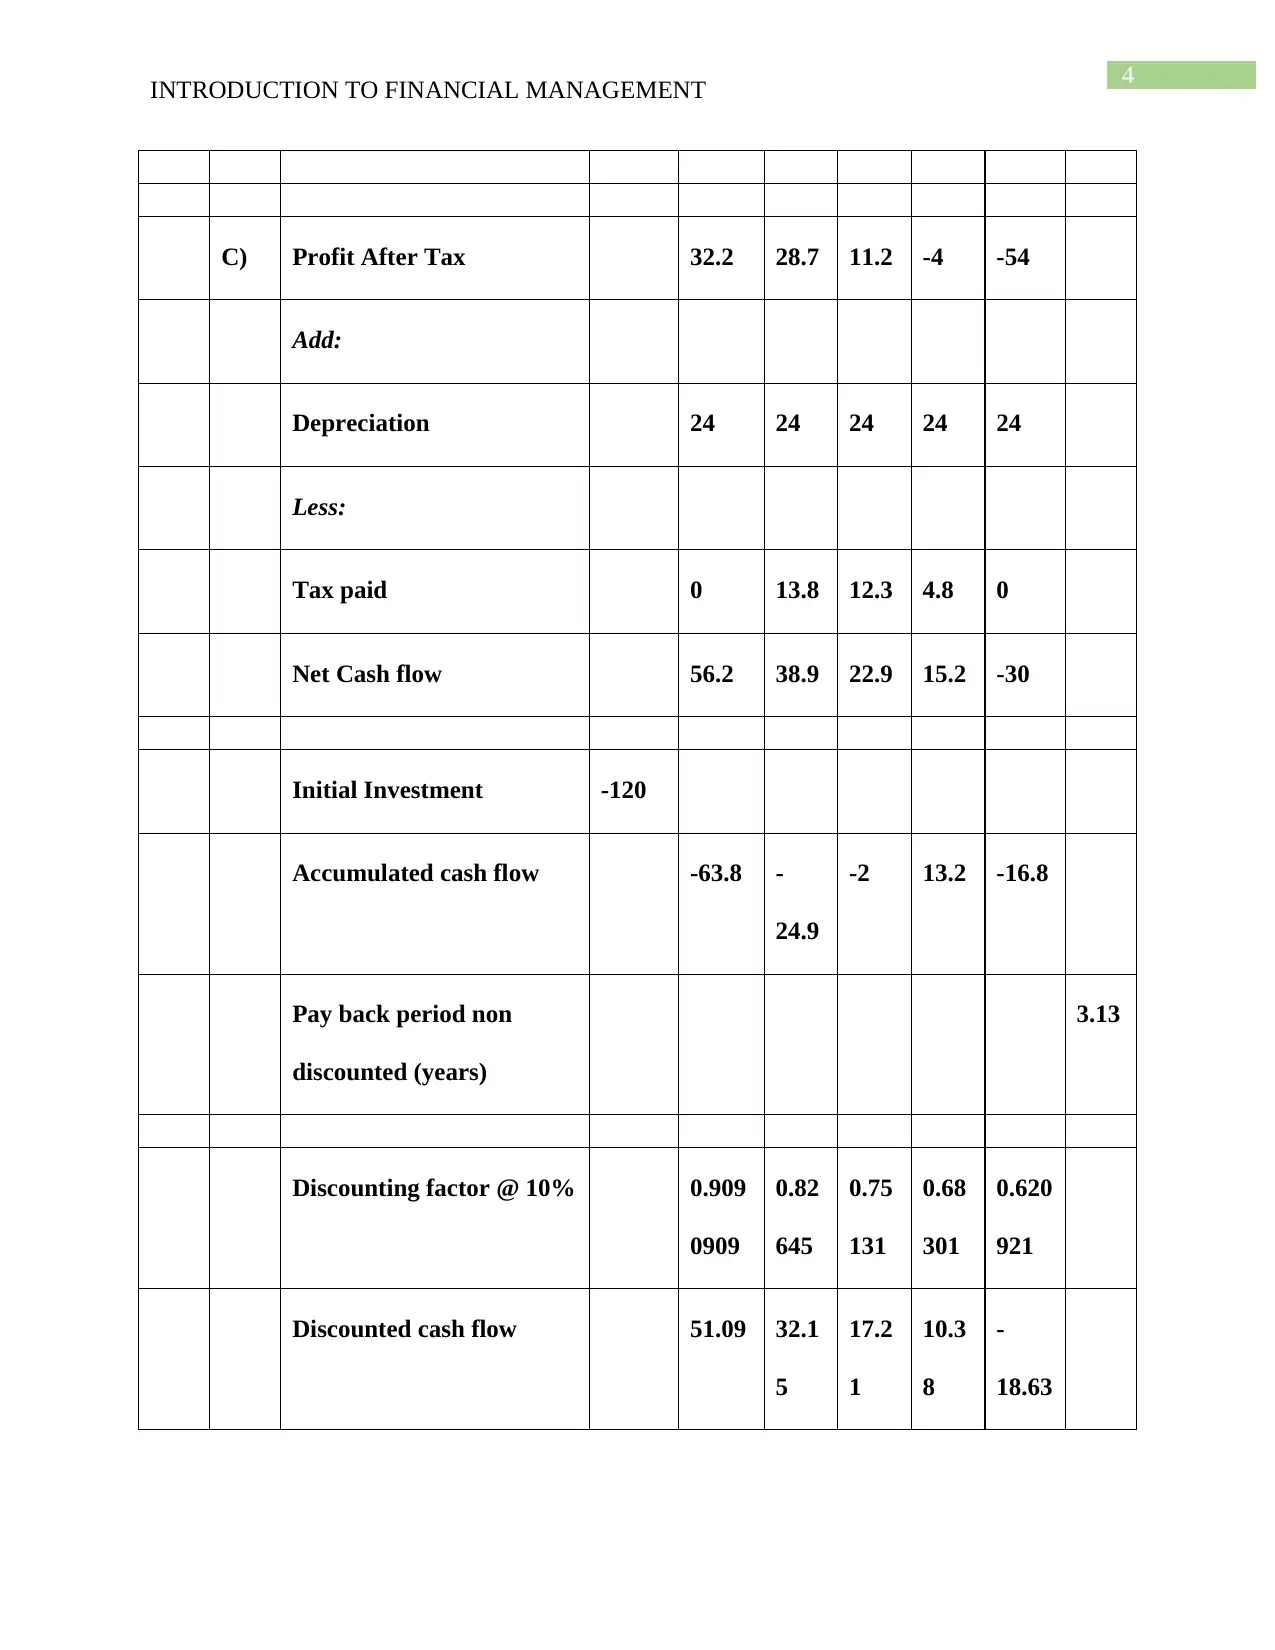
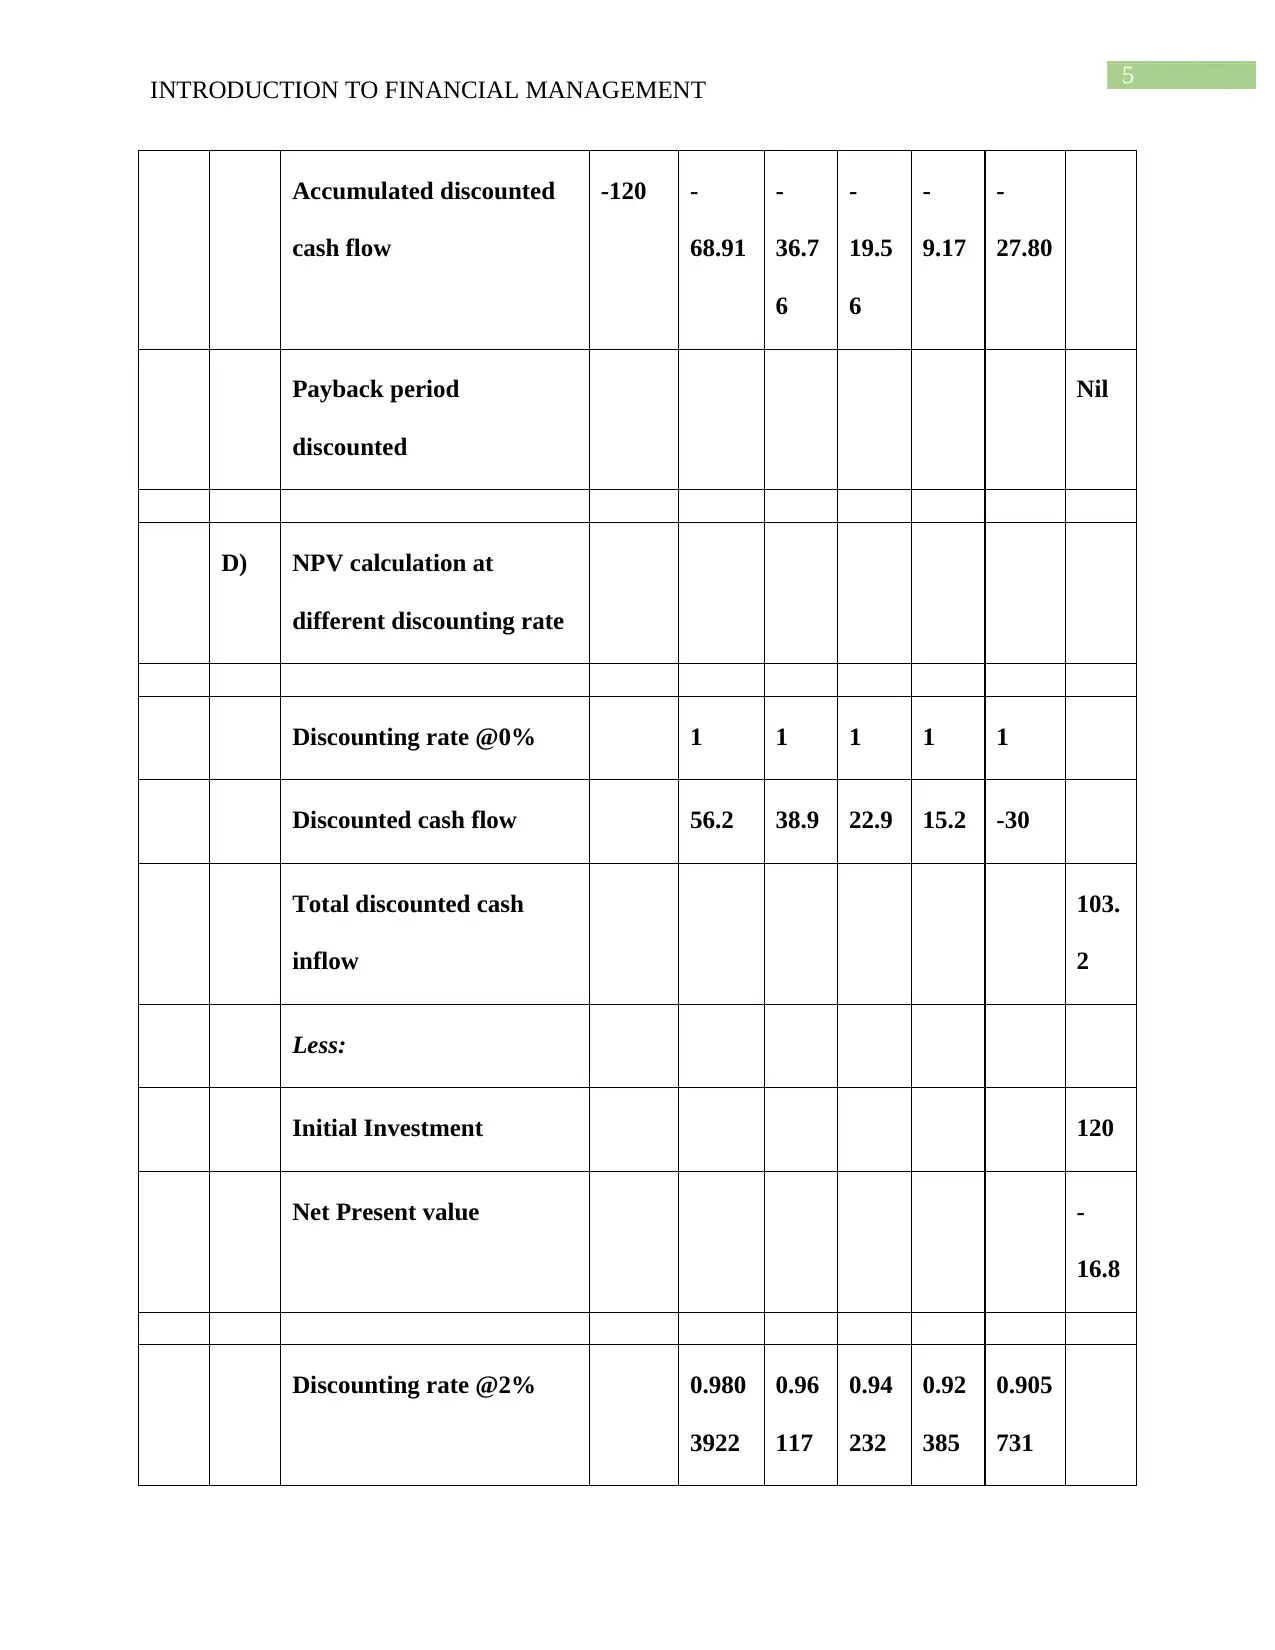
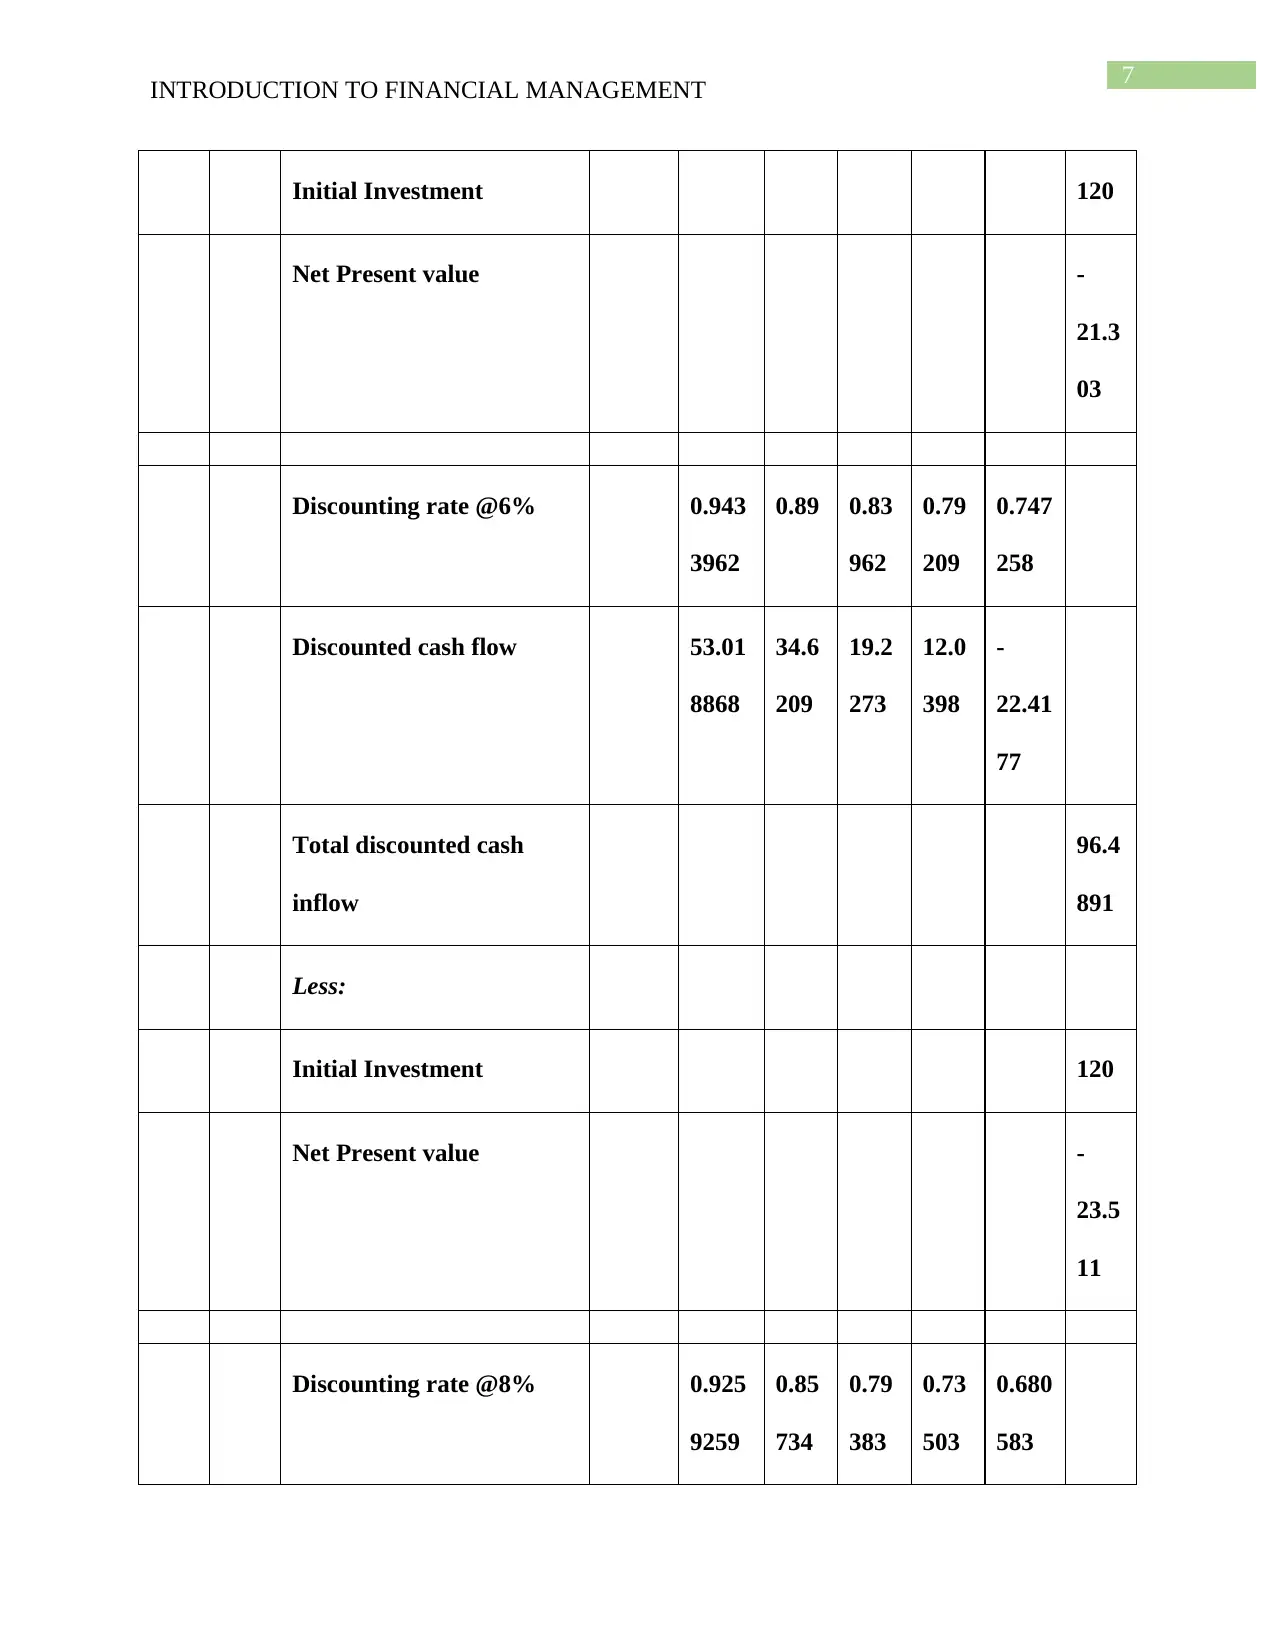
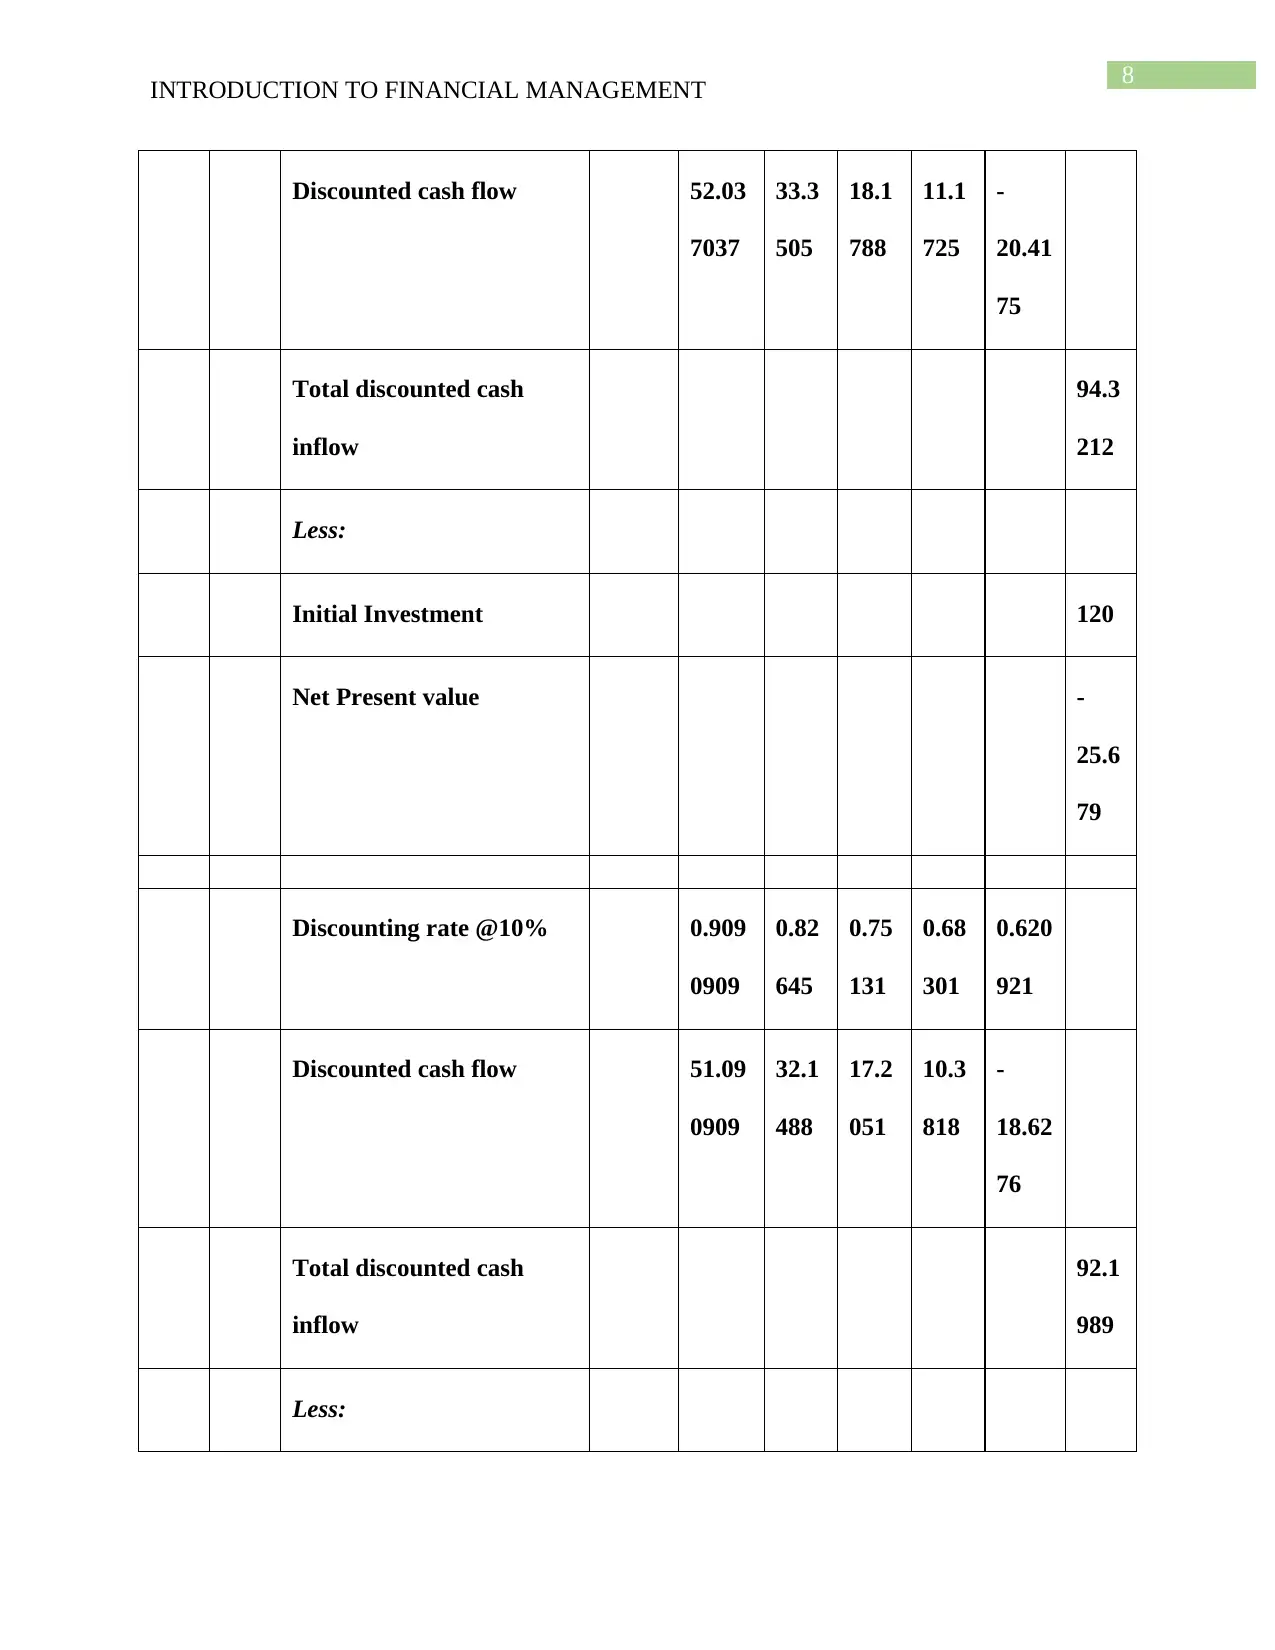
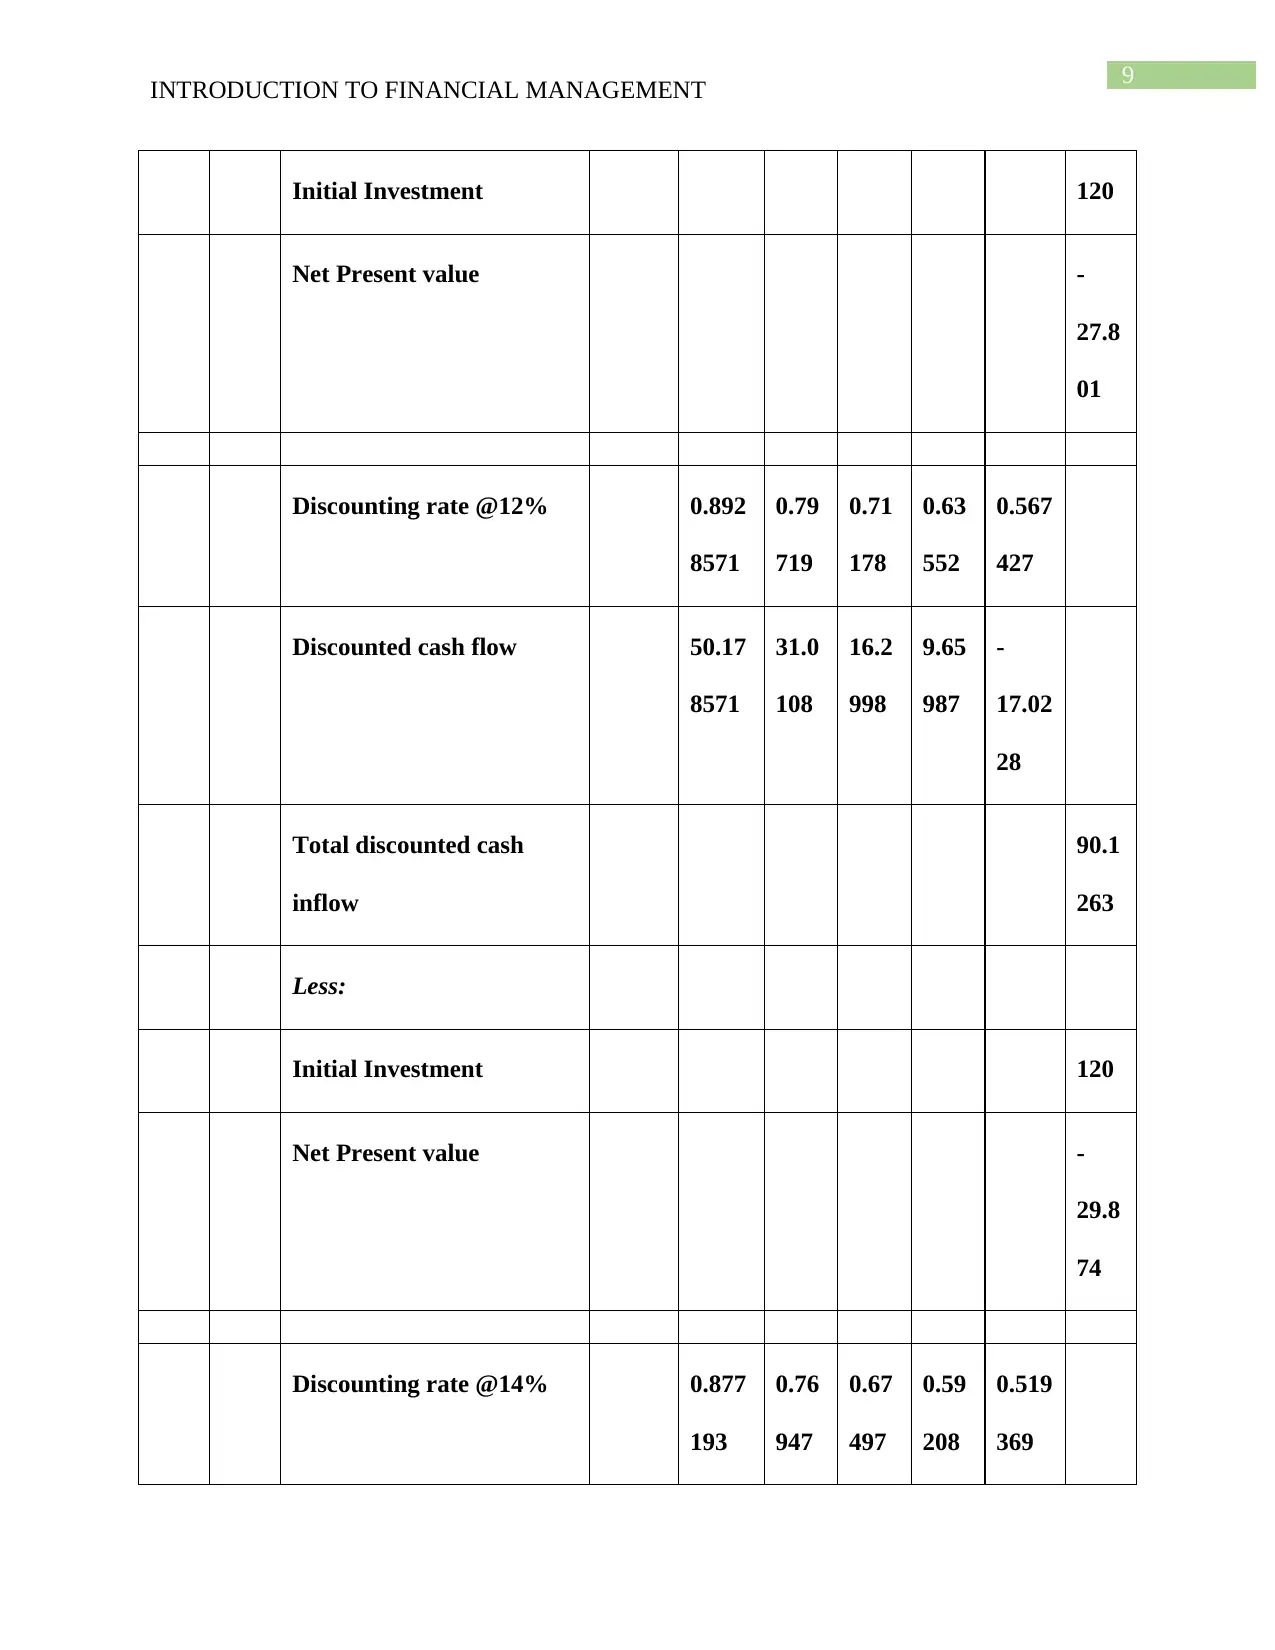
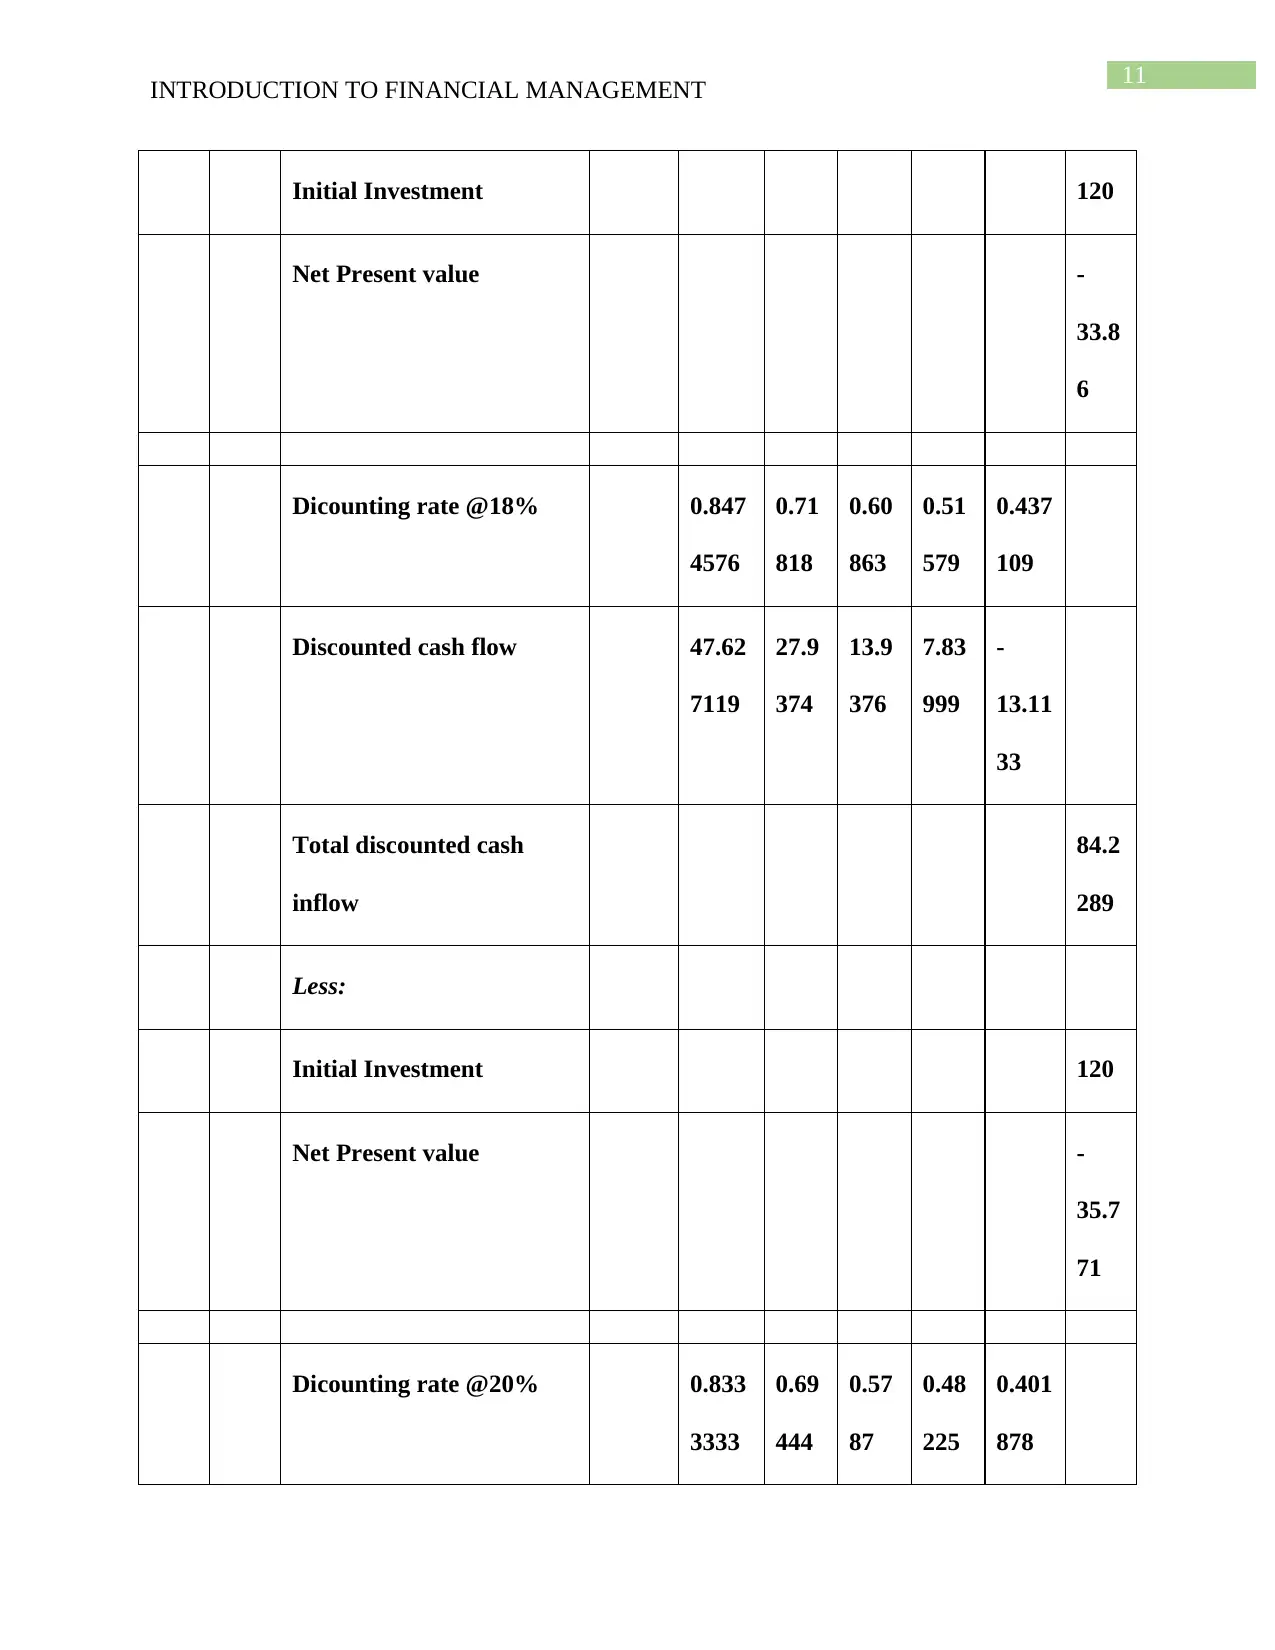
This report presents a financial analysis of four car models tested by XYZ's Research and Development department. The analysis employs capital budgeting techniques including average annual profits, payback period, return on capital employed, and net present value to evaluate each model's financial viability. The report calculates financial metrics such as internal rate of return, considering a 30% annual tax rate and straight-line depreciation over a five-year period, along with nominal and real after-tax cost of capital at 10% per year. The evaluation includes detailed calculations of cash flows, discounted cash flows, and net present values at different discount rates for each model, offering insights into their profitability and investment potential. The report provides a comparative analysis of each model's financial performance, highlighting strengths and weaknesses based on the applied financial metrics.
Document Page
Running head: INTRODUCTION TO FINANCIAL MANAGEMENT
Introduction to financial management
Name of the university
Name of the student
Authors note
tabler-icon-diamond-filled.svg

Paraphrase This Document

Need a fresh take? Get an instant paraphrase of this document with our AI Paraphraser
Document Page
1
INTRODUCTION TO FINANCIAL MANAGEMENT
Task:
Introduction:
The report is prepared to analyze the four models of cars that have been successfully
tested by Research and development of XYZ. Evaluation of all the models are done using several
techniques of capital budgeting such as average annual profits, payback period, return on capital
employed and net present value. Financial performances of all the models are compared by
computing internal rate of return. Profit on tax by XYZ is paid at an annual rate of 30%. Over the
five year of construction, organization claims capital allowances of purchase cost on straight line
basis. The nominal after tax cost of capital and real after tax cost of capital stood at 10% per
year.
Analysis and evaluation of Model I:
Document Page
2
INTRODUCTION TO FINANCIAL MANAGEMENT
Statement showing calcuation For Model 1
Amounts are in "000"
Particulars 0 1 2 3 4 5 Tot
al
Profit before depreciation
and Tax
70 65 40 20 -30
Less:
Depreciation 24 24 24 24 24
Profit Before Tax 46 41 16 -4 -54
Less:
Tax @ 30% 13.8 12.3 4.8 0 0
Profit After Tax 32.2 28.7 11.2 -4 -54
A) Average Annual profit 2.82
B) Initial Investment 120
Return on capital 2%
Document Page
3
INTRODUCTION TO FINANCIAL MANAGEMENT
Employed
tabler-icon-diamond-filled.svg

Paraphrase This Document

Need a fresh take? Get an instant paraphrase of this document with our AI Paraphraser
Document Page
4
INTRODUCTION TO FINANCIAL MANAGEMENT
C) Profit After Tax 32.2 28.7 11.2 -4 -54
Add:
Depreciation 24 24 24 24 24
Less:
Tax paid 0 13.8 12.3 4.8 0
Net Cash flow 56.2 38.9 22.9 15.2 -30
Initial Investment -120
Accumulated cash flow -63.8 -
24.9
-2 13.2 -16.8
Pay back period non
discounted (years)
3.13
Discounting factor @ 10% 0.909
0909
0.82
645
0.75
131
0.68
301
0.620
921
Discounted cash flow 51.09 32.1
5
17.2
1
10.3
8
-
18.63
Document Page
5
INTRODUCTION TO FINANCIAL MANAGEMENT
Accumulated discounted
cash flow
-120 -
68.91
-
36.7
6
-
19.5
6
-
9.17
-
27.80
Payback period
discounted
Nil
D) NPV calculation at
different discounting rate
Discounting rate @0% 1 1 1 1 1
Discounted cash flow 56.2 38.9 22.9 15.2 -30
Total discounted cash
inflow
103.
2
Less:
Initial Investment 120
Net Present value -
16.8
Discounting rate @2% 0.980
3922
0.96
117
0.94
232
0.92
385
0.905
731
Document Page
6
INTRODUCTION TO FINANCIAL MANAGEMENT
Discounted cash flow 55.09
8039
37.3
895
21.5
792
14.0
425
-
27.17
19
Total discounted cash
inflow
100.
937
Less:
Initial Investment 120
Net Present value -
19.0
63
Dicounting rate @4% 0.961
5385
0.92
456
0.88
9
0.85
48
0.821
927
Discounted cash flow 54.03
8462
35.9
652
20.3
58
12.9
93
-
24.65
78
Total discounted cash
inflow
98.6
969
Less:
tabler-icon-diamond-filled.svg

Paraphrase This Document

Need a fresh take? Get an instant paraphrase of this document with our AI Paraphraser
Document Page
7
INTRODUCTION TO FINANCIAL MANAGEMENT
Initial Investment 120
Net Present value -
21.3
03
Discounting rate @6% 0.943
3962
0.89 0.83
962
0.79
209
0.747
258
Discounted cash flow 53.01
8868
34.6
209
19.2
273
12.0
398
-
22.41
77
Total discounted cash
inflow
96.4
891
Less:
Initial Investment 120
Net Present value -
23.5
11
Discounting rate @8% 0.925
9259
0.85
734
0.79
383
0.73
503
0.680
583
Document Page
8
INTRODUCTION TO FINANCIAL MANAGEMENT
Discounted cash flow 52.03
7037
33.3
505
18.1
788
11.1
725
-
20.41
75
Total discounted cash
inflow
94.3
212
Less:
Initial Investment 120
Net Present value -
25.6
79
Discounting rate @10% 0.909
0909
0.82
645
0.75
131
0.68
301
0.620
921
Discounted cash flow 51.09
0909
32.1
488
17.2
051
10.3
818
-
18.62
76
Total discounted cash
inflow
92.1
989
Less:
Document Page
9
INTRODUCTION TO FINANCIAL MANAGEMENT
Initial Investment 120
Net Present value -
27.8
01
Discounting rate @12% 0.892
8571
0.79
719
0.71
178
0.63
552
0.567
427
Discounted cash flow 50.17
8571
31.0
108
16.2
998
9.65
987
-
17.02
28
Total discounted cash
inflow
90.1
263
Less:
Initial Investment 120
Net Present value -
29.8
74
Discounting rate @14% 0.877
193
0.76
947
0.67
497
0.59
208
0.519
369
tabler-icon-diamond-filled.svg

Paraphrase This Document

Need a fresh take? Get an instant paraphrase of this document with our AI Paraphraser
Document Page
10
INTRODUCTION TO FINANCIAL MANAGEMENT
Discounted cash flow 49.29
8246
29.9
323
15.4
568
8.99
962
-
15.58
11
Total discounted cash
inflow
88.1
059
Less:
Initial Investment 120
Net Present value -
31.8
94
Discounting rate @16% 0.862
069
0.74
316
0.64
066
0.55
229
0.476
113
Discounted cash flow 48.44
8276
28.9
09
14.6
711
8.39
482
-
14.28
34
Total discounted cash
inflow
86.1
398
Less:
Document Page
11
INTRODUCTION TO FINANCIAL MANAGEMENT
Initial Investment 120
Net Present value -
33.8
6
Dicounting rate @18% 0.847
4576
0.71
818
0.60
863
0.51
579
0.437
109
Discounted cash flow 47.62
7119
27.9
374
13.9
376
7.83
999
-
13.11
33
Total discounted cash
inflow
84.2
289
Less:
Initial Investment 120
Net Present value -
35.7
71
Dicounting rate @20% 0.833
3333
0.69
444
0.57
87
0.48
225
0.401
878
chevron_up_icon
1 out of 29
circle_padding
hide_on_mobile
zoom_out_icon
[object Object]