Financial Analysis and Decision Making: A Comprehensive Report
VerifiedAdded on 2023/06/10
|12
|2571
|90
Report
AI Summary
This report presents a comprehensive financial analysis and decision-making process. It begins with a break-even analysis, calculating break-even points in units and revenue, and the margin of safety for two alternative scenarios (A and B), evaluating profitability under different production levels. The report then delves into investment appraisal techniques, including payback period and net present value (NPV), comparing two project options and assessing their financial viability. The internal rate of return (IRR) is also discussed, along with recommendations for investment choices, emphasizing the importance of financial and non-financial factors in decision-making. Finally, the report examines the limitations of break-even analysis and the strengths and weaknesses of Return on Capital Employed (ROCE), and the importance of cost of capital, and non-financial measures for business efficiency.
Financial Analysis and
Decision Making
Decision Making
Paraphrase This Document
Need a fresh take? Get an instant paraphrase of this document with our AI Paraphraser
Contents
Question 1........................................................................................................................................3
a) Calculate..................................................................................................................................3
b) Profit made under following....................................................................................................4
c)..................................................................................................................................................5
d) Recommendation.....................................................................................................................6
e) Limitations of Break – even analysis......................................................................................6
Question 2........................................................................................................................................7
a)..................................................................................................................................................7
b)..................................................................................................................................................7
c)..................................................................................................................................................9
d)..................................................................................................................................................9
e)................................................................................................................................................10
Question 3......................................................................................................................................10
a)................................................................................................................................................10
b)................................................................................................................................................10
c)................................................................................................................................................11
d)................................................................................................................................................11
REFERENCES..............................................................................................................................12
Question 1.
a) Calculate
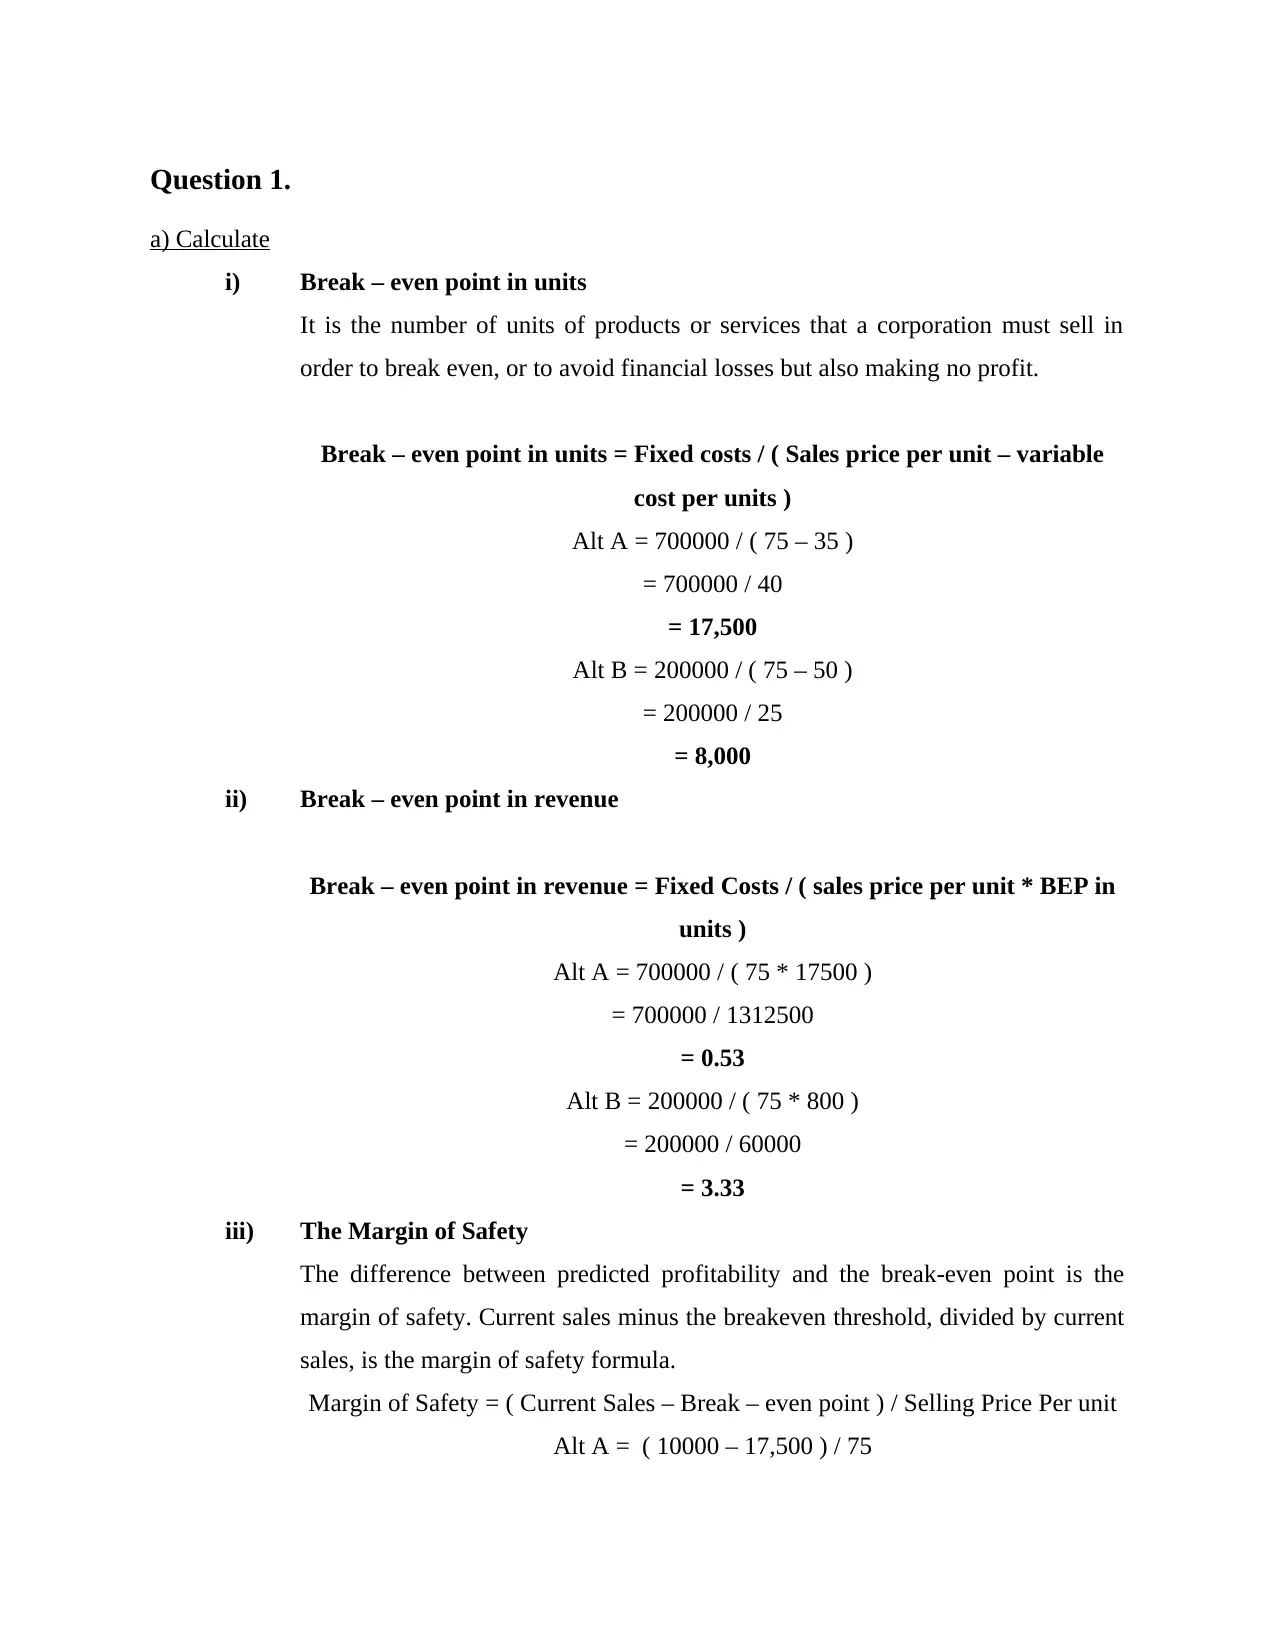
i) Break – even point in units
It is the number of units of products or services that a corporation must sell in
order to break even, or to avoid financial losses but also making no profit.
Break – even point in units = Fixed costs / ( Sales price per unit – variable
cost per units )
Alt A = 700000 / ( 75 – 35 )
= 700000 / 40
= 17,500
Alt B = 200000 / ( 75 – 50 )
= 200000 / 25
= 8,000
ii) Break – even point in revenue
Break – even point in revenue = Fixed Costs / ( sales price per unit * BEP in
units )
Alt A = 700000 / ( 75 * 17500 )
= 700000 / 1312500
= 0.53
Alt B = 200000 / ( 75 * 800 )
= 200000 / 60000
= 3.33
iii) The Margin of Safety
The difference between predicted profitability and the break-even point is the
margin of safety. Current sales minus the breakeven threshold, divided by current
sales, is the margin of safety formula.
Margin of Safety = ( Current Sales – Break – even point ) / Selling Price Per unit
Alt A = ( 10000 – 17,500 ) / 75
a) Calculate
i) Break – even point in units
It is the number of units of products or services that a corporation must sell in
order to break even, or to avoid financial losses but also making no profit.
Break – even point in units = Fixed costs / ( Sales price per unit – variable
cost per units )
Alt A = 700000 / ( 75 – 35 )
= 700000 / 40
= 17,500
Alt B = 200000 / ( 75 – 50 )
= 200000 / 25
= 8,000
ii) Break – even point in revenue
Break – even point in revenue = Fixed Costs / ( sales price per unit * BEP in
units )
Alt A = 700000 / ( 75 * 17500 )
= 700000 / 1312500
= 0.53
Alt B = 200000 / ( 75 * 800 )
= 200000 / 60000
= 3.33
iii) The Margin of Safety
The difference between predicted profitability and the break-even point is the
margin of safety. Current sales minus the breakeven threshold, divided by current
sales, is the margin of safety formula.
Margin of Safety = ( Current Sales – Break – even point ) / Selling Price Per unit
Alt A = ( 10000 – 17,500 ) / 75
⊘ This is a preview!⊘
Do you want full access?
Subscribe today to unlock all pages.
Trusted by 1+ million students worldwide
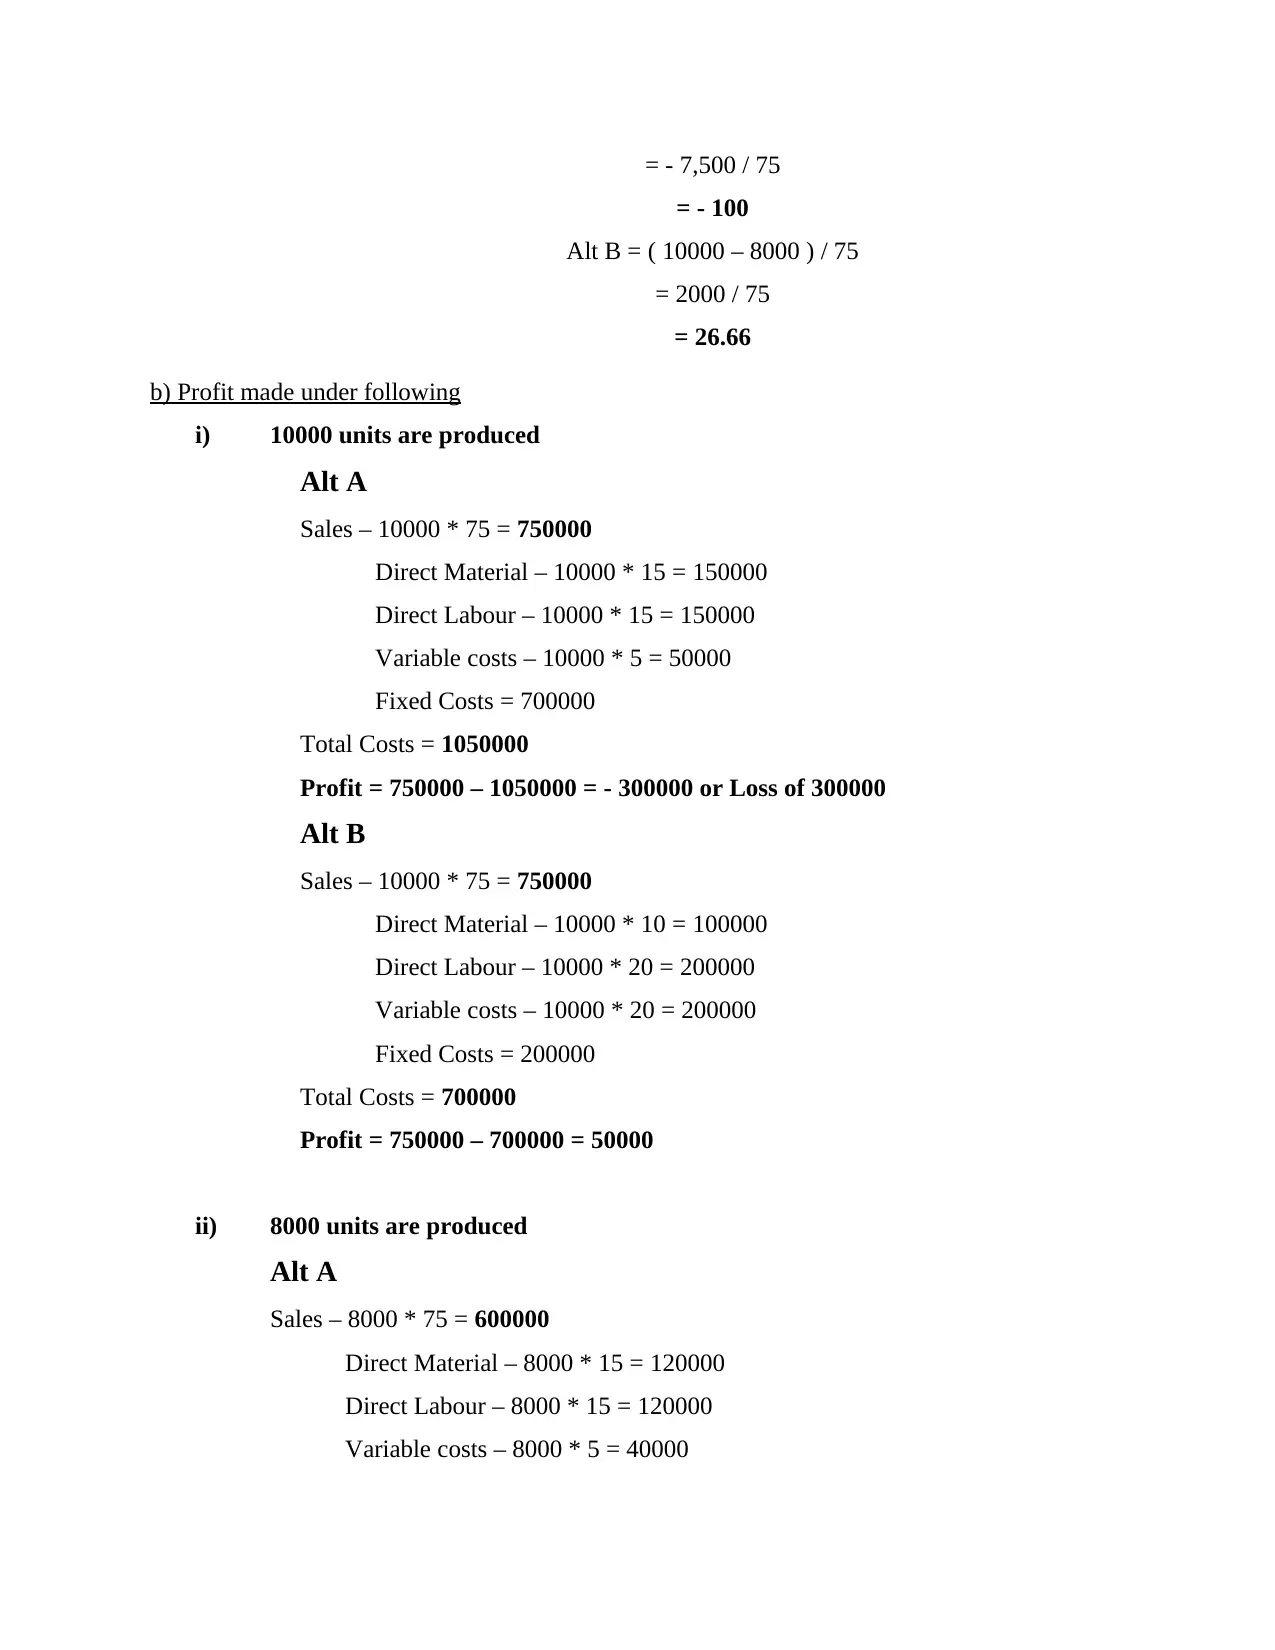
= - 7,500 / 75
= - 100
Alt B = ( 10000 – 8000 ) / 75
= 2000 / 75
= 26.66
b) Profit made under following
i) 10000 units are produced
Alt A
Sales – 10000 * 75 = 750000
Direct Material – 10000 * 15 = 150000
Direct Labour – 10000 * 15 = 150000
Variable costs – 10000 * 5 = 50000
Fixed Costs = 700000
Total Costs = 1050000
Profit = 750000 – 1050000 = - 300000 or Loss of 300000
Alt B
Sales – 10000 * 75 = 750000
Direct Material – 10000 * 10 = 100000
Direct Labour – 10000 * 20 = 200000
Variable costs – 10000 * 20 = 200000
Fixed Costs = 200000
Total Costs = 700000
Profit = 750000 – 700000 = 50000
ii) 8000 units are produced
Alt A
Sales – 8000 * 75 = 600000
Direct Material – 8000 * 15 = 120000
Direct Labour – 8000 * 15 = 120000
Variable costs – 8000 * 5 = 40000
Paraphrase This Document
Need a fresh take? Get an instant paraphrase of this document with our AI Paraphraser
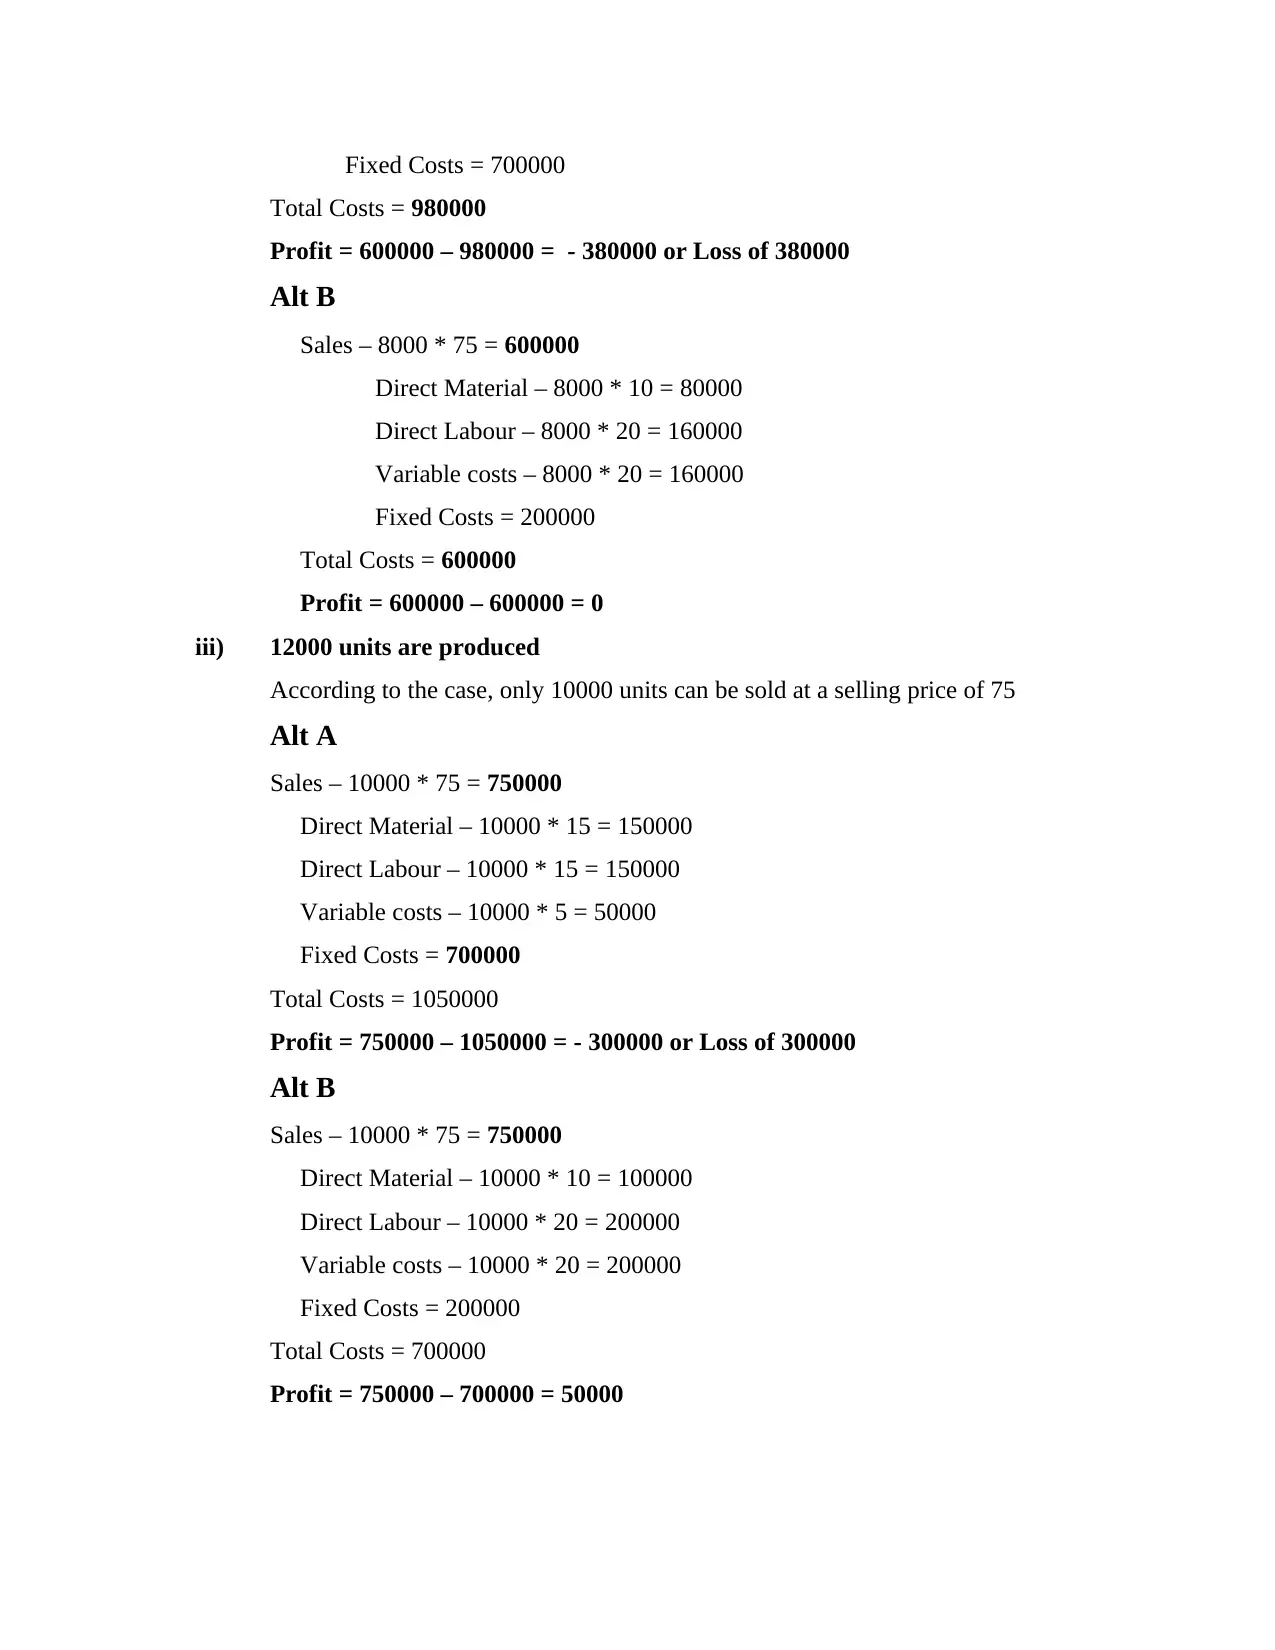
Fixed Costs = 700000
Total Costs = 980000
Profit = 600000 – 980000 = - 380000 or Loss of 380000
Alt B
Sales – 8000 * 75 = 600000
Direct Material – 8000 * 10 = 80000
Direct Labour – 8000 * 20 = 160000
Variable costs – 8000 * 20 = 160000
Fixed Costs = 200000
Total Costs = 600000
Profit = 600000 – 600000 = 0
iii) 12000 units are produced
According to the case, only 10000 units can be sold at a selling price of 75
Alt A
Sales – 10000 * 75 = 750000
Direct Material – 10000 * 15 = 150000
Direct Labour – 10000 * 15 = 150000
Variable costs – 10000 * 5 = 50000
Fixed Costs = 700000
Total Costs = 1050000
Profit = 750000 – 1050000 = - 300000 or Loss of 300000
Alt B
Sales – 10000 * 75 = 750000
Direct Material – 10000 * 10 = 100000
Direct Labour – 10000 * 20 = 200000
Variable costs – 10000 * 20 = 200000
Fixed Costs = 200000
Total Costs = 700000
Profit = 750000 – 700000 = 50000
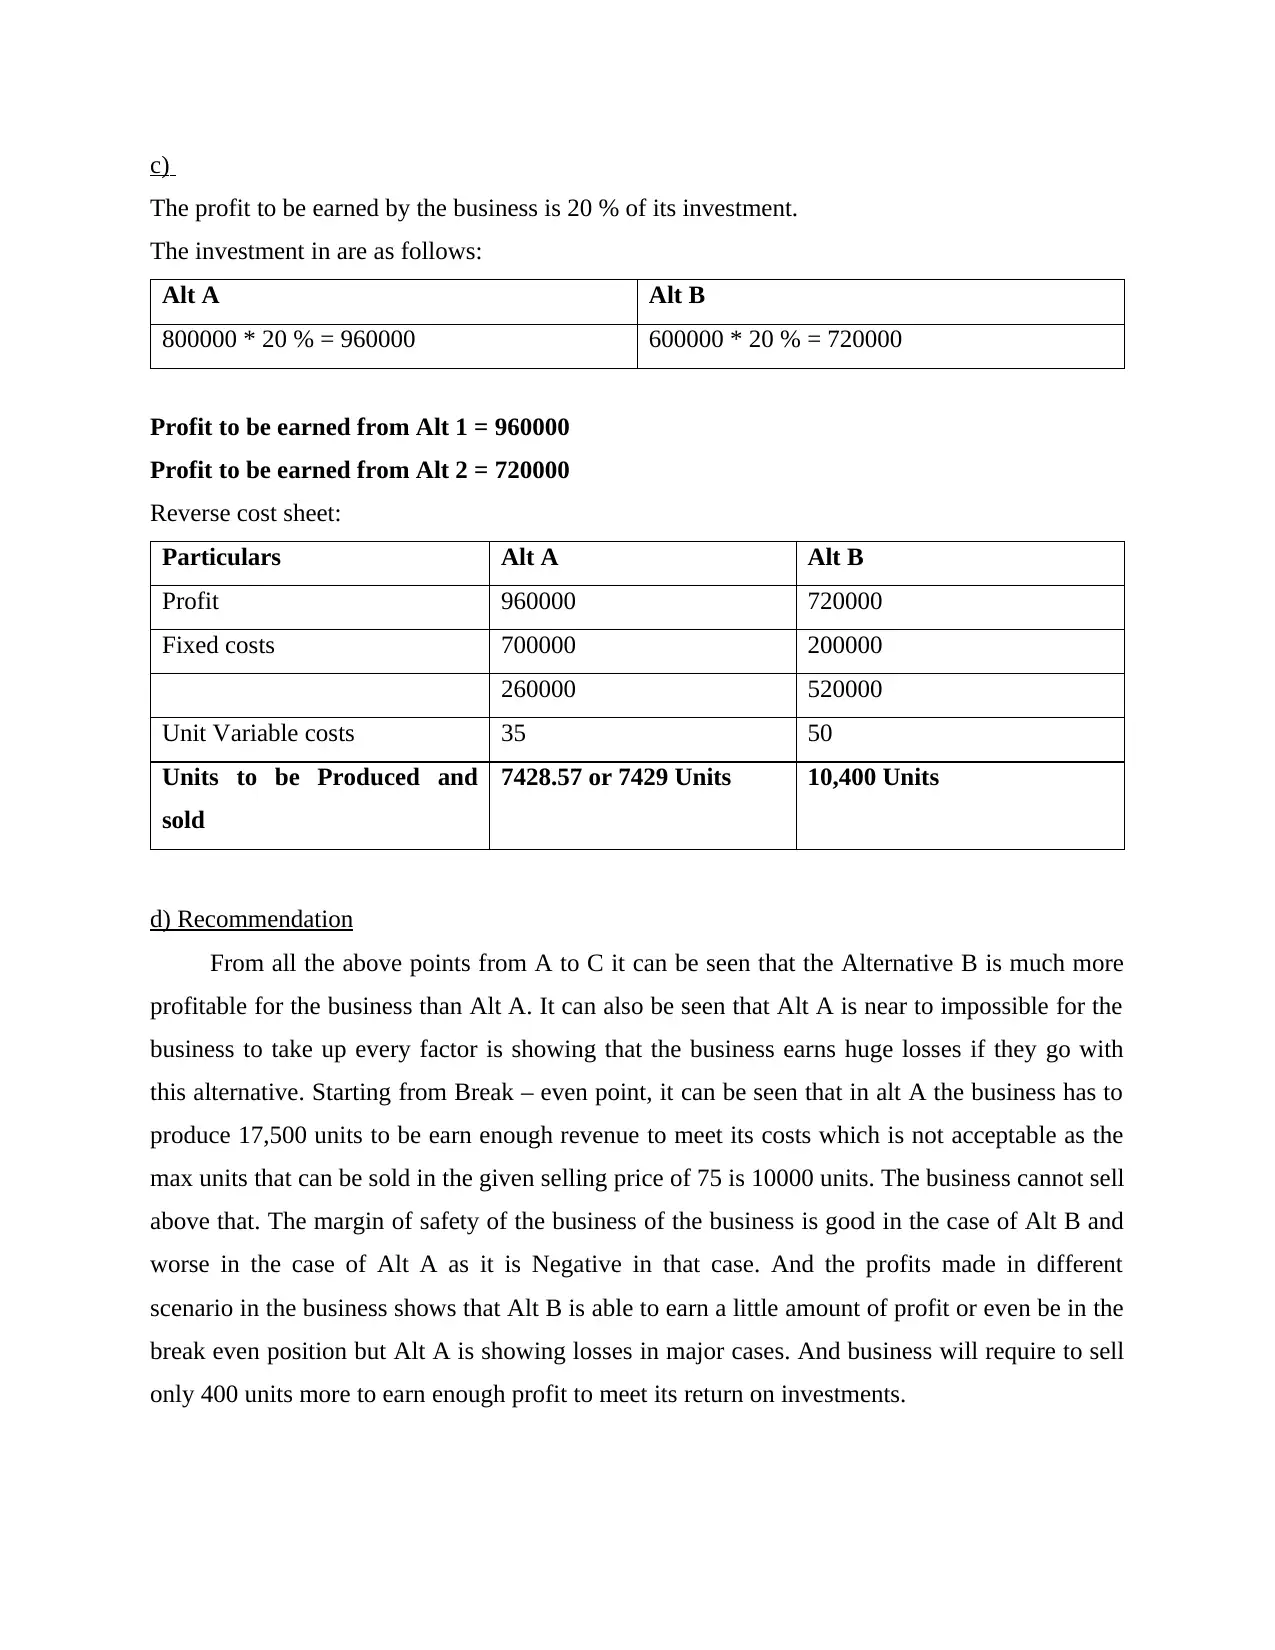
c)
The profit to be earned by the business is 20 % of its investment.
The investment in are as follows:
Alt A Alt B
800000 * 20 % = 960000 600000 * 20 % = 720000
Profit to be earned from Alt 1 = 960000
Profit to be earned from Alt 2 = 720000
Reverse cost sheet:
Particulars Alt A Alt B
Profit 960000 720000
Fixed costs 700000 200000
260000 520000
Unit Variable costs 35 50
Units to be Produced and
sold
7428.57 or 7429 Units 10,400 Units
d) Recommendation
From all the above points from A to C it can be seen that the Alternative B is much more
profitable for the business than Alt A. It can also be seen that Alt A is near to impossible for the
business to take up every factor is showing that the business earns huge losses if they go with
this alternative. Starting from Break – even point, it can be seen that in alt A the business has to
produce 17,500 units to be earn enough revenue to meet its costs which is not acceptable as the
max units that can be sold in the given selling price of 75 is 10000 units. The business cannot sell
above that. The margin of safety of the business of the business is good in the case of Alt B and
worse in the case of Alt A as it is Negative in that case. And the profits made in different
scenario in the business shows that Alt B is able to earn a little amount of profit or even be in the
break even position but Alt A is showing losses in major cases. And business will require to sell
only 400 units more to earn enough profit to meet its return on investments.
⊘ This is a preview!⊘
Do you want full access?
Subscribe today to unlock all pages.
Trusted by 1+ million students worldwide
e) Limitations of Break – even analysis
The production in a given time may not be the only driver of costs in that period.
Maintenance costs, for example, might be the outcome of previous output or a preparation for
future output. As a result, it may be difficult to connect them to a certain time period.
In a break-even analysis, it's extremely challenging to account for selling expenses. Because
variations in selling costs are a cause, not an effect, of changes in output and sales, this is the
case. The cost-revenue-volume connection is assumed to be linear in break-even analysis. This is
only feasible across a limited range of output.
Question 2.
a)
The amount of £ 6000 which has been incurred by Tom in its investment for conducting
the feasibility study is not a relevant cost. It will be termed as the sunk cost in the business.
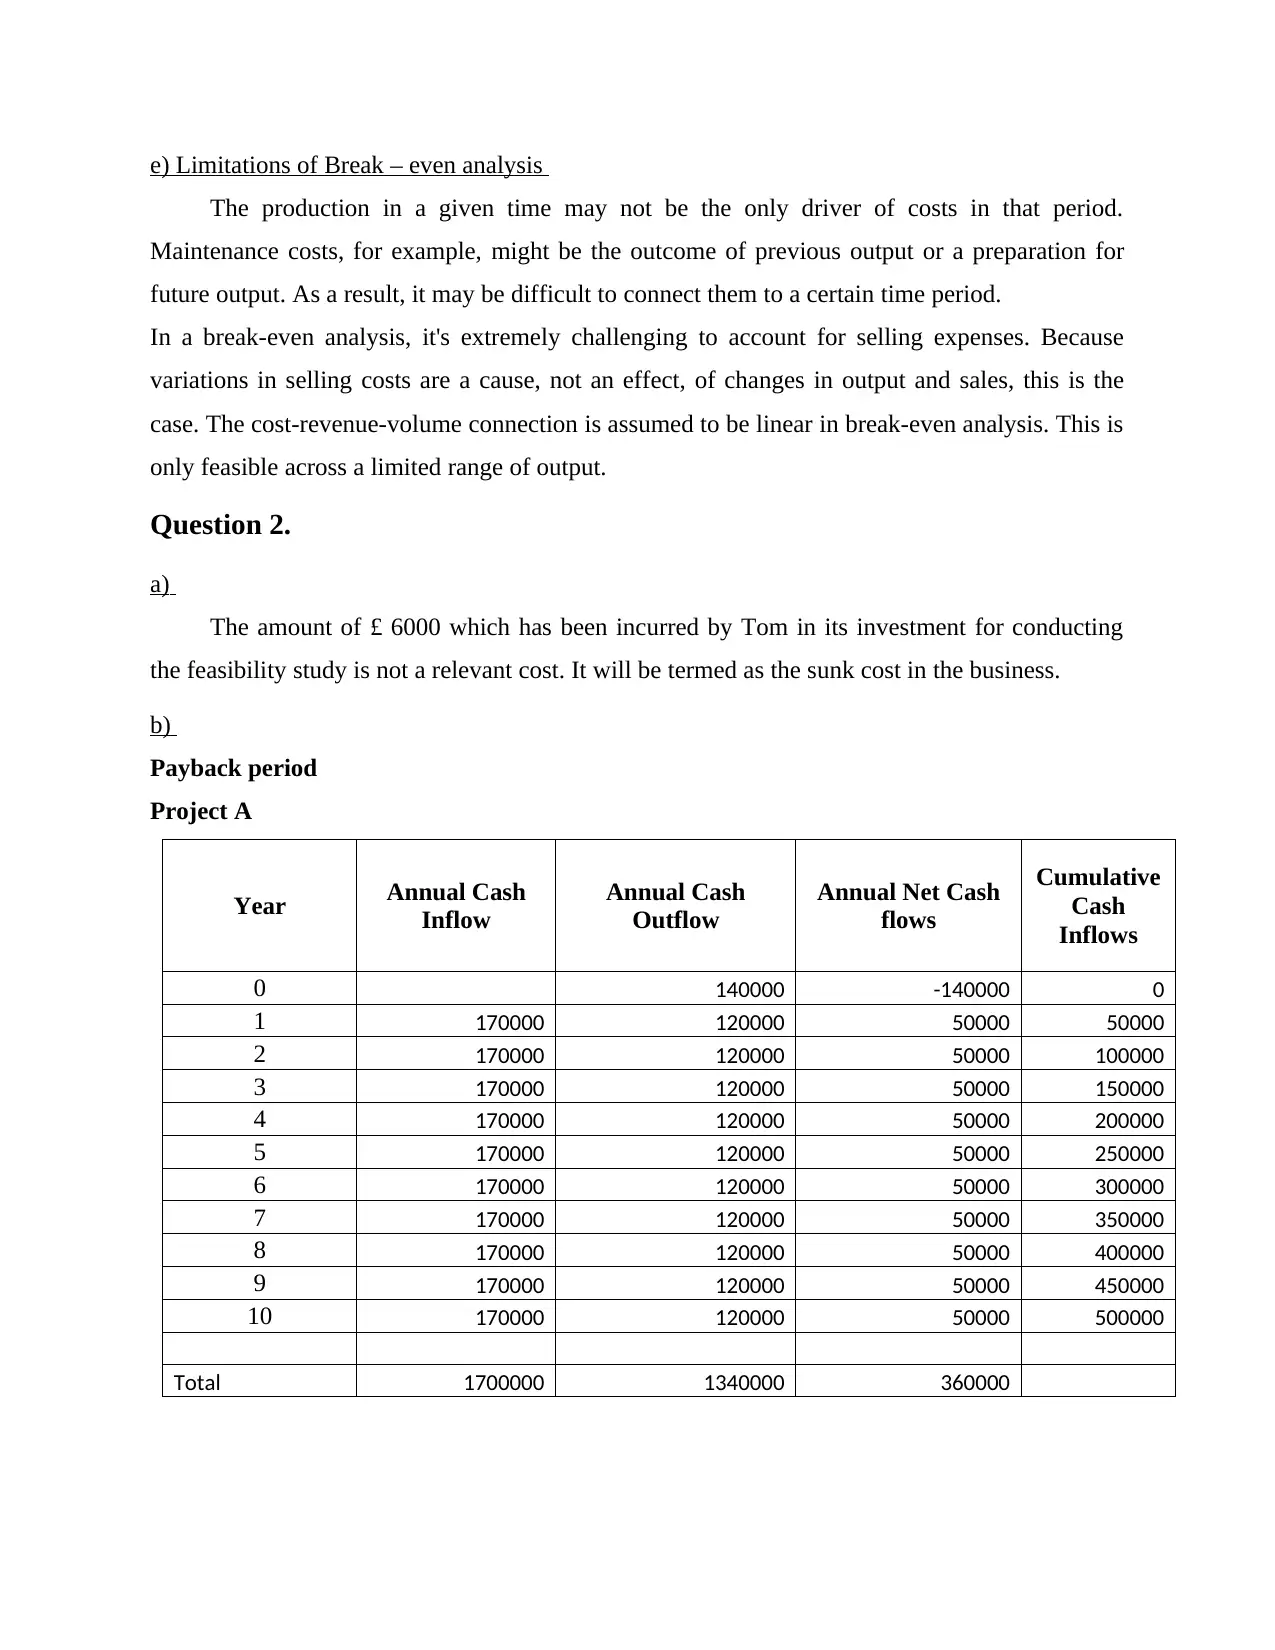
b)
Payback period
Project A
Year Annual Cash
Inflow
Annual Cash
Outflow
Annual Net Cash
flows
Cumulative
Cash
Inflows
0 140000 -140000 0
1 170000 120000 50000 50000
2 170000 120000 50000 100000
3 170000 120000 50000 150000
4 170000 120000 50000 200000
5 170000 120000 50000 250000
6 170000 120000 50000 300000
7 170000 120000 50000 350000
8 170000 120000 50000 400000
9 170000 120000 50000 450000
10 170000 120000 50000 500000
Total 1700000 1340000 360000
The production in a given time may not be the only driver of costs in that period.
Maintenance costs, for example, might be the outcome of previous output or a preparation for
future output. As a result, it may be difficult to connect them to a certain time period.
In a break-even analysis, it's extremely challenging to account for selling expenses. Because
variations in selling costs are a cause, not an effect, of changes in output and sales, this is the
case. The cost-revenue-volume connection is assumed to be linear in break-even analysis. This is
only feasible across a limited range of output.
Question 2.
a)
The amount of £ 6000 which has been incurred by Tom in its investment for conducting
the feasibility study is not a relevant cost. It will be termed as the sunk cost in the business.
b)
Payback period
Project A
Year Annual Cash
Inflow
Annual Cash
Outflow
Annual Net Cash
flows
Cumulative
Cash
Inflows
0 140000 -140000 0
1 170000 120000 50000 50000
2 170000 120000 50000 100000
3 170000 120000 50000 150000
4 170000 120000 50000 200000
5 170000 120000 50000 250000
6 170000 120000 50000 300000
7 170000 120000 50000 350000
8 170000 120000 50000 400000
9 170000 120000 50000 450000
10 170000 120000 50000 500000
Total 1700000 1340000 360000
Paraphrase This Document
Need a fresh take? Get an instant paraphrase of this document with our AI Paraphraser
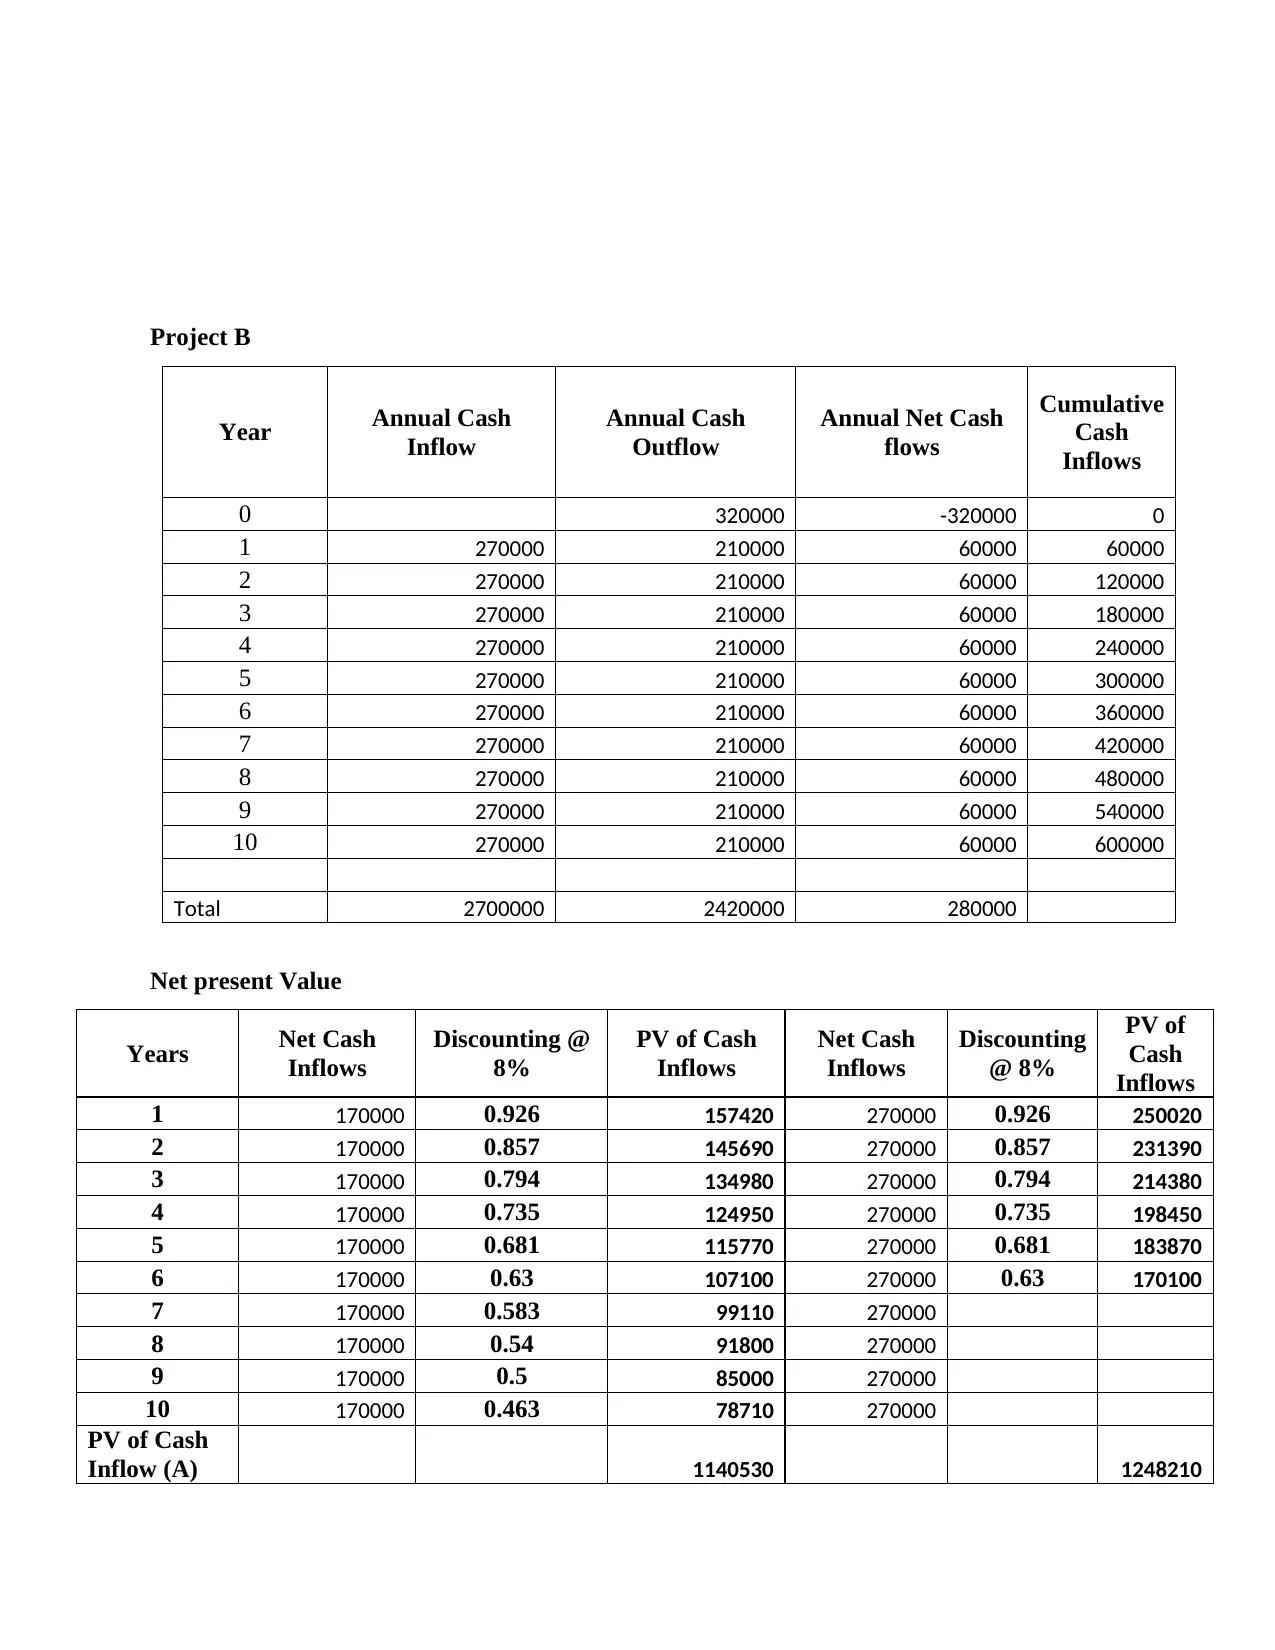
Project B
Year Annual Cash
Inflow
Annual Cash
Outflow
Annual Net Cash
flows
Cumulative
Cash
Inflows
0 320000 -320000 0
1 270000 210000 60000 60000
2 270000 210000 60000 120000
3 270000 210000 60000 180000
4 270000 210000 60000 240000
5 270000 210000 60000 300000
6 270000 210000 60000 360000
7 270000 210000 60000 420000
8 270000 210000 60000 480000
9 270000 210000 60000 540000
10 270000 210000 60000 600000
Total 2700000 2420000 280000
Net present Value
Years Net Cash
Inflows
Discounting @
8%
PV of Cash
Inflows
Net Cash
Inflows
Discounting
@ 8%
PV of
Cash
Inflows
1 170000 0.926 157420 270000 0.926 250020
2 170000 0.857 145690 270000 0.857 231390
3 170000 0.794 134980 270000 0.794 214380
4 170000 0.735 124950 270000 0.735 198450
5 170000 0.681 115770 270000 0.681 183870
6 170000 0.63 107100 270000 0.63 170100
7 170000 0.583 99110 270000
8 170000 0.54 91800 270000
9 170000 0.5 85000 270000
10 170000 0.463 78710 270000
PV of Cash
Inflow (A) 1140530 1248210
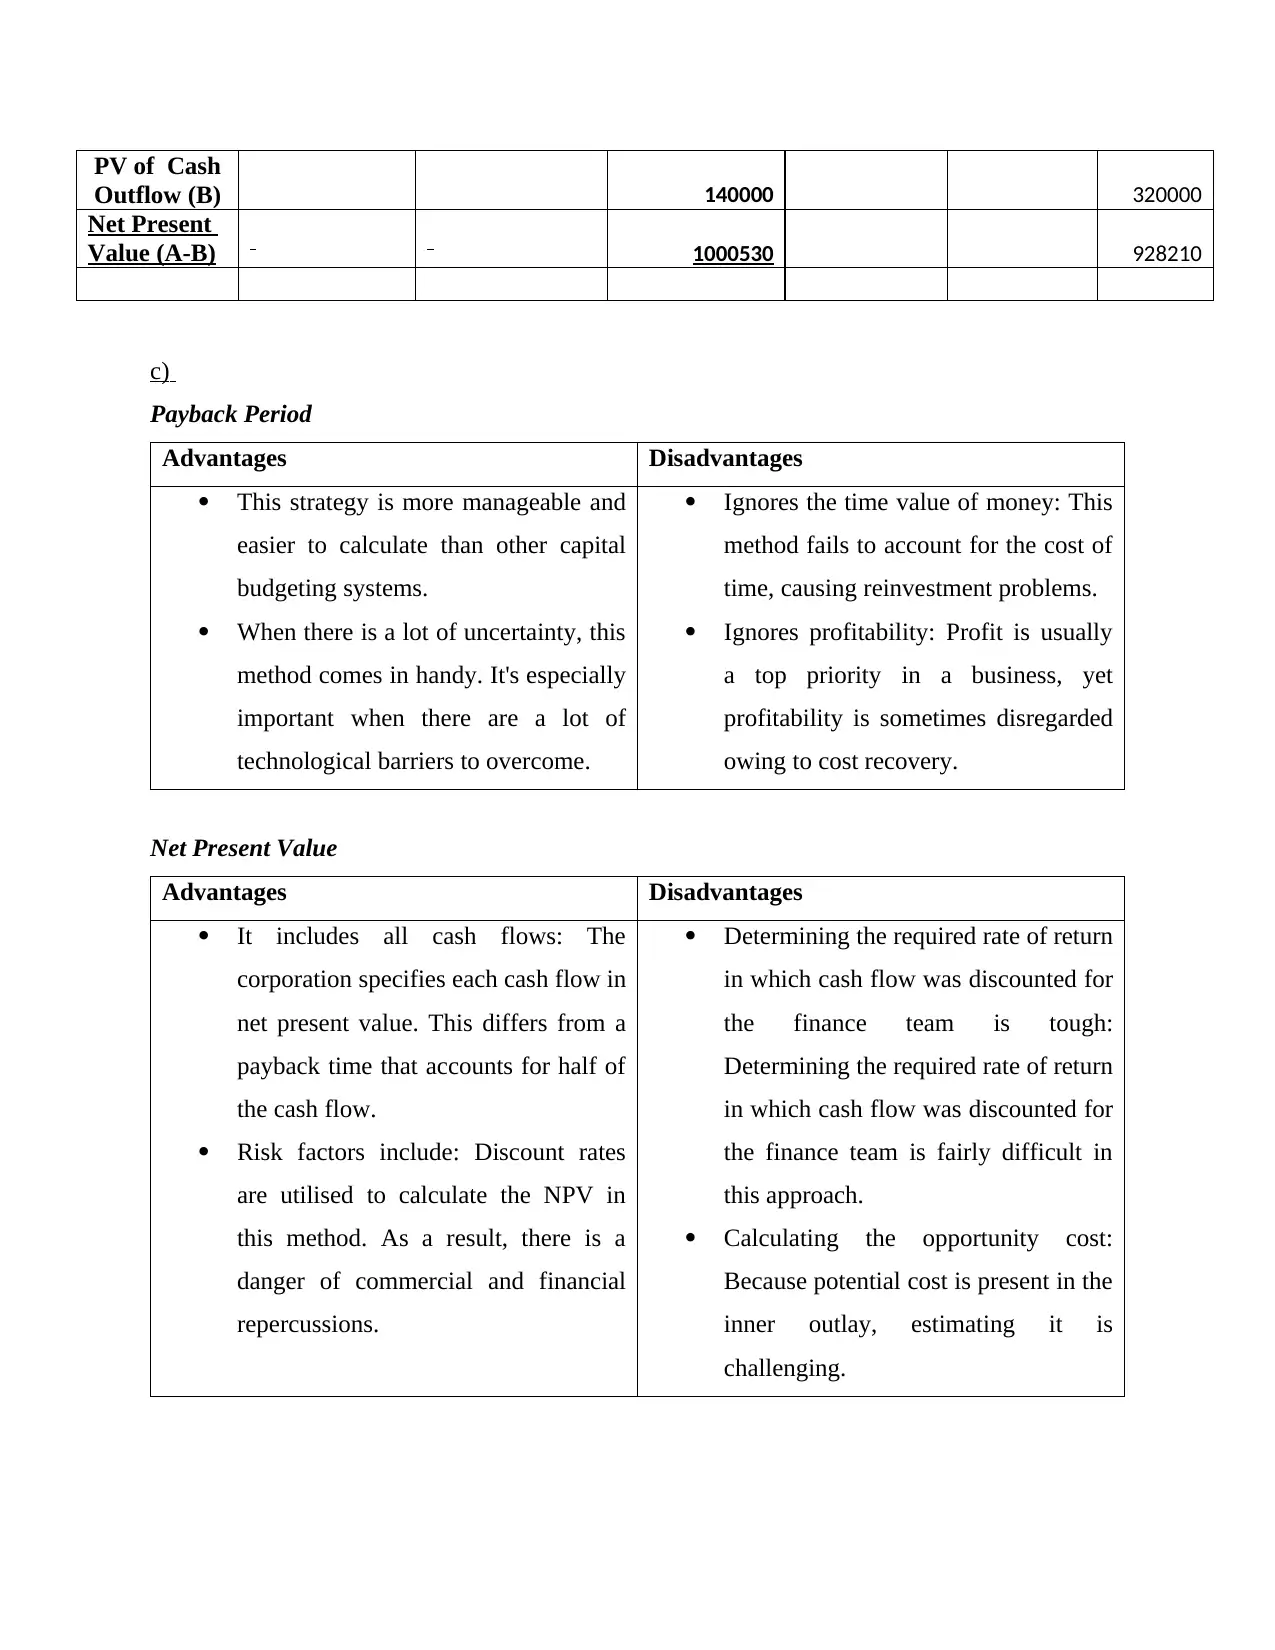
PV of Cash
Outflow (B) 140000 320000
Net Present
Value (A-B) 1000530 928210
c)
Payback Period
Advantages Disadvantages
This strategy is more manageable and
easier to calculate than other capital
budgeting systems.
When there is a lot of uncertainty, this
method comes in handy. It's especially
important when there are a lot of
technological barriers to overcome.
Ignores the time value of money: This
method fails to account for the cost of
time, causing reinvestment problems.
Ignores profitability: Profit is usually
a top priority in a business, yet
profitability is sometimes disregarded
owing to cost recovery.
Net Present Value
Advantages Disadvantages
It includes all cash flows: The
corporation specifies each cash flow in
net present value. This differs from a
payback time that accounts for half of
the cash flow.
Risk factors include: Discount rates
are utilised to calculate the NPV in
this method. As a result, there is a
danger of commercial and financial
repercussions.
Determining the required rate of return
in which cash flow was discounted for
the finance team is tough:
Determining the required rate of return
in which cash flow was discounted for
the finance team is fairly difficult in
this approach.
Calculating the opportunity cost:
Because potential cost is present in the
inner outlay, estimating it is
challenging.
⊘ This is a preview!⊘
Do you want full access?
Subscribe today to unlock all pages.
Trusted by 1+ million students worldwide
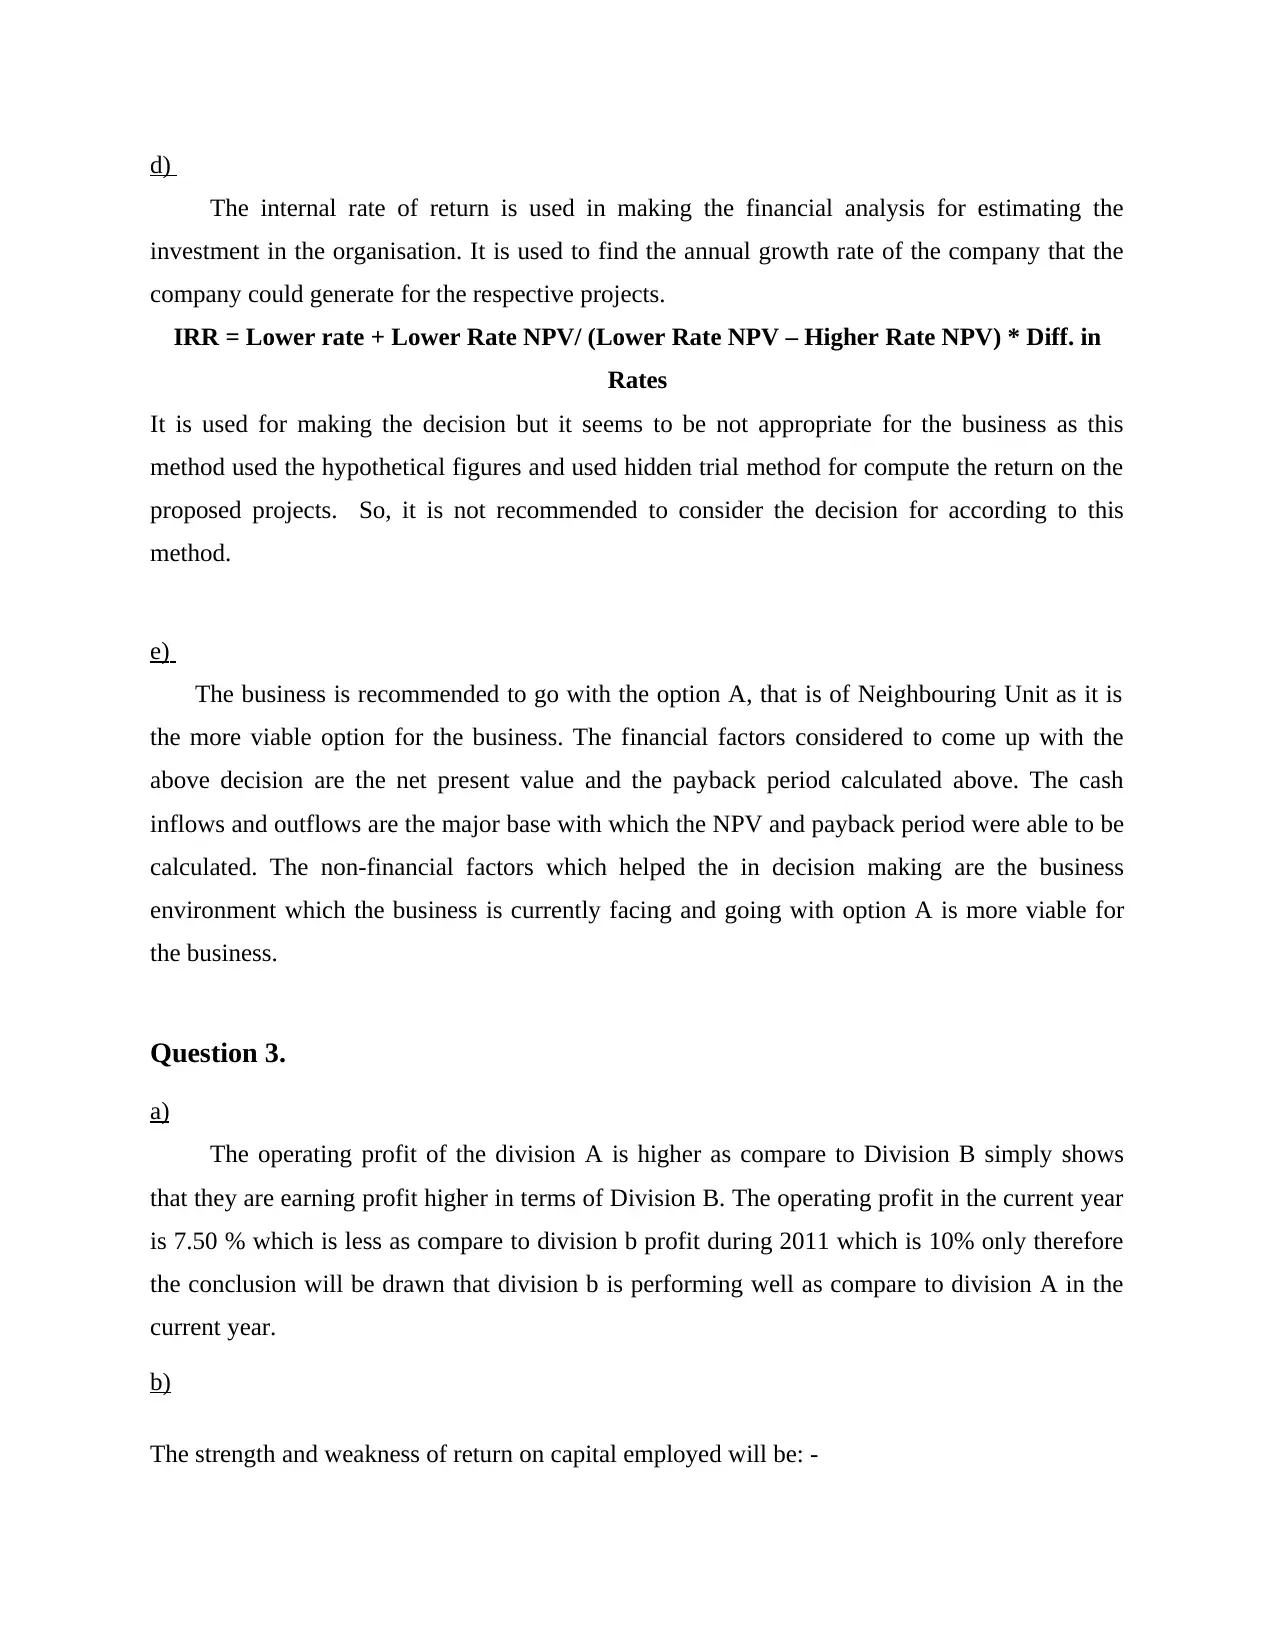
d)
The internal rate of return is used in making the financial analysis for estimating the
investment in the organisation. It is used to find the annual growth rate of the company that the
company could generate for the respective projects.
IRR = Lower rate + Lower Rate NPV/ (Lower Rate NPV – Higher Rate NPV) * Diff. in
Rates
It is used for making the decision but it seems to be not appropriate for the business as this
method used the hypothetical figures and used hidden trial method for compute the return on the
proposed projects. So, it is not recommended to consider the decision for according to this
method.
e)
The business is recommended to go with the option A, that is of Neighbouring Unit as it is
the more viable option for the business. The financial factors considered to come up with the
above decision are the net present value and the payback period calculated above. The cash
inflows and outflows are the major base with which the NPV and payback period were able to be
calculated. The non-financial factors which helped the in decision making are the business
environment which the business is currently facing and going with option A is more viable for
the business.
Question 3.
a)
The operating profit of the division A is higher as compare to Division B simply shows
that they are earning profit higher in terms of Division B. The operating profit in the current year
is 7.50 % which is less as compare to division b profit during 2011 which is 10% only therefore
the conclusion will be drawn that division b is performing well as compare to division A in the
current year.
b)
The strength and weakness of return on capital employed will be: -
Paraphrase This Document
Need a fresh take? Get an instant paraphrase of this document with our AI Paraphraser
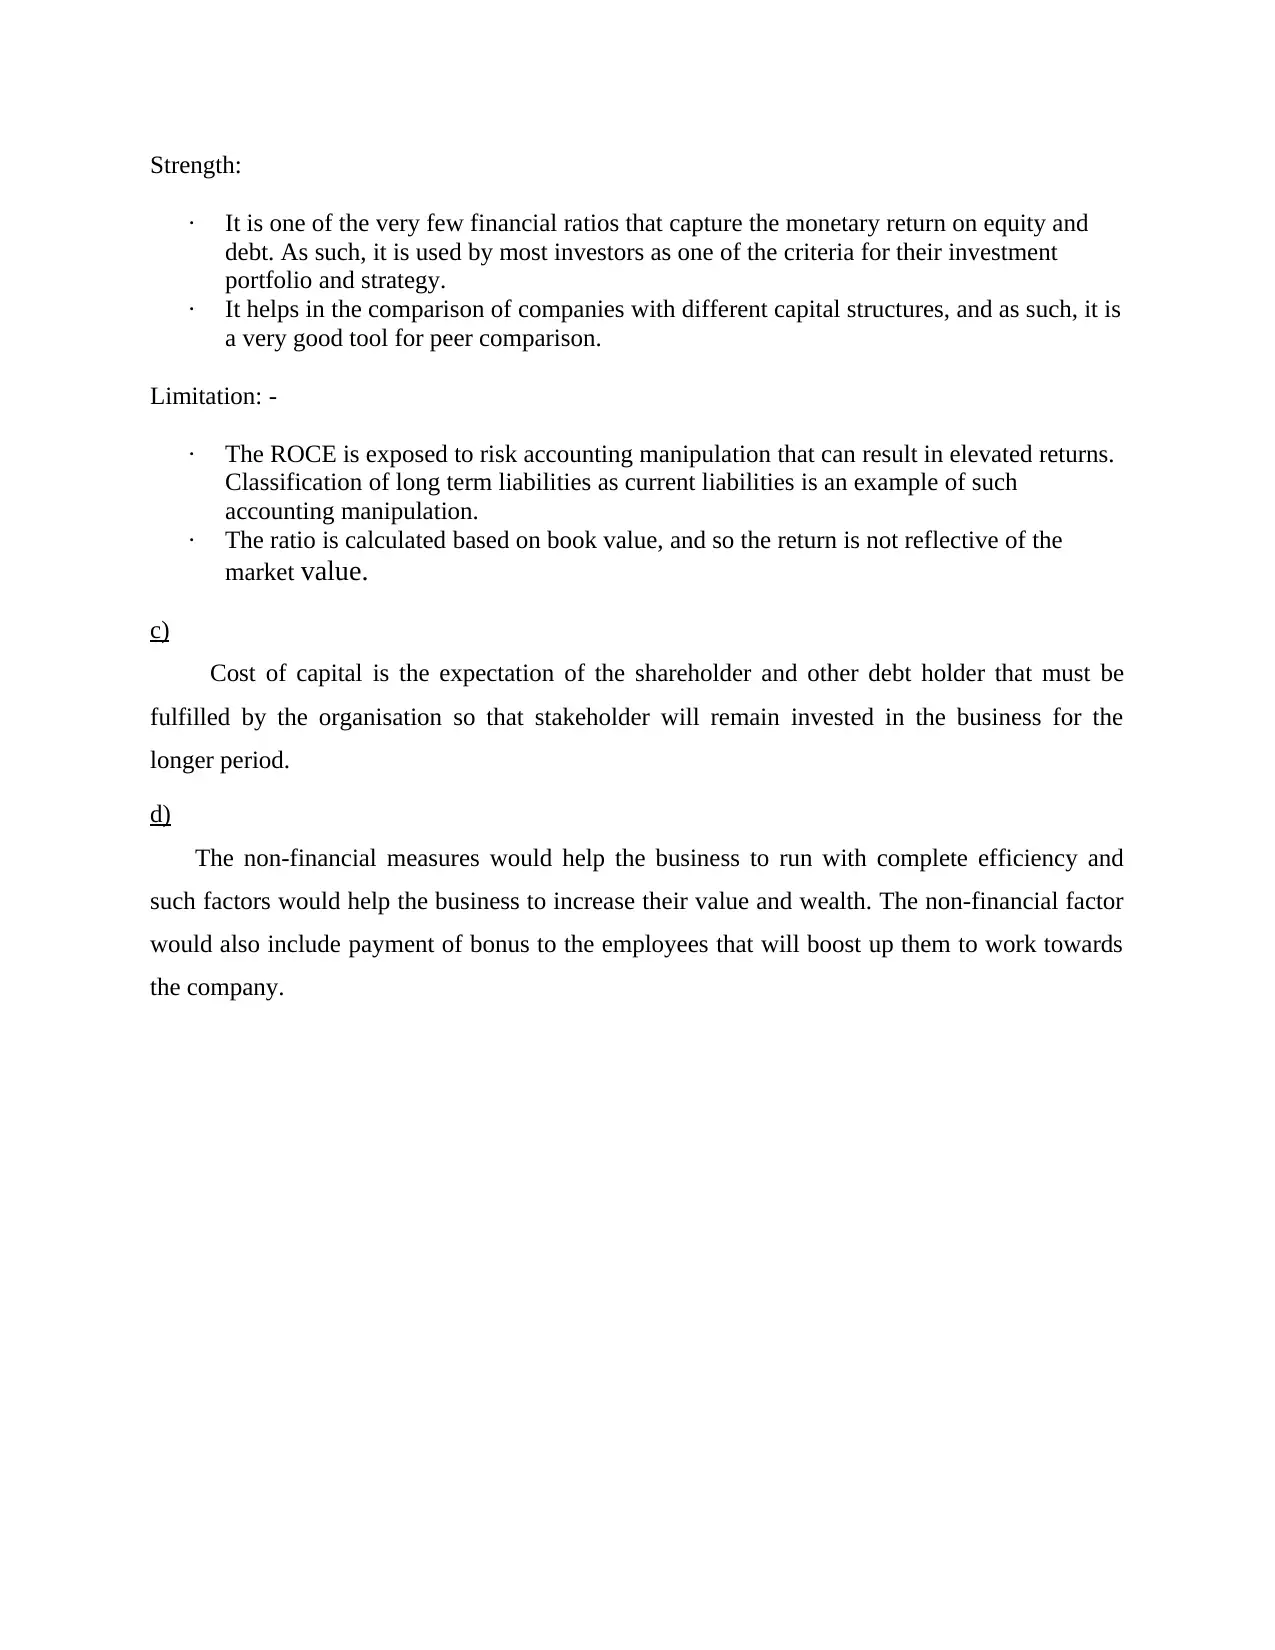
Strength:
· It is one of the very few financial ratios that capture the monetary return on equity and
debt. As such, it is used by most investors as one of the criteria for their investment
portfolio and strategy.
· It helps in the comparison of companies with different capital structures, and as such, it is
a very good tool for peer comparison.
Limitation: -
· The ROCE is exposed to risk accounting manipulation that can result in elevated returns.
Classification of long term liabilities as current liabilities is an example of such
accounting manipulation.
· The ratio is calculated based on book value, and so the return is not reflective of the
market value.
c)
Cost of capital is the expectation of the shareholder and other debt holder that must be
fulfilled by the organisation so that stakeholder will remain invested in the business for the
longer period.
d)
The non-financial measures would help the business to run with complete efficiency and
such factors would help the business to increase their value and wealth. The non-financial factor
would also include payment of bonus to the employees that will boost up them to work towards
the company.
REFERENCES
Books and Journals
Martin, J.D., Keown, A.J. and Titman, S., 2020. Financial management: principles and
applications. Prentice Hall.
Okanazu, O.O., 2018. Financial management decision practices for ensuring business solvency
by small and medium scale enterprises. Acta Oeconomica Universitatis Selye, 7(2),
pp.109-121.
Andreeva, O.V., Vovchenko, N.G., Ivanova, O.B. and Kostoglodova, E.D., 2018. Green finance:
trends and financial regulation prospects. In Contemporary Issues in Business and
Financial Management in Eastern Europe. Emerald Publishing Limited.
Haw, I.M., Hu, B., Wu, D. and Zhang, X., 2018. Having a finger in the pie: labor power and
corporate payout policy. Financial Management, 47(4), pp.993-1027.
Egginton, J.F. and McCumber, W.R., 2019. Executive network centrality and stock liquidity.
Financial Management, 48(3), pp.849-871.
Rachidi, H. and El Mohajir, M., 2021. Improving SMEs’ performance using innovative
knowledge and financial system designed from the Moroccan business environment.
African Journal of Science, Technology, Innovation and Development, 13(1), pp.15-30.
Drake, P.P., Fabozzi, F.J. and Fabozzi, F.A., 2022. Financial risk management. World Scientific
Book Chapters, pp.295-311.
Byun, H.S., Kim, W., Lee, E.J. and Park, K.S., 2019. When and why do takeovers lead to fraud?.
Financial Management, 48(1), pp.45-76.
Grossi, G., Ho, A.T. and Joyce, P.G., 2020. Budgetary responses to a global pandemic:
international experiences and lessons for a sustainable future. Journal of Public
Budgeting, Accounting & Financial Management.
Islam, M.A., Liu, H., Khan, M.A., Islam, M.T. and Sultanuzzaman, M.R., 2021. Does foreign
direct investment deepen the financial system in Southeast Asian economies?. Journal
of Multinational Financial Management, 61, p.100682.
⊘ This is a preview!⊘
Do you want full access?
Subscribe today to unlock all pages.
Trusted by 1+ million students worldwide
1 out of 12
Related Documents


Your All-in-One AI-Powered Toolkit for Academic Success.
+13062052269
info@desklib.com
Available 24*7 on WhatsApp / Email
![[object Object]](/_next/static/media/star-bottom.7253800d.svg)
Unlock your academic potential
Copyright © 2020–2026 A2Z Services. All Rights Reserved. Developed and managed by ZUCOL.