Corporate Financial Management: GE Risk and Valuation Analysis
VerifiedAdded on 2022/08/18
|24
|4609
|25
Report
AI Summary
This report offers a comprehensive financial analysis of the General Electric Company, examining its financial performance, position, and strength. It begins with an executive summary and table of contents, followed by an introduction outlining the report's objectives. The analysis is divided into four parts. Part 1 assesses GE's risk profile, including business risks (sales growth, EBIT analysis, operating leverage), systematic risks (beta analysis), and financial risks (financial leverage, capital gearing). Part 2 focuses on valuation, employing net asset value, dividend valuation, price-earnings ratio, and cash flow-based models. Part 3 explores GE's investment strategies, capital structure, mergers and acquisitions, and Part 4 analyzes the company's dividend policy. The report uses figures and tables to present data from the annual reports, providing insights into GE's corporate strategies and financial health. This analysis can help in understanding the financial position and strength of the company, and helps in assessing the corporate strategies and risk mitigation measures undertaken by the company.

Running head: CORPORATE FINANCIAL MANAGEMENT
Corporate Financial Management
Name of the Student:
Name of the University:
Author’s Note:
Corporate Financial Management
Name of the Student:
Name of the University:
Author’s Note:
Paraphrase This Document
Need a fresh take? Get an instant paraphrase of this document with our AI Paraphraser
1CORPORATE FINANCIAL MANAGEMENT
Executive Summary:
This report has been prepared to analyse various financial measures of the General
Electric Co. to understand and interpret the financial performance, finance position and
financial strength of the company. A risk profile analysis has been conducted to understand
the level of risk the company is assuming and the return relevant to that risk. Various
measures and parameters have been used for analysing the internal risks as well as market
related risks classifying them into systematic risks and unsystematic risks. Further a valuation
has been made using various valuation methods to find out the intrinsic value of the business
of the General Electric Co. which can be compared with the market price of their share to
make an investment decision. Lastly, a detailed analysis of the mergers and acquisitions made
by the company has been conducted to understand their corporate strategies in changing
scenarios along with an analysis of their dividend policies.
2CORPORATE FINANCIAL MANAGEMENT
Table of Contents
Introduction................................................................................................................................5
Part 1:.........................................................................................................................................5
i) Sales growth rate and sales forecast...................................................................................5
ii) Business Risk.....................................................................................................................6
iii) Systematic Risks...............................................................................................................9
iv) Financial Risks................................................................................................................10
v) Ratio Analysis..................................................................................................................12
vi) Actions that the management should take to manage risk..............................................14
Part 2:.......................................................................................................................................14
i) Net Assets Value Method.................................................................................................15
ii) Dividend Valuation Model..............................................................................................16
iii) Price Earnings Ratio Model............................................................................................16
iv) Cash flow based model...................................................................................................17
Part 3:.......................................................................................................................................18
i) Investment.........................................................................................................................18
ii) Capital Structure..............................................................................................................19
iii) Merger and acquisition by the General Electric Company............................................20
Part 4:.......................................................................................................................................21
i) Analysis of the dividend policy........................................................................................21
References:...............................................................................................................................22
⊘ This is a preview!⊘
Do you want full access?
Subscribe today to unlock all pages.
Trusted by 1+ million students worldwide

3CORPORATE FINANCIAL MANAGEMENT
Paraphrase This Document
Need a fresh take? Get an instant paraphrase of this document with our AI Paraphraser
4CORPORATE FINANCIAL MANAGEMENT
Table of Figures
Figure 1: Sales growth and sales forecast..................................................................................5
Figure 2: Comparison between EBIT and Sales Revenue.........................................................6
Figure 3: Degree of Operating Leverage of General Electric Company...................................7
Figure 4: Operating profit of the General Electric Company....................................................7
Figure 5: Beta analysis of the General Electric Company.........................................................9
Figure 6: Degree of Financial Leverage of the General Electric Company.............................10
Figure 7: Capital Gearing Ratio of the General Electric Company.........................................11
Figure 8: Trend in Capital Gearing Ratio................................................................................12
Figure 9: Current Ratio of the General Electric Company......................................................12
Figure 10: Trend in Current Ratio............................................................................................13
Figure 11: Net Assets Value of the General Electric Company...............................................14
Figure 12: Valuation of shares under Dividend Growth Model..............................................15
Figure 13: Valuation of shares under Price Earnings Ratio Model.........................................16
Figure 14: Valuation under discounted cash flow method.......................................................17
Figure 15: Net Worth and Market Price of Shares...................................................................18
Figure 16: Debt Equity Mix.....................................................................................................18
Figure 17: Top 10 deals by the General Electric Company.....................................................19
Figure 18: Graph showing Mergers and Acquisitions.............................................................20
5CORPORATE FINANCIAL MANAGEMENT
Introduction
Every business organisation has to assume certain level of risk to continue their
business and to achieve their business objectives. This report has been prepared base on the
analysis of the risk profile of the General Electric Company. It also includes the valuation of
business of the General Electric Company and a detailed analysis of their corporate strategies
in growing up their business through various generic and non-generic ways. In the first part
the risk profile analysis for the General Electric Company has been made, and then the
valuation of business of the General Electric Company can help in understanding the
financial position and strength of the company. Lastly, the analysis of the merger and
acquisitions and dividend policy of the company can help in understanding the corporate
strategies of the company is achieving a sustainable growth for their business.
Part 1:
The risk profile of the General has been analysed classifying into two parts, business
risks and systematic risks. For such an analysis of the risk profile of the General Electric
Company, information has been taken from the annual report and financial statement of the
company. Various figures and measures from the annual reports has been taken for analysing
the risks and presented using tables and graphs as follows.
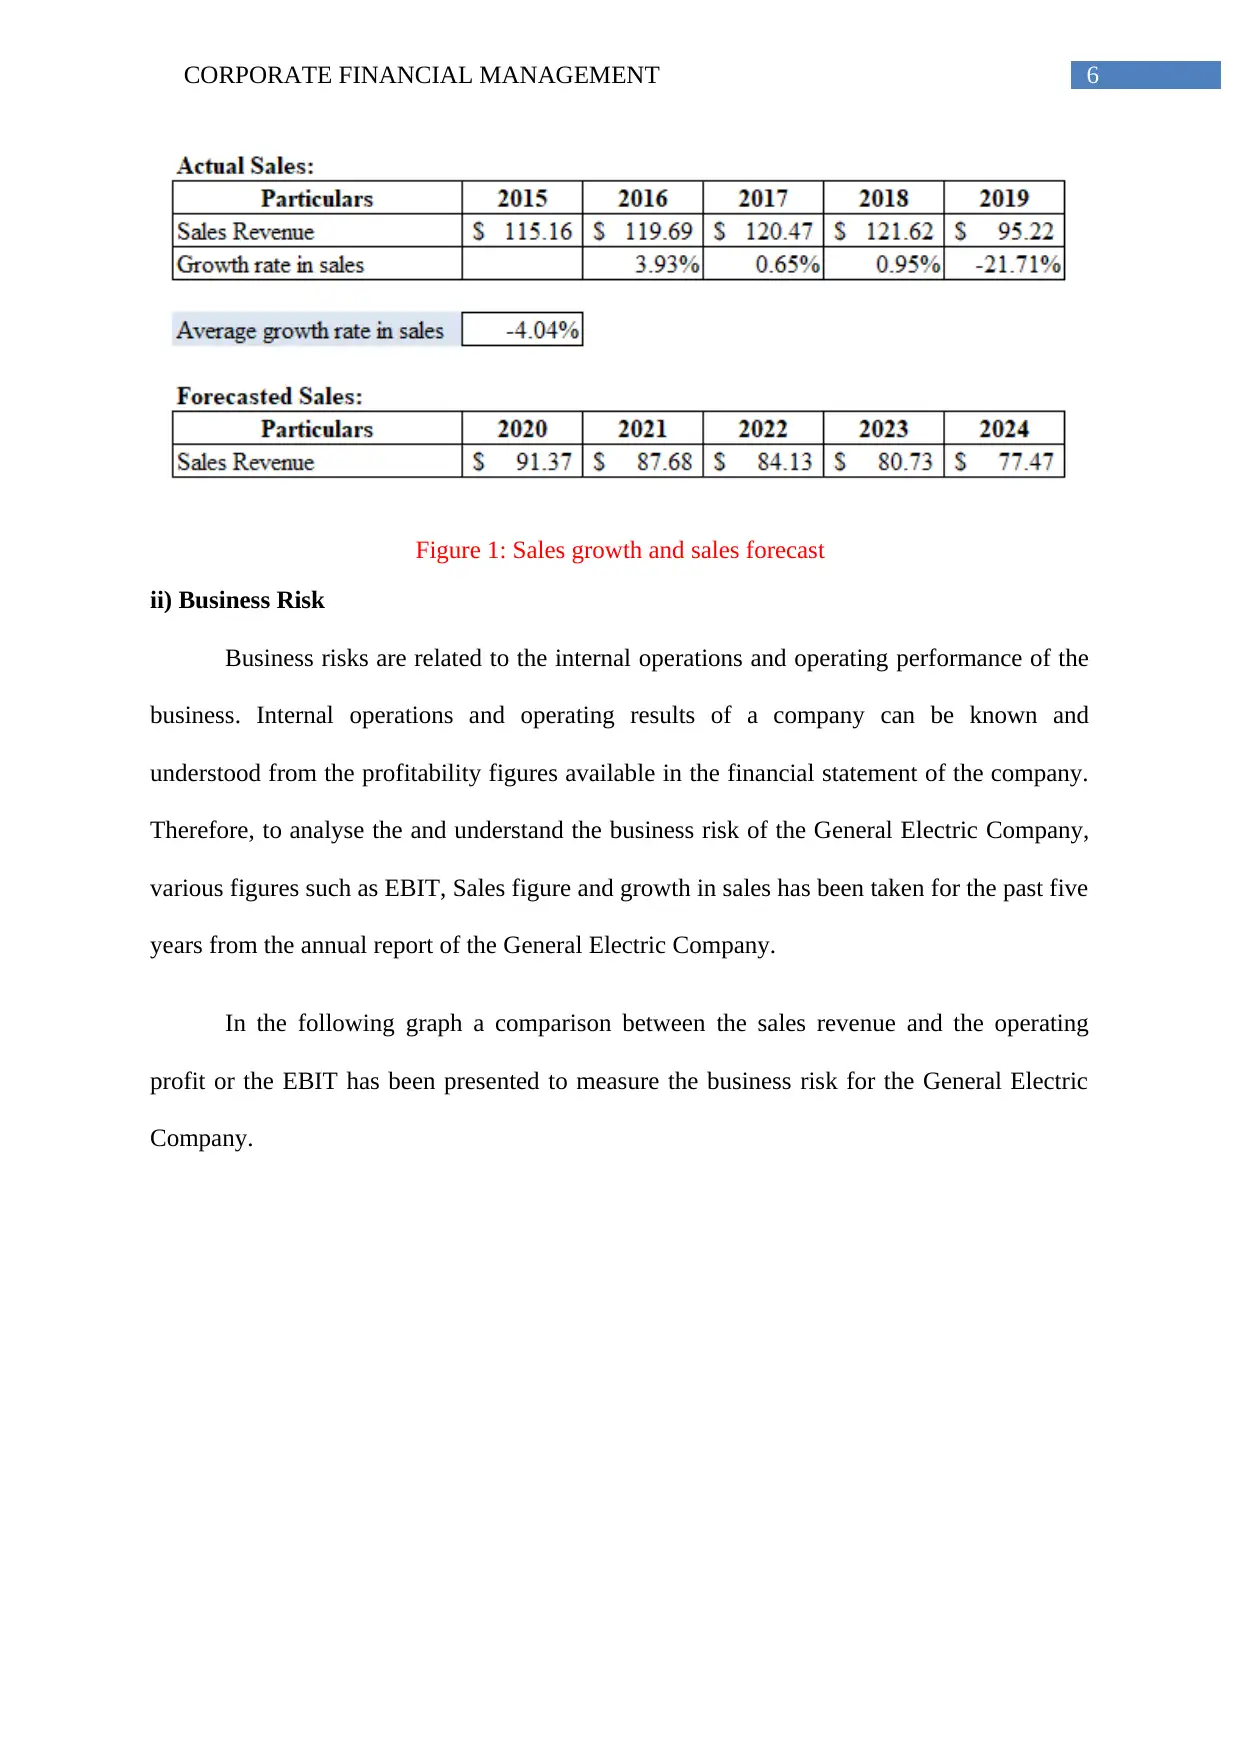
i) Sales growth rate and sales forecast
It can be observed from the last five years sales of the General Electric that that is a
decrease or a negative sales growth. The average sales growth as have been computed in the
table below is -4.04%. Assuming that the same trend will be prevailing in the future years,
the sales forecast have also been shown in the table below.
Introduction
Every business organisation has to assume certain level of risk to continue their
business and to achieve their business objectives. This report has been prepared base on the
analysis of the risk profile of the General Electric Company. It also includes the valuation of
business of the General Electric Company and a detailed analysis of their corporate strategies
in growing up their business through various generic and non-generic ways. In the first part
the risk profile analysis for the General Electric Company has been made, and then the
valuation of business of the General Electric Company can help in understanding the
financial position and strength of the company. Lastly, the analysis of the merger and
acquisitions and dividend policy of the company can help in understanding the corporate
strategies of the company is achieving a sustainable growth for their business.
Part 1:
The risk profile of the General has been analysed classifying into two parts, business
risks and systematic risks. For such an analysis of the risk profile of the General Electric
Company, information has been taken from the annual report and financial statement of the
company. Various figures and measures from the annual reports has been taken for analysing
the risks and presented using tables and graphs as follows.
i) Sales growth rate and sales forecast
It can be observed from the last five years sales of the General Electric that that is a
decrease or a negative sales growth. The average sales growth as have been computed in the
table below is -4.04%. Assuming that the same trend will be prevailing in the future years,
the sales forecast have also been shown in the table below.
⊘ This is a preview!⊘
Do you want full access?
Subscribe today to unlock all pages.
Trusted by 1+ million students worldwide
6CORPORATE FINANCIAL MANAGEMENT
Figure 1: Sales growth and sales forecast
ii) Business Risk
Business risks are related to the internal operations and operating performance of the
business. Internal operations and operating results of a company can be known and
understood from the profitability figures available in the financial statement of the company.
Therefore, to analyse the and understand the business risk of the General Electric Company,
various figures such as EBIT, Sales figure and growth in sales has been taken for the past five
years from the annual report of the General Electric Company.
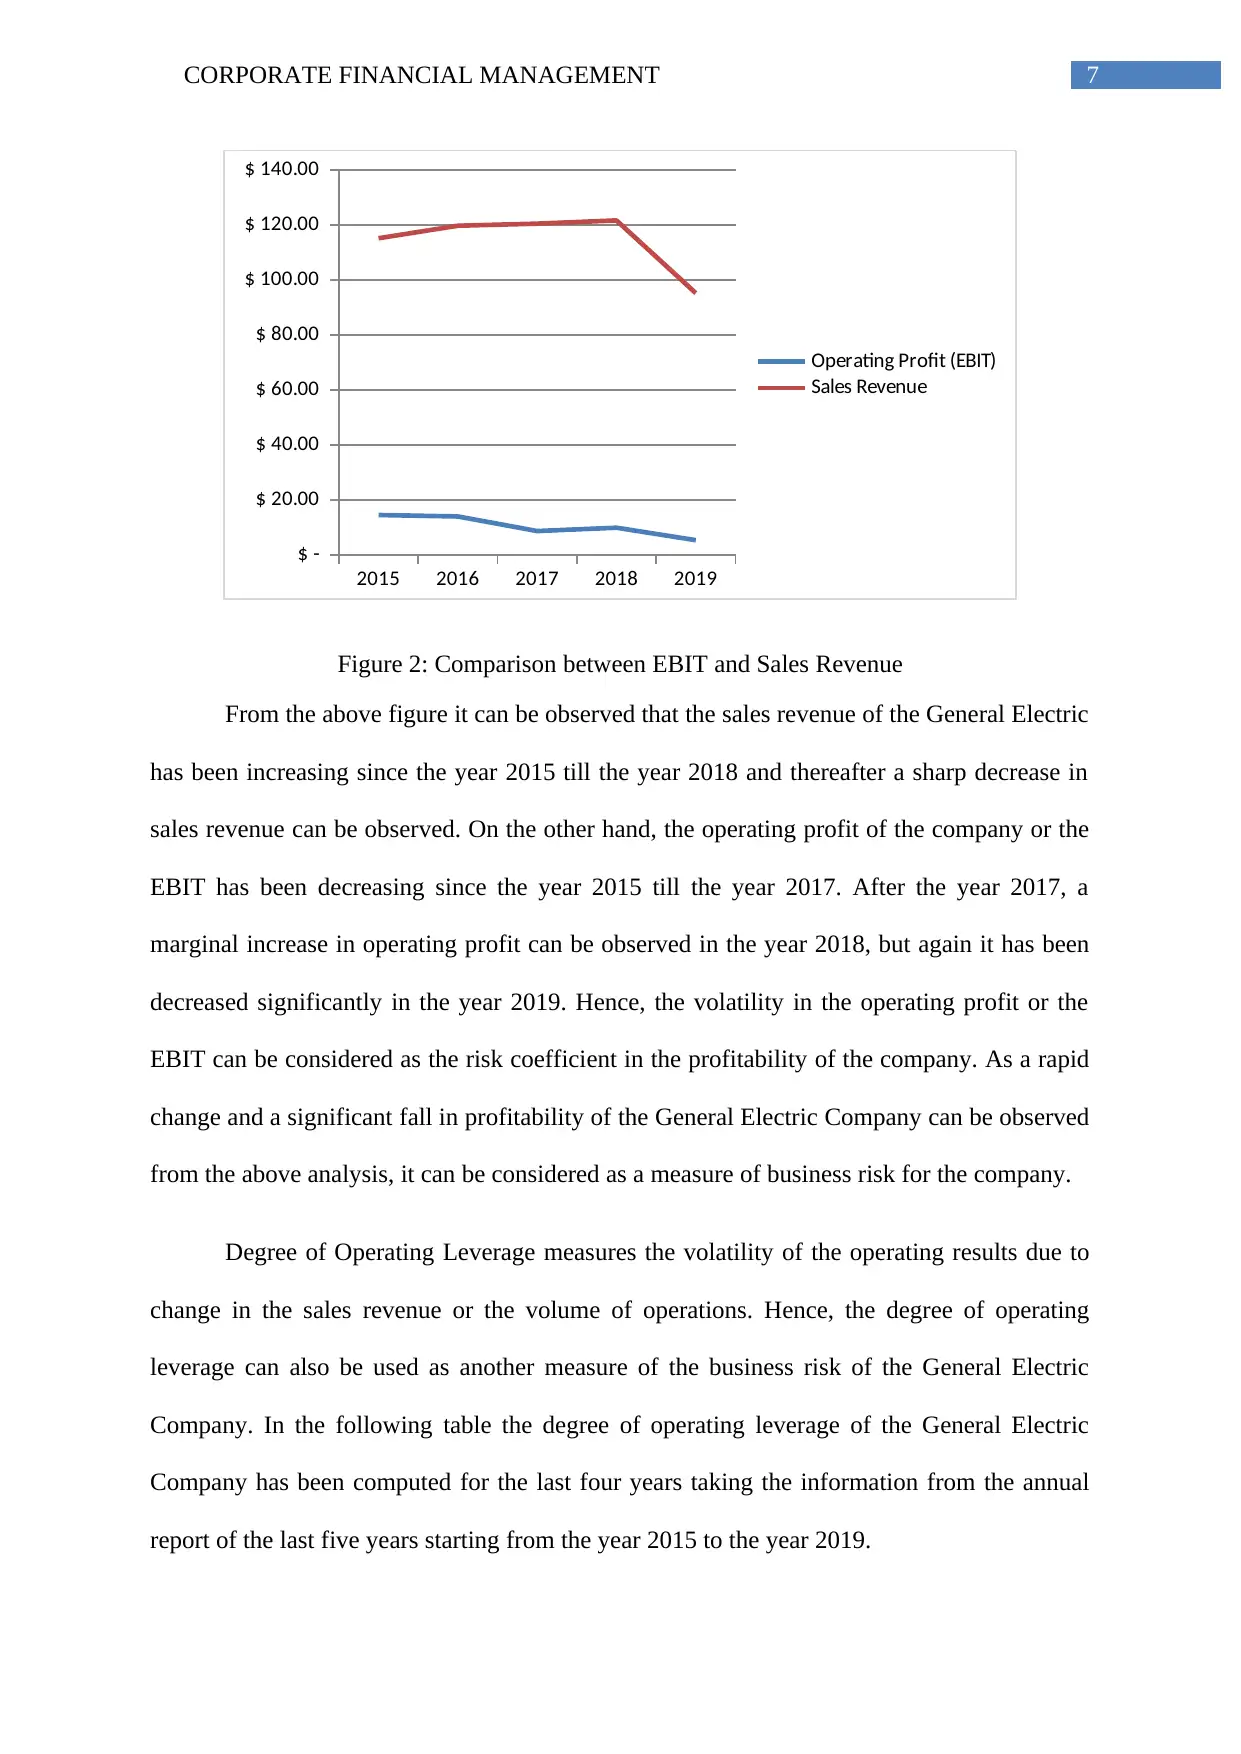
In the following graph a comparison between the sales revenue and the operating
profit or the EBIT has been presented to measure the business risk for the General Electric
Company.
Figure 1: Sales growth and sales forecast
ii) Business Risk
Business risks are related to the internal operations and operating performance of the
business. Internal operations and operating results of a company can be known and
understood from the profitability figures available in the financial statement of the company.
Therefore, to analyse the and understand the business risk of the General Electric Company,
various figures such as EBIT, Sales figure and growth in sales has been taken for the past five
years from the annual report of the General Electric Company.
In the following graph a comparison between the sales revenue and the operating
profit or the EBIT has been presented to measure the business risk for the General Electric
Company.
Paraphrase This Document
Need a fresh take? Get an instant paraphrase of this document with our AI Paraphraser
7CORPORATE FINANCIAL MANAGEMENT
2015 2016 2017 2018 2019
$ -
$ 20.00
$ 40.00
$ 60.00
$ 80.00
$ 100.00
$ 120.00
$ 140.00
Operating Profit (EBIT)
Sales Revenue
Figure 2: Comparison between EBIT and Sales Revenue
From the above figure it can be observed that the sales revenue of the General Electric
has been increasing since the year 2015 till the year 2018 and thereafter a sharp decrease in
sales revenue can be observed. On the other hand, the operating profit of the company or the
EBIT has been decreasing since the year 2015 till the year 2017. After the year 2017, a
marginal increase in operating profit can be observed in the year 2018, but again it has been
decreased significantly in the year 2019. Hence, the volatility in the operating profit or the
EBIT can be considered as the risk coefficient in the profitability of the company. As a rapid
change and a significant fall in profitability of the General Electric Company can be observed
from the above analysis, it can be considered as a measure of business risk for the company.
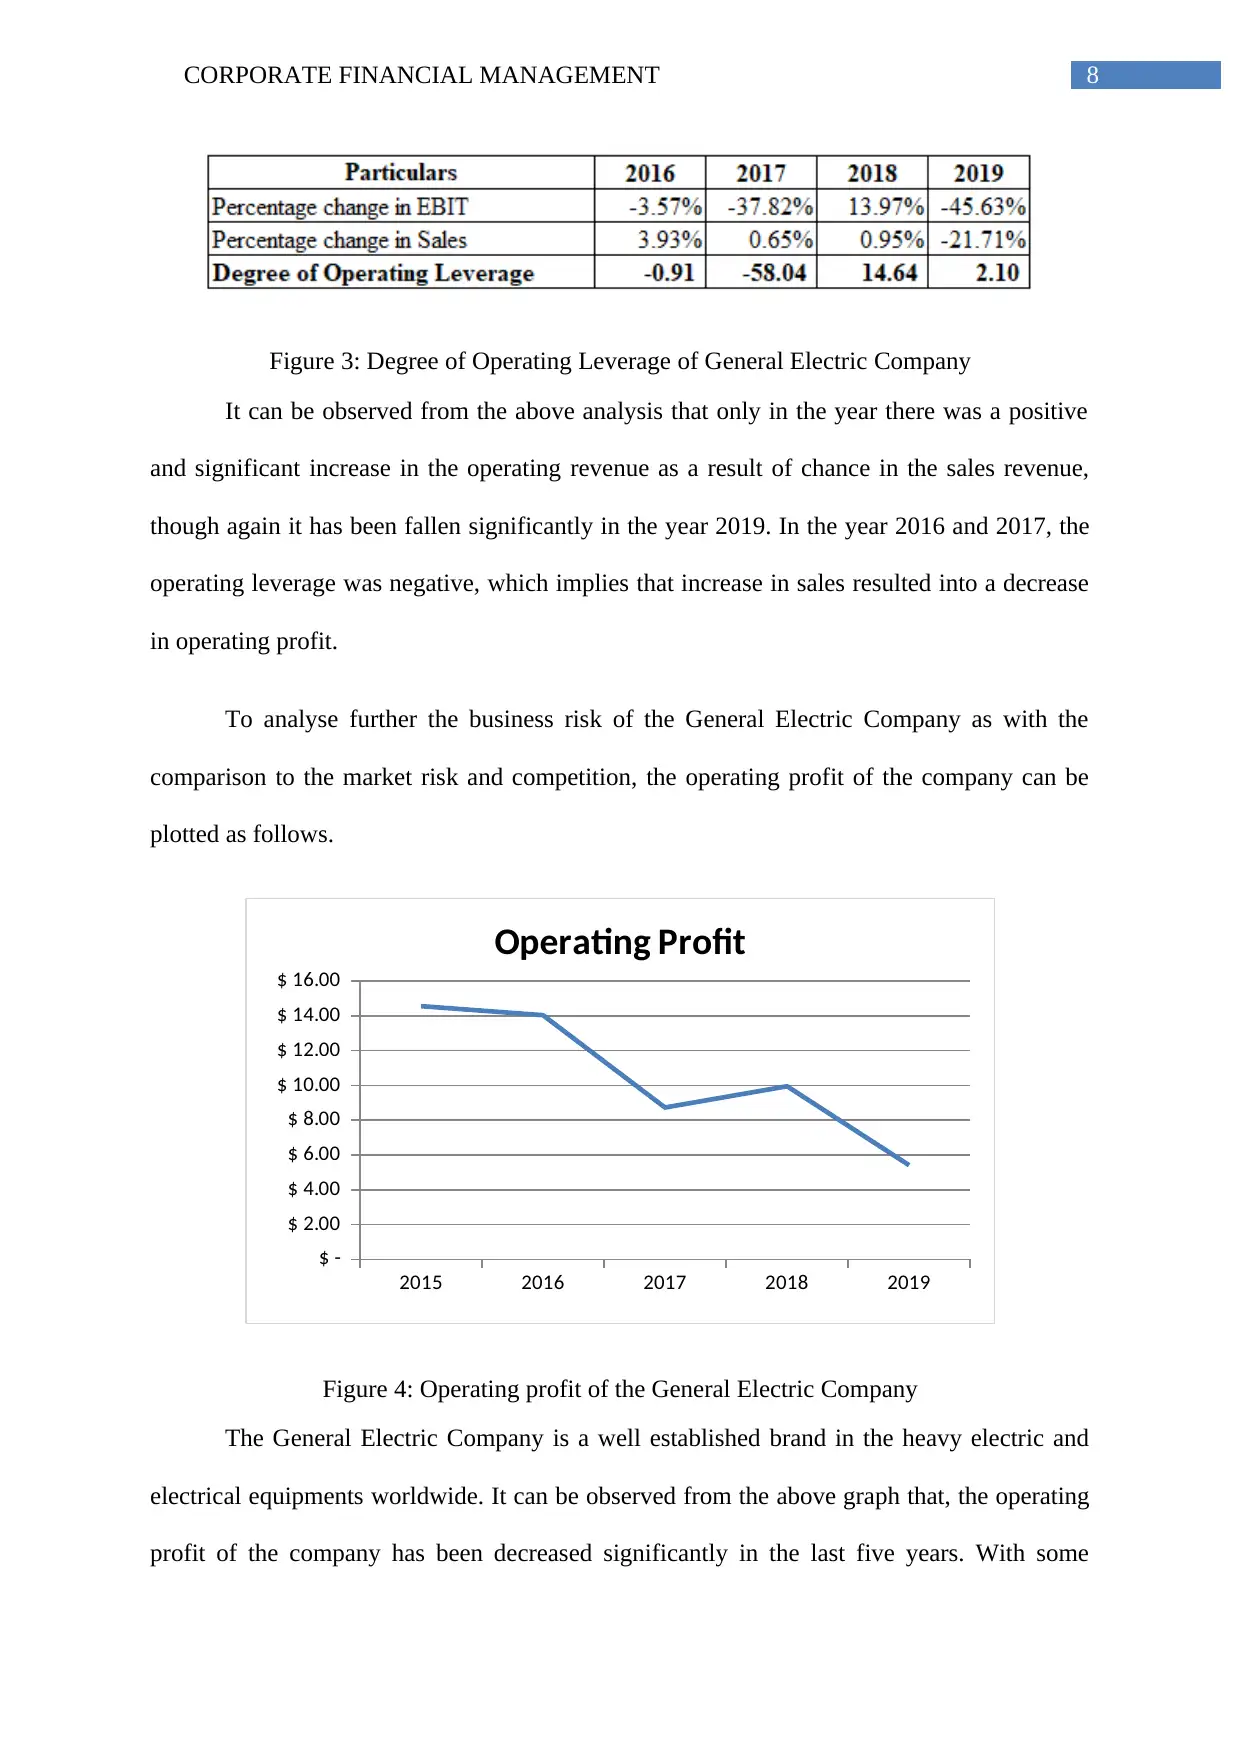
Degree of Operating Leverage measures the volatility of the operating results due to
change in the sales revenue or the volume of operations. Hence, the degree of operating
leverage can also be used as another measure of the business risk of the General Electric
Company. In the following table the degree of operating leverage of the General Electric
Company has been computed for the last four years taking the information from the annual
report of the last five years starting from the year 2015 to the year 2019.
2015 2016 2017 2018 2019
$ -
$ 20.00
$ 40.00
$ 60.00
$ 80.00
$ 100.00
$ 120.00
$ 140.00
Operating Profit (EBIT)
Sales Revenue
Figure 2: Comparison between EBIT and Sales Revenue
From the above figure it can be observed that the sales revenue of the General Electric
has been increasing since the year 2015 till the year 2018 and thereafter a sharp decrease in
sales revenue can be observed. On the other hand, the operating profit of the company or the
EBIT has been decreasing since the year 2015 till the year 2017. After the year 2017, a
marginal increase in operating profit can be observed in the year 2018, but again it has been
decreased significantly in the year 2019. Hence, the volatility in the operating profit or the
EBIT can be considered as the risk coefficient in the profitability of the company. As a rapid
change and a significant fall in profitability of the General Electric Company can be observed
from the above analysis, it can be considered as a measure of business risk for the company.
Degree of Operating Leverage measures the volatility of the operating results due to
change in the sales revenue or the volume of operations. Hence, the degree of operating
leverage can also be used as another measure of the business risk of the General Electric
Company. In the following table the degree of operating leverage of the General Electric
Company has been computed for the last four years taking the information from the annual
report of the last five years starting from the year 2015 to the year 2019.
8CORPORATE FINANCIAL MANAGEMENT
Figure 3: Degree of Operating Leverage of General Electric Company
It can be observed from the above analysis that only in the year there was a positive
and significant increase in the operating revenue as a result of chance in the sales revenue,
though again it has been fallen significantly in the year 2019. In the year 2016 and 2017, the
operating leverage was negative, which implies that increase in sales resulted into a decrease
in operating profit.
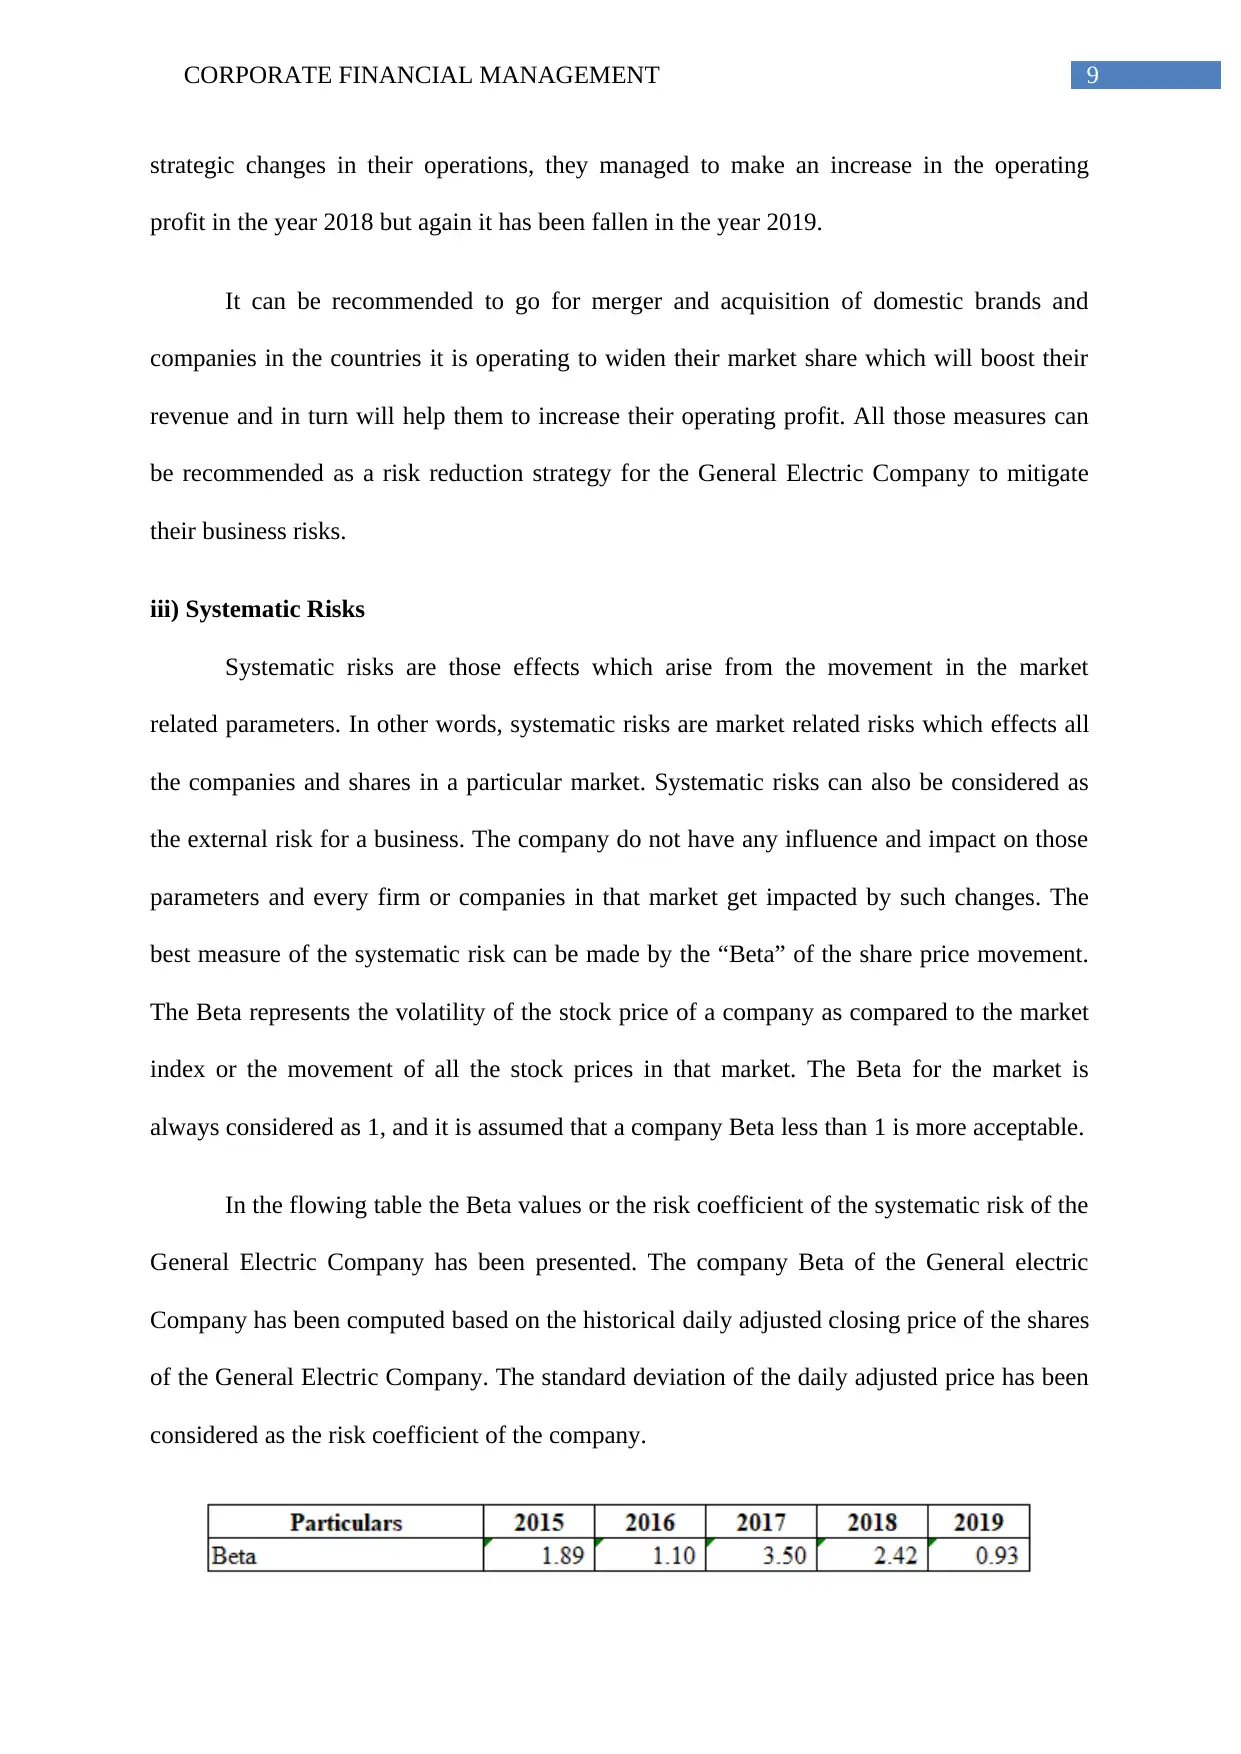
To analyse further the business risk of the General Electric Company as with the
comparison to the market risk and competition, the operating profit of the company can be
plotted as follows.
2015 2016 2017 2018 2019
$ -
$ 2.00
$ 4.00
$ 6.00
$ 8.00
$ 10.00
$ 12.00
$ 14.00
$ 16.00
Operating Profit
Figure 4: Operating profit of the General Electric Company
The General Electric Company is a well established brand in the heavy electric and
electrical equipments worldwide. It can be observed from the above graph that, the operating
profit of the company has been decreased significantly in the last five years. With some
Figure 3: Degree of Operating Leverage of General Electric Company
It can be observed from the above analysis that only in the year there was a positive
and significant increase in the operating revenue as a result of chance in the sales revenue,
though again it has been fallen significantly in the year 2019. In the year 2016 and 2017, the
operating leverage was negative, which implies that increase in sales resulted into a decrease
in operating profit.
To analyse further the business risk of the General Electric Company as with the
comparison to the market risk and competition, the operating profit of the company can be
plotted as follows.
2015 2016 2017 2018 2019
$ -
$ 2.00
$ 4.00
$ 6.00
$ 8.00
$ 10.00
$ 12.00
$ 14.00
$ 16.00
Operating Profit
Figure 4: Operating profit of the General Electric Company
The General Electric Company is a well established brand in the heavy electric and
electrical equipments worldwide. It can be observed from the above graph that, the operating
profit of the company has been decreased significantly in the last five years. With some
⊘ This is a preview!⊘
Do you want full access?
Subscribe today to unlock all pages.
Trusted by 1+ million students worldwide
9CORPORATE FINANCIAL MANAGEMENT
strategic changes in their operations, they managed to make an increase in the operating
profit in the year 2018 but again it has been fallen in the year 2019.
It can be recommended to go for merger and acquisition of domestic brands and
companies in the countries it is operating to widen their market share which will boost their
revenue and in turn will help them to increase their operating profit. All those measures can
be recommended as a risk reduction strategy for the General Electric Company to mitigate
their business risks.
iii) Systematic Risks
Systematic risks are those effects which arise from the movement in the market
related parameters. In other words, systematic risks are market related risks which effects all
the companies and shares in a particular market. Systematic risks can also be considered as
the external risk for a business. The company do not have any influence and impact on those
parameters and every firm or companies in that market get impacted by such changes. The
best measure of the systematic risk can be made by the “Beta” of the share price movement.
The Beta represents the volatility of the stock price of a company as compared to the market
index or the movement of all the stock prices in that market. The Beta for the market is
always considered as 1, and it is assumed that a company Beta less than 1 is more acceptable.
In the flowing table the Beta values or the risk coefficient of the systematic risk of the
General Electric Company has been presented. The company Beta of the General electric
Company has been computed based on the historical daily adjusted closing price of the shares
of the General Electric Company. The standard deviation of the daily adjusted price has been
considered as the risk coefficient of the company.
Paraphrase This Document
Need a fresh take? Get an instant paraphrase of this document with our AI Paraphraser
10CORPORATE FINANCIAL MANAGEMENT
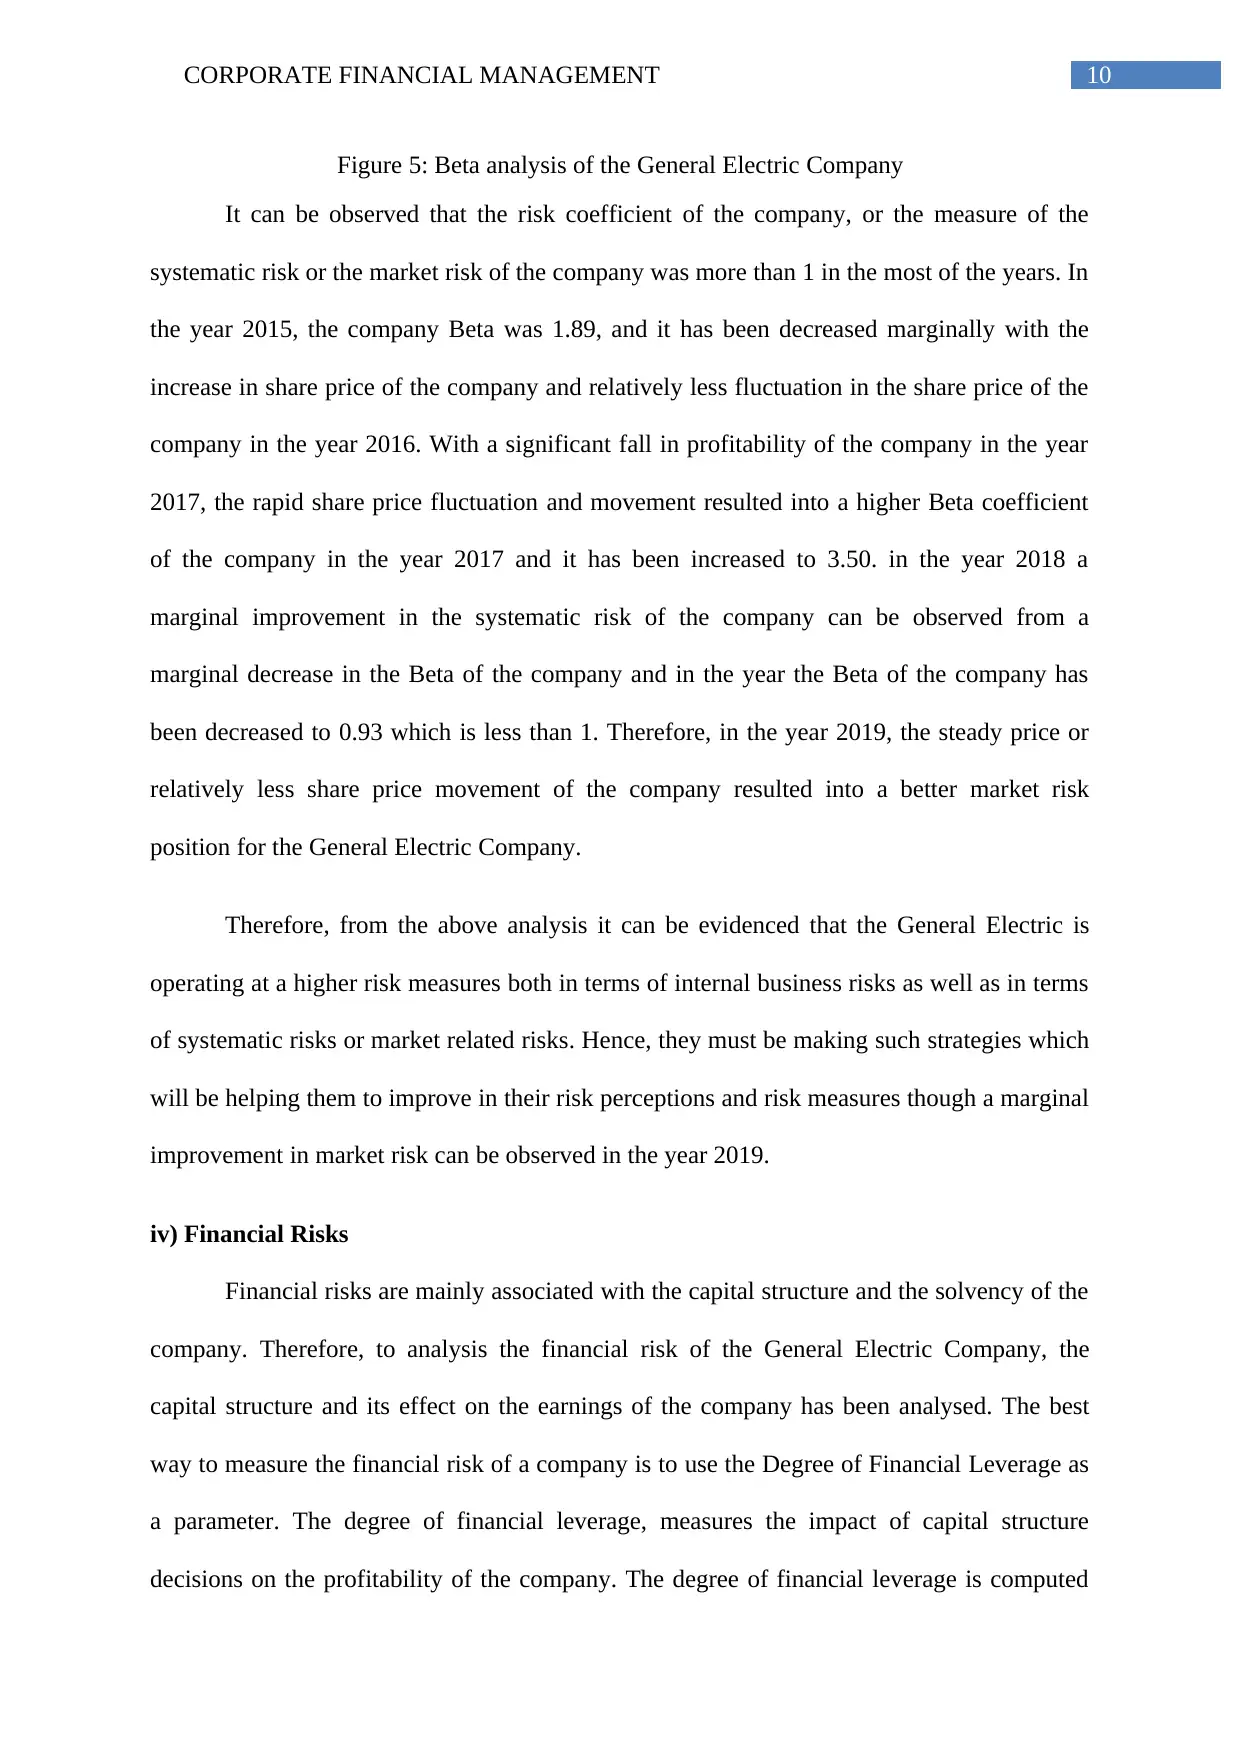
Figure 5: Beta analysis of the General Electric Company
It can be observed that the risk coefficient of the company, or the measure of the
systematic risk or the market risk of the company was more than 1 in the most of the years. In
the year 2015, the company Beta was 1.89, and it has been decreased marginally with the
increase in share price of the company and relatively less fluctuation in the share price of the
company in the year 2016. With a significant fall in profitability of the company in the year
2017, the rapid share price fluctuation and movement resulted into a higher Beta coefficient
of the company in the year 2017 and it has been increased to 3.50. in the year 2018 a
marginal improvement in the systematic risk of the company can be observed from a
marginal decrease in the Beta of the company and in the year the Beta of the company has
been decreased to 0.93 which is less than 1. Therefore, in the year 2019, the steady price or
relatively less share price movement of the company resulted into a better market risk
position for the General Electric Company.
Therefore, from the above analysis it can be evidenced that the General Electric is
operating at a higher risk measures both in terms of internal business risks as well as in terms
of systematic risks or market related risks. Hence, they must be making such strategies which
will be helping them to improve in their risk perceptions and risk measures though a marginal
improvement in market risk can be observed in the year 2019.
iv) Financial Risks
Financial risks are mainly associated with the capital structure and the solvency of the
company. Therefore, to analysis the financial risk of the General Electric Company, the
capital structure and its effect on the earnings of the company has been analysed. The best
way to measure the financial risk of a company is to use the Degree of Financial Leverage as
a parameter. The degree of financial leverage, measures the impact of capital structure
decisions on the profitability of the company. The degree of financial leverage is computed
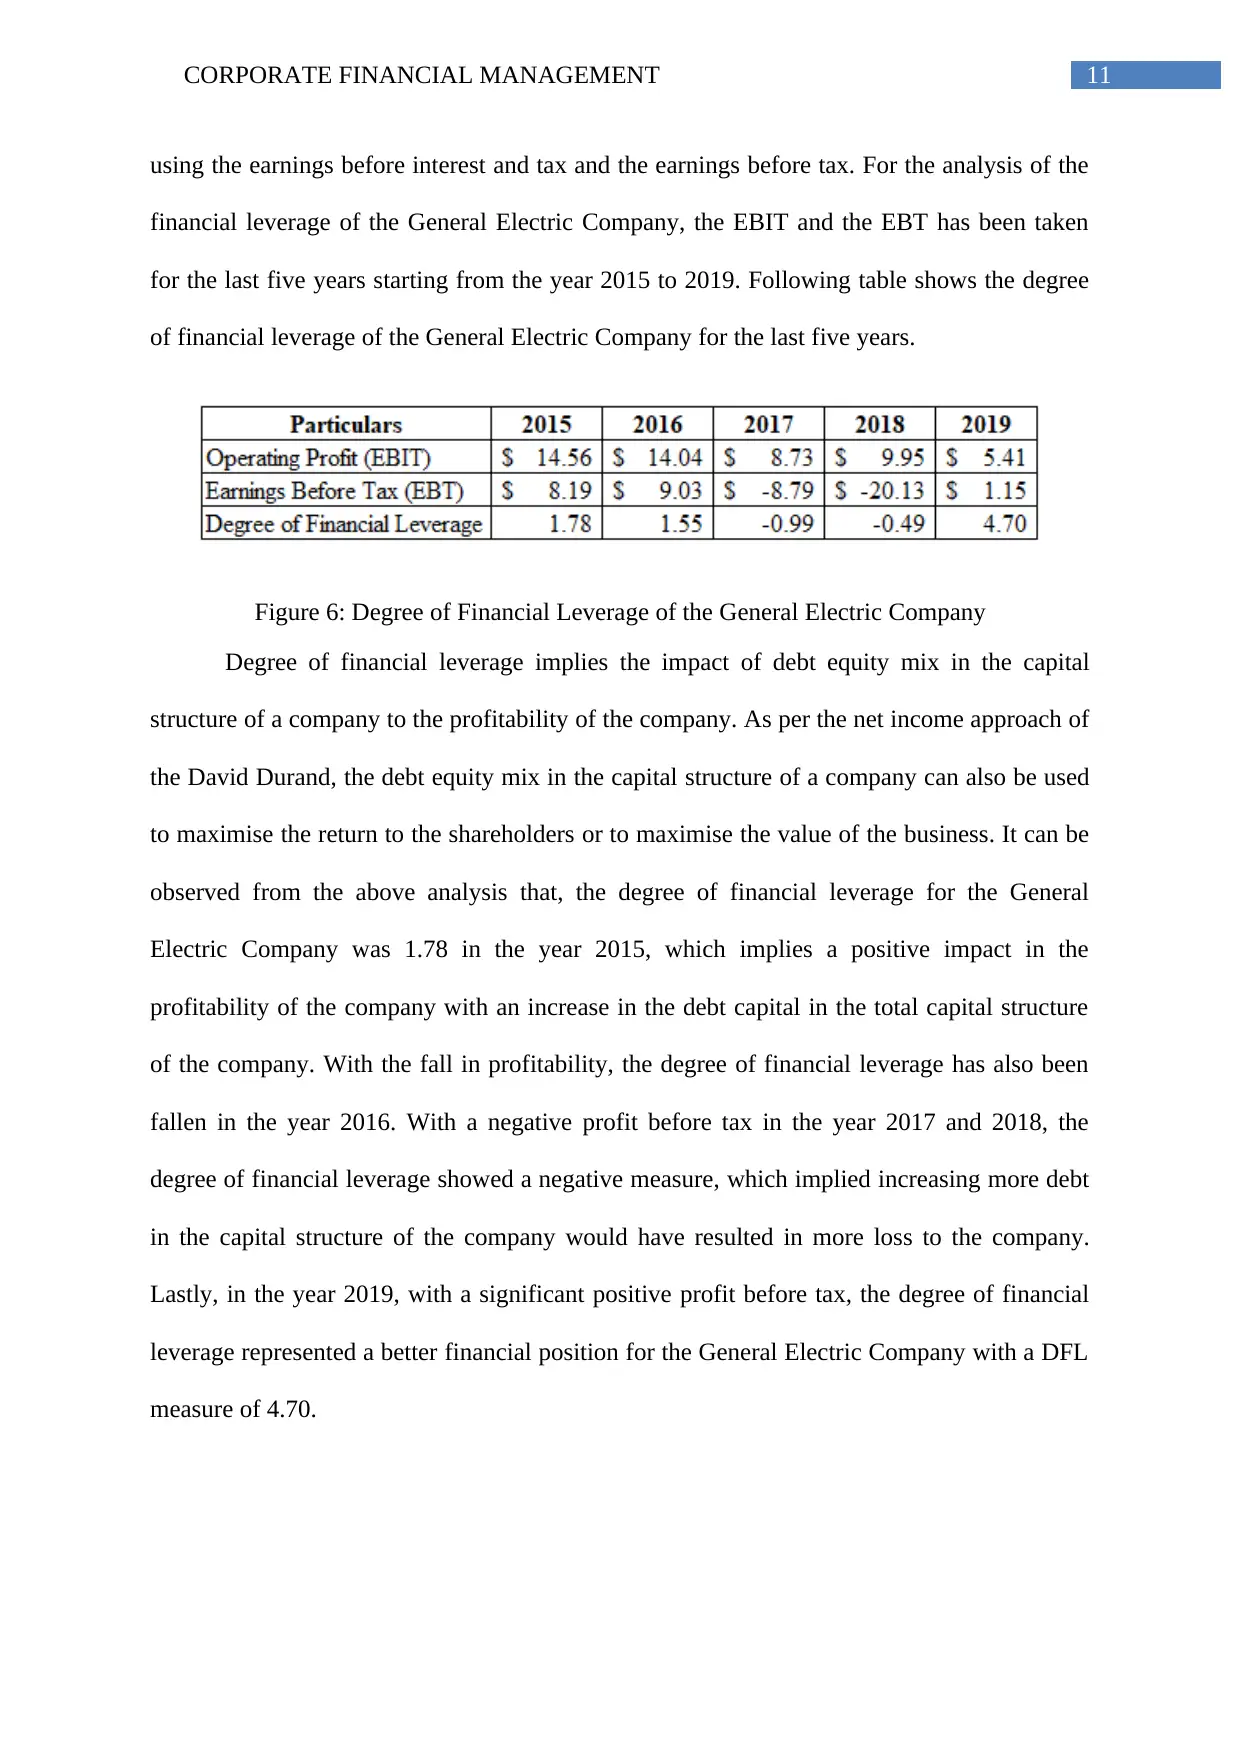
11CORPORATE FINANCIAL MANAGEMENT
using the earnings before interest and tax and the earnings before tax. For the analysis of the
financial leverage of the General Electric Company, the EBIT and the EBT has been taken
for the last five years starting from the year 2015 to 2019. Following table shows the degree
of financial leverage of the General Electric Company for the last five years.
Figure 6: Degree of Financial Leverage of the General Electric Company
Degree of financial leverage implies the impact of debt equity mix in the capital
structure of a company to the profitability of the company. As per the net income approach of
the David Durand, the debt equity mix in the capital structure of a company can also be used
to maximise the return to the shareholders or to maximise the value of the business. It can be
observed from the above analysis that, the degree of financial leverage for the General
Electric Company was 1.78 in the year 2015, which implies a positive impact in the
profitability of the company with an increase in the debt capital in the total capital structure
of the company. With the fall in profitability, the degree of financial leverage has also been
fallen in the year 2016. With a negative profit before tax in the year 2017 and 2018, the
degree of financial leverage showed a negative measure, which implied increasing more debt
in the capital structure of the company would have resulted in more loss to the company.
Lastly, in the year 2019, with a significant positive profit before tax, the degree of financial
leverage represented a better financial position for the General Electric Company with a DFL
measure of 4.70.
⊘ This is a preview!⊘
Do you want full access?
Subscribe today to unlock all pages.
Trusted by 1+ million students worldwide
1 out of 24
Related Documents


Your All-in-One AI-Powered Toolkit for Academic Success.
+13062052269
info@desklib.com
Available 24*7 on WhatsApp / Email
![[object Object]](/_next/static/media/star-bottom.7253800d.svg)
Unlock your academic potential
Copyright © 2020–2026 A2Z Services. All Rights Reserved. Developed and managed by ZUCOL.