Comprehensive Financial Analysis Report: Medical Australia Limited
VerifiedAdded on 2020/03/16
|13
|3090
|30
Report
AI Summary
This report provides a comprehensive financial analysis of Medical Australia Limited, focusing on debt valuation, share valuation, cost of capital, and market analysis. The analysis includes an examination of short-term and long-term debts, the company's debt structure, and the proportion of short-term to long-term debts. Share valuation is assessed using the Earnings Price Ratio approach, considering revenue, earnings, and EPS trends. The report calculates the Weighted Average Cost of Capital (WACC) and explores the optimal capital structure for the company. A market analysis is also conducted, evaluating the company's financial performance and market risk, including its beta value. The report concludes that the company has a low beta, making it a good bet during downturns.
ACCOUNTING
Paraphrase This Document
Need a fresh take? Get an instant paraphrase of this document with our AI Paraphraser
Medical Australia Limited
Executive summary
An analysis of the company can be done with the aid of various factors such as ratio analysis,
debt valuation, share valuation, cost of capital, market analysis, etc. In this report, the major
emphasis is on the financial strategy of the company. The selected company for the report is
Medical Australia Limited. The report sheds light on the various components of debt, ratio,
market evaluation and the financial management of the company is revealed in an appropriate
manner. The overall analysis indicates that the company has low beta and hence, is a good bet
when it comes to downturn.
2
Medical Australia Limited
Contents
I. Debt Valuation.....................................................................................................................................4
i. Short-term and long-term debts..........................................................................................................4
ii. Debt structure.....................................................................................................................................4
iii. Proportion of short-term to long-term debts......................................................................................4
II. Share Valuation...................................................................................................................................5
i. Calculation of Cost of Equity:.............................................................................................................5
ii. Revenue, earning, EPS........................................................................................................................5
iii. P/E Approach...................................................................................................................................6
iv. Most reasonable...............................................................................................................................7
v. Valuation of the company stocks.........................................................................................................7
III. Cost of Capital.................................................................................................................................8
i. Calculation of WACC.........................................................................................................................8
ii. Company’s tax rate..............................................................................................................................8
iii. Difference in the cost of debt and the cost of equity........................................................................8
iv. Pros and cons of including current liabilities in the cost of capital calculation................................8
v. Major value of the WACC calculation................................................................................................9
vii. Capital structure...............................................................................................................................9
viii. Optimal capital structure..................................................................................................................9
IV. Market Analysis.............................................................................................................................10
i. Financial performance.......................................................................................................................10
ii. Overview of the company..................................................................................................................11
iii. Other discussion............................................................................................................................11
Reference:.................................................................................................................................................12
Appendix...................................................................................................................................................13
3
⊘ This is a preview!⊘
Do you want full access?
Subscribe today to unlock all pages.
Trusted by 1+ million students worldwide
Medical Australia Limited
I. Debt Valuation
i. Short-term and long-term debts
The long-term debts are those that are due for a period exceeding 12 months. In the case
of Medical Australia Limited, the long-term debt comprises of trade creditors and
payables. The non-current liabilities are the obligations and for the company, it is the
long-term debt as they are not due in the present course of time.
a. On the other hand, the short-term debt comprises of the debts that are due in a
short course of time that is within a span of 12 months. The current liabilities of
the company such as trade creditors, income in advance, payroll liabilities,
accruals, etc are the short-term debts.
ii. Debt structure
The debt structure of the company can be commented with the help of debt-equity ratio.
As per standard industrial norms, the debt-equity ratio should not exceed 1. This means
that a higher reliance on the debt will affect the performance of the company as more
interest payment will be required.
b. As per the computation of the ratio, it can be seen that the debt-equity of the
company stands below 0.50 that means it is in synchronization with the industrial
standards as the company does not contain a major reliance on debt.
iii. Proportion of short-term to long-term debts
When it comes to the short-term debts it can be said that the company has utilized more
of short-term debts. This implies the company operates with a motto of better operation
in the short-term. Such debts are due for payment in a span of 12 months and hence, the
company does not have the obligation of the longer term. On the contrary, the long-term
debt comprises of the trade payable and provisions that decreased in comparison to the
4
Paraphrase This Document
Need a fresh take? Get an instant paraphrase of this document with our AI Paraphraser
Medical Australia Limited
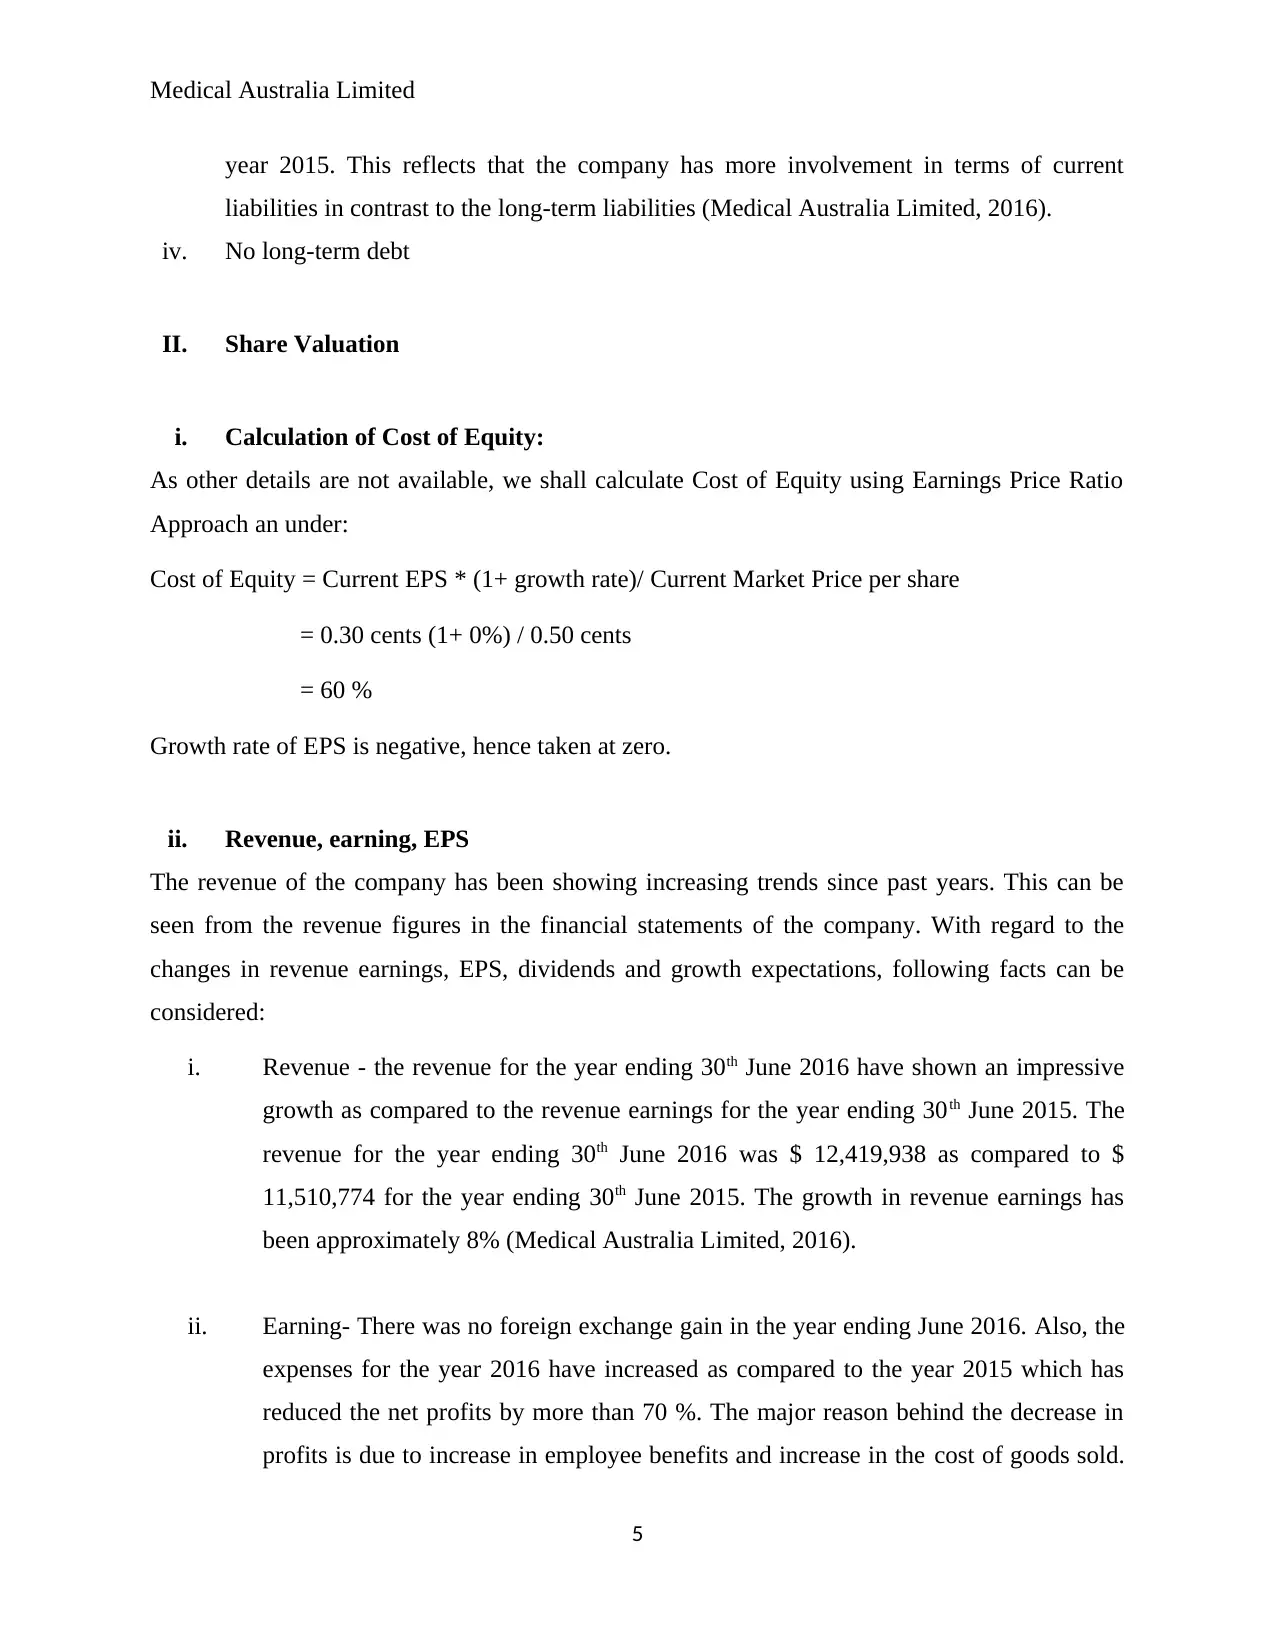
year 2015. This reflects that the company has more involvement in terms of current
liabilities in contrast to the long-term liabilities (Medical Australia Limited, 2016).
iv. No long-term debt
II. Share Valuation
i. Calculation of Cost of Equity:
As other details are not available, we shall calculate Cost of Equity using Earnings Price Ratio
Approach an under:
Cost of Equity = Current EPS * (1+ growth rate)/ Current Market Price per share
= 0.30 cents (1+ 0%) / 0.50 cents
= 60 %
Growth rate of EPS is negative, hence taken at zero.
ii. Revenue, earning, EPS
The revenue of the company has been showing increasing trends since past years. This can be
seen from the revenue figures in the financial statements of the company. With regard to the
changes in revenue earnings, EPS, dividends and growth expectations, following facts can be
considered:
i. Revenue - the revenue for the year ending 30th June 2016 have shown an impressive
growth as compared to the revenue earnings for the year ending 30th June 2015. The
revenue for the year ending 30th June 2016 was $ 12,419,938 as compared to $
11,510,774 for the year ending 30th June 2015. The growth in revenue earnings has
been approximately 8% (Medical Australia Limited, 2016).
ii. Earning- There was no foreign exchange gain in the year ending June 2016. Also, the
expenses for the year 2016 have increased as compared to the year 2015 which has
reduced the net profits by more than 70 %. The major reason behind the decrease in
profits is due to increase in employee benefits and increase in the cost of goods sold.
5
Medical Australia Limited
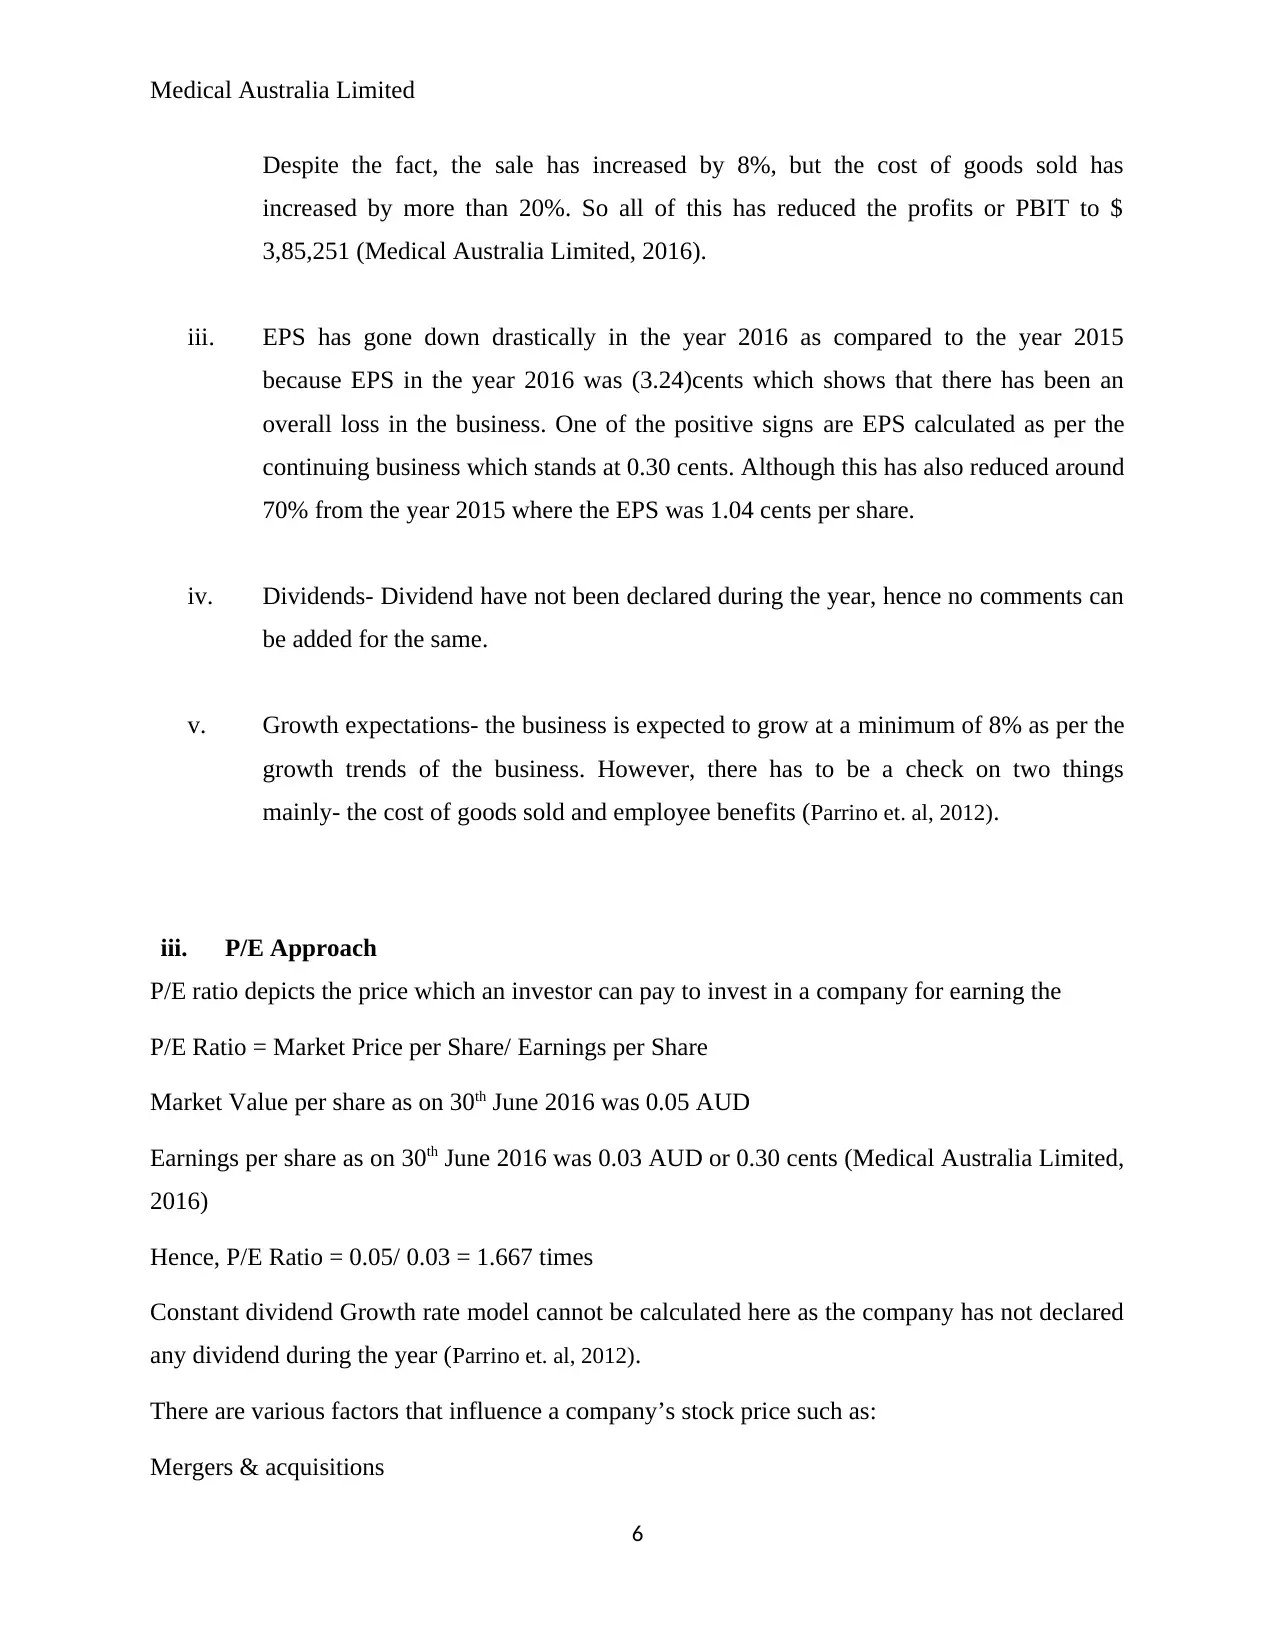
Despite the fact, the sale has increased by 8%, but the cost of goods sold has
increased by more than 20%. So all of this has reduced the profits or PBIT to $
3,85,251 (Medical Australia Limited, 2016).
iii. EPS has gone down drastically in the year 2016 as compared to the year 2015
because EPS in the year 2016 was (3.24)cents which shows that there has been an
overall loss in the business. One of the positive signs are EPS calculated as per the
continuing business which stands at 0.30 cents. Although this has also reduced around
70% from the year 2015 where the EPS was 1.04 cents per share.
iv. Dividends- Dividend have not been declared during the year, hence no comments can
be added for the same.
v. Growth expectations- the business is expected to grow at a minimum of 8% as per the
growth trends of the business. However, there has to be a check on two things
mainly- the cost of goods sold and employee benefits (Parrino et. al, 2012).
iii. P/E Approach
P/E ratio depicts the price which an investor can pay to invest in a company for earning the
P/E Ratio = Market Price per Share/ Earnings per Share
Market Value per share as on 30th June 2016 was 0.05 AUD
Earnings per share as on 30th June 2016 was 0.03 AUD or 0.30 cents (Medical Australia Limited,
2016)
Hence, P/E Ratio = 0.05/ 0.03 = 1.667 times
Constant dividend Growth rate model cannot be calculated here as the company has not declared
any dividend during the year (Parrino et. al, 2012).
There are various factors that influence a company’s stock price such as:
Mergers & acquisitions
6
⊘ This is a preview!⊘
Do you want full access?
Subscribe today to unlock all pages.
Trusted by 1+ million students worldwide
Medical Australia Limited
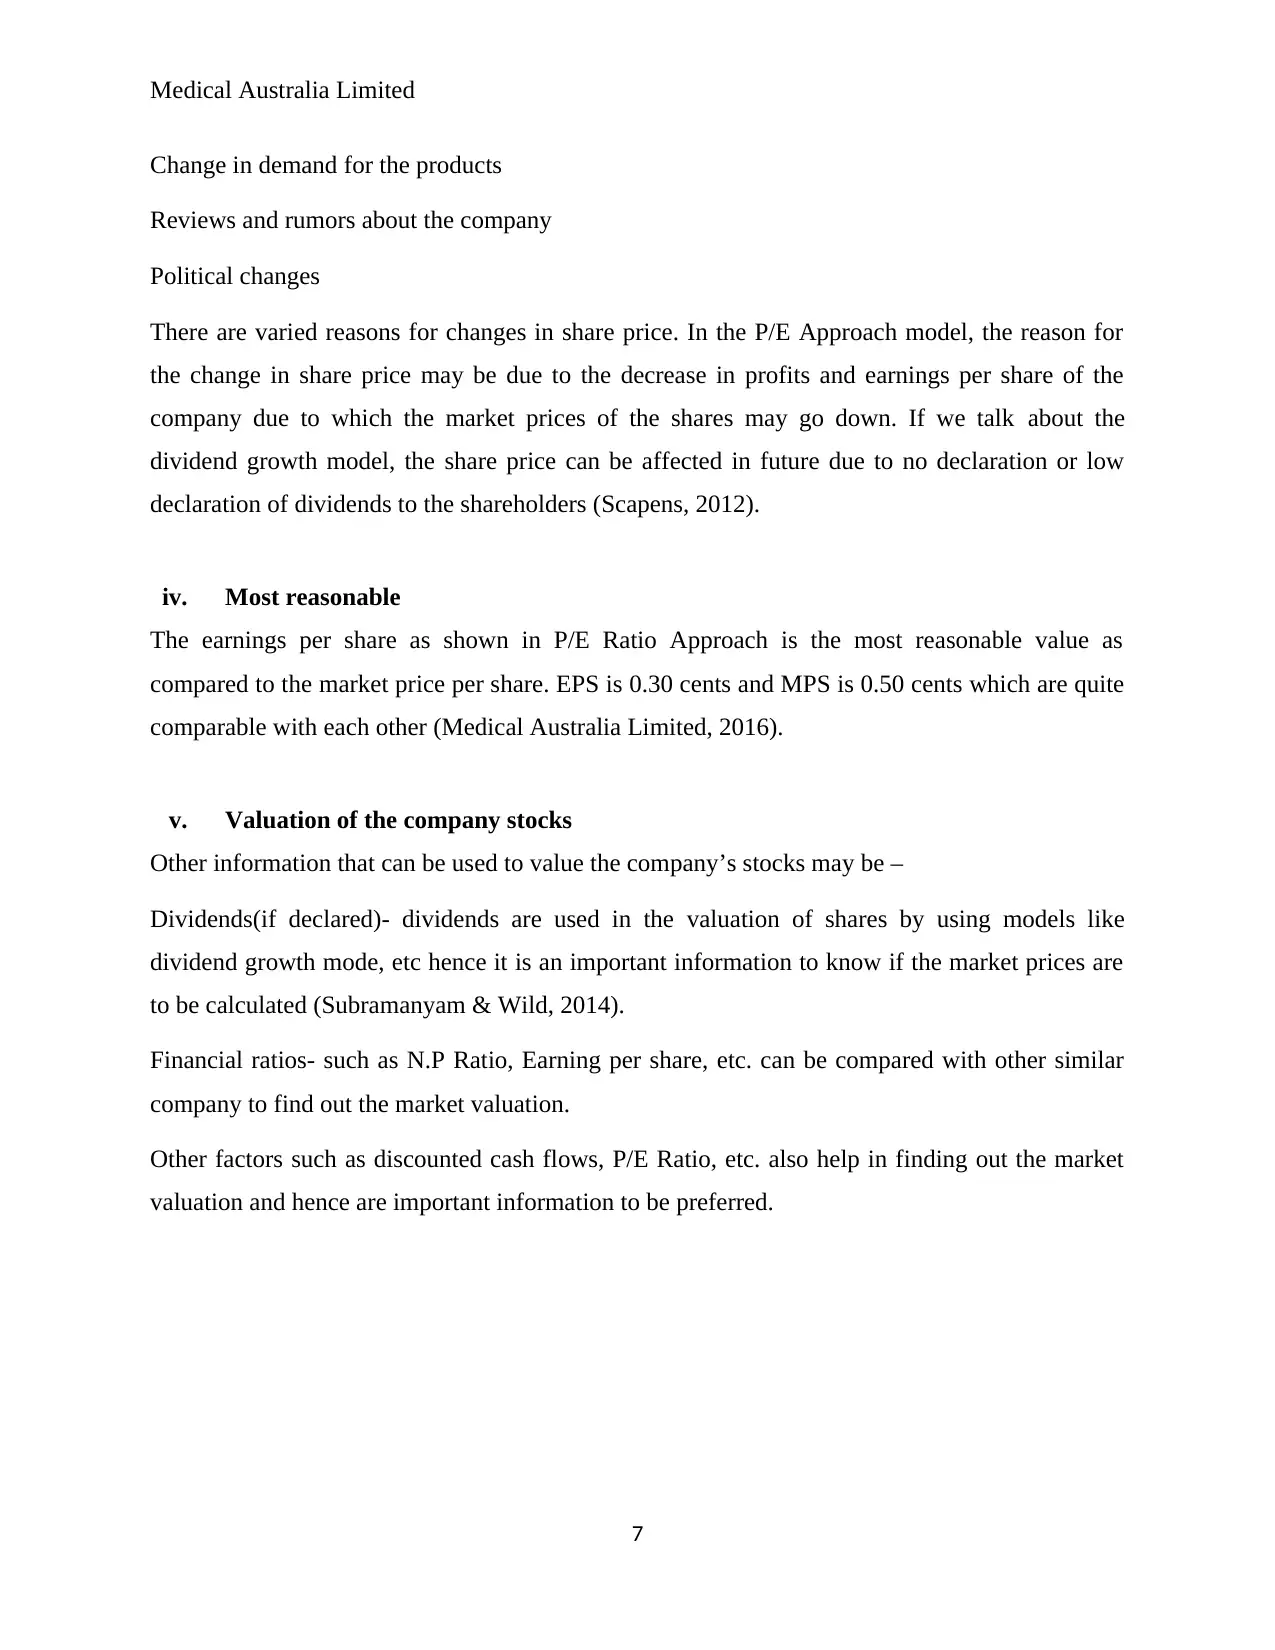
Change in demand for the products
Reviews and rumors about the company
Political changes
There are varied reasons for changes in share price. In the P/E Approach model, the reason for
the change in share price may be due to the decrease in profits and earnings per share of the
company due to which the market prices of the shares may go down. If we talk about the
dividend growth model, the share price can be affected in future due to no declaration or low
declaration of dividends to the shareholders (Scapens, 2012).
iv. Most reasonable
The earnings per share as shown in P/E Ratio Approach is the most reasonable value as
compared to the market price per share. EPS is 0.30 cents and MPS is 0.50 cents which are quite
comparable with each other (Medical Australia Limited, 2016).
v. Valuation of the company stocks
Other information that can be used to value the company’s stocks may be –
Dividends(if declared)- dividends are used in the valuation of shares by using models like
dividend growth mode, etc hence it is an important information to know if the market prices are
to be calculated (Subramanyam & Wild, 2014).
Financial ratios- such as N.P Ratio, Earning per share, etc. can be compared with other similar
company to find out the market valuation.
Other factors such as discounted cash flows, P/E Ratio, etc. also help in finding out the market
valuation and hence are important information to be preferred.
7
Paraphrase This Document
Need a fresh take? Get an instant paraphrase of this document with our AI Paraphraser
Medical Australia Limited
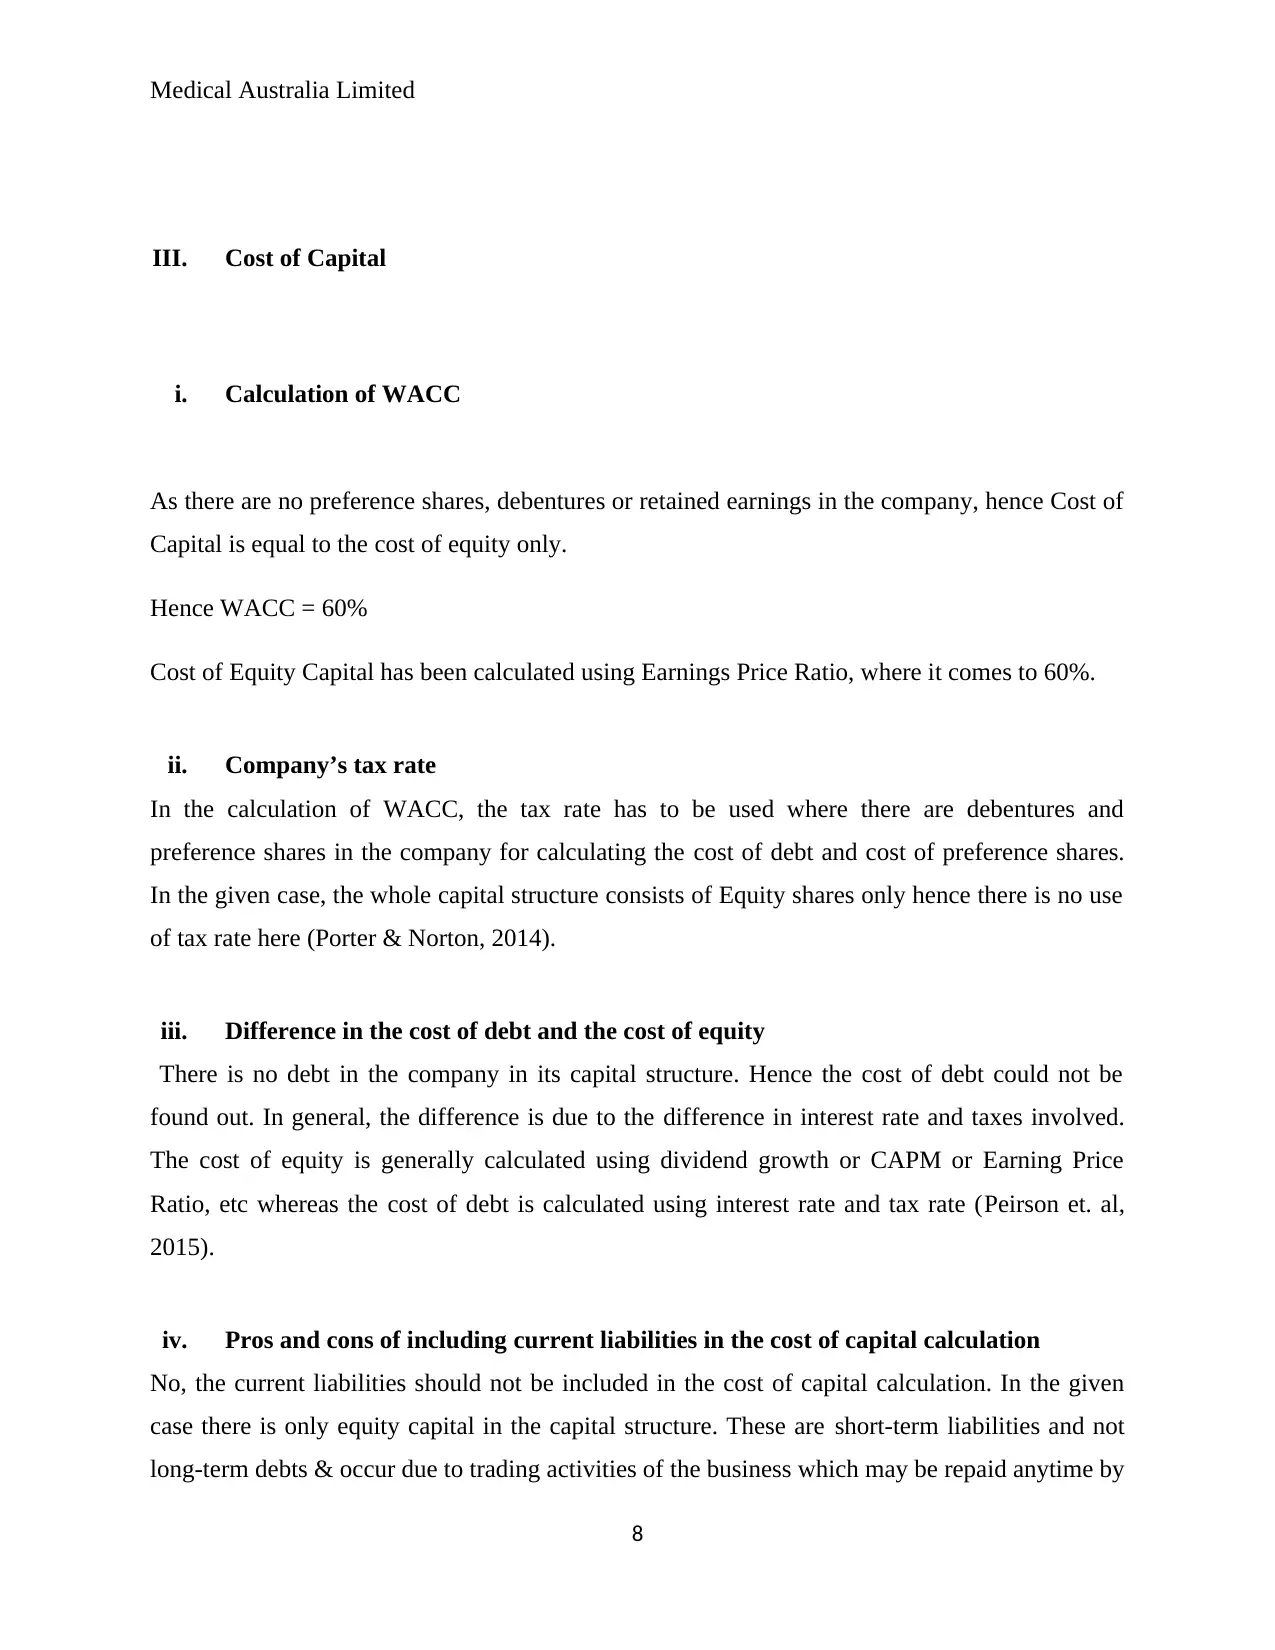
III. Cost of Capital
i. Calculation of WACC
As there are no preference shares, debentures or retained earnings in the company, hence Cost of
Capital is equal to the cost of equity only.
Hence WACC = 60%
Cost of Equity Capital has been calculated using Earnings Price Ratio, where it comes to 60%.
ii. Company’s tax rate
In the calculation of WACC, the tax rate has to be used where there are debentures and
preference shares in the company for calculating the cost of debt and cost of preference shares.
In the given case, the whole capital structure consists of Equity shares only hence there is no use
of tax rate here (Porter & Norton, 2014).
iii. Difference in the cost of debt and the cost of equity
There is no debt in the company in its capital structure. Hence the cost of debt could not be
found out. In general, the difference is due to the difference in interest rate and taxes involved.
The cost of equity is generally calculated using dividend growth or CAPM or Earning Price
Ratio, etc whereas the cost of debt is calculated using interest rate and tax rate (Peirson et. al,
2015).
iv. Pros and cons of including current liabilities in the cost of capital calculation
No, the current liabilities should not be included in the cost of capital calculation. In the given
case there is only equity capital in the capital structure. These are short-term liabilities and not
long-term debts & occur due to trading activities of the business which may be repaid anytime by
8
Medical Australia Limited
selling off the stock or repayment received by the debtors (Porter & Norton, 2014). However,
payments to equity shareholders, debenture holders or preference shareholders can only be made
by selling off a substantial business or shares which may also bring the business to an end or end
of a business segment. So current liabilities are short-term which does not affect the cost of
equity (Shah, 2013).
v. Major value of the WACC calculation
The cost of equity is the major part in the calculation of WACC. As the cost of capital is quite
high, the company needs to invest its fund keeping in mind the high cost, so that the company is
able to recover its cost of capital and other expenses which should be ideally more than the cost
of equity.
vi. Information unavailable
vii. Capital structure
The capital structure of the company consists of only equity share capital. The cost of capital of
the company is very high. So, the company should choose other options also in line with the
industry and should include debentures and preference shares also in capital structure (Peirson et.
al, 2015). Also, the company should somehow restrict its expenses so that there can be some
retained earnings for the company.
viii. Optimal capital structure
An optimal capital structure is one which has the lowest cost of capital. It can be achieved by a
balance between the debts and equity. A structure with more debts generally has a lower cost of
capital due to tax deduction available. Hence the company should opt for some debt in its
structure as well. The circumstances that can cause a change in optimal capital structure can be
demerger of the company, the redemption of the heavy amount of debentures, the market in
fluctuation, etc (Medical Australia Limited, 2016).
9
⊘ This is a preview!⊘
Do you want full access?
Subscribe today to unlock all pages.
Trusted by 1+ million students worldwide
Medical Australia Limited
IV. Market Analysis
i. Financial performance
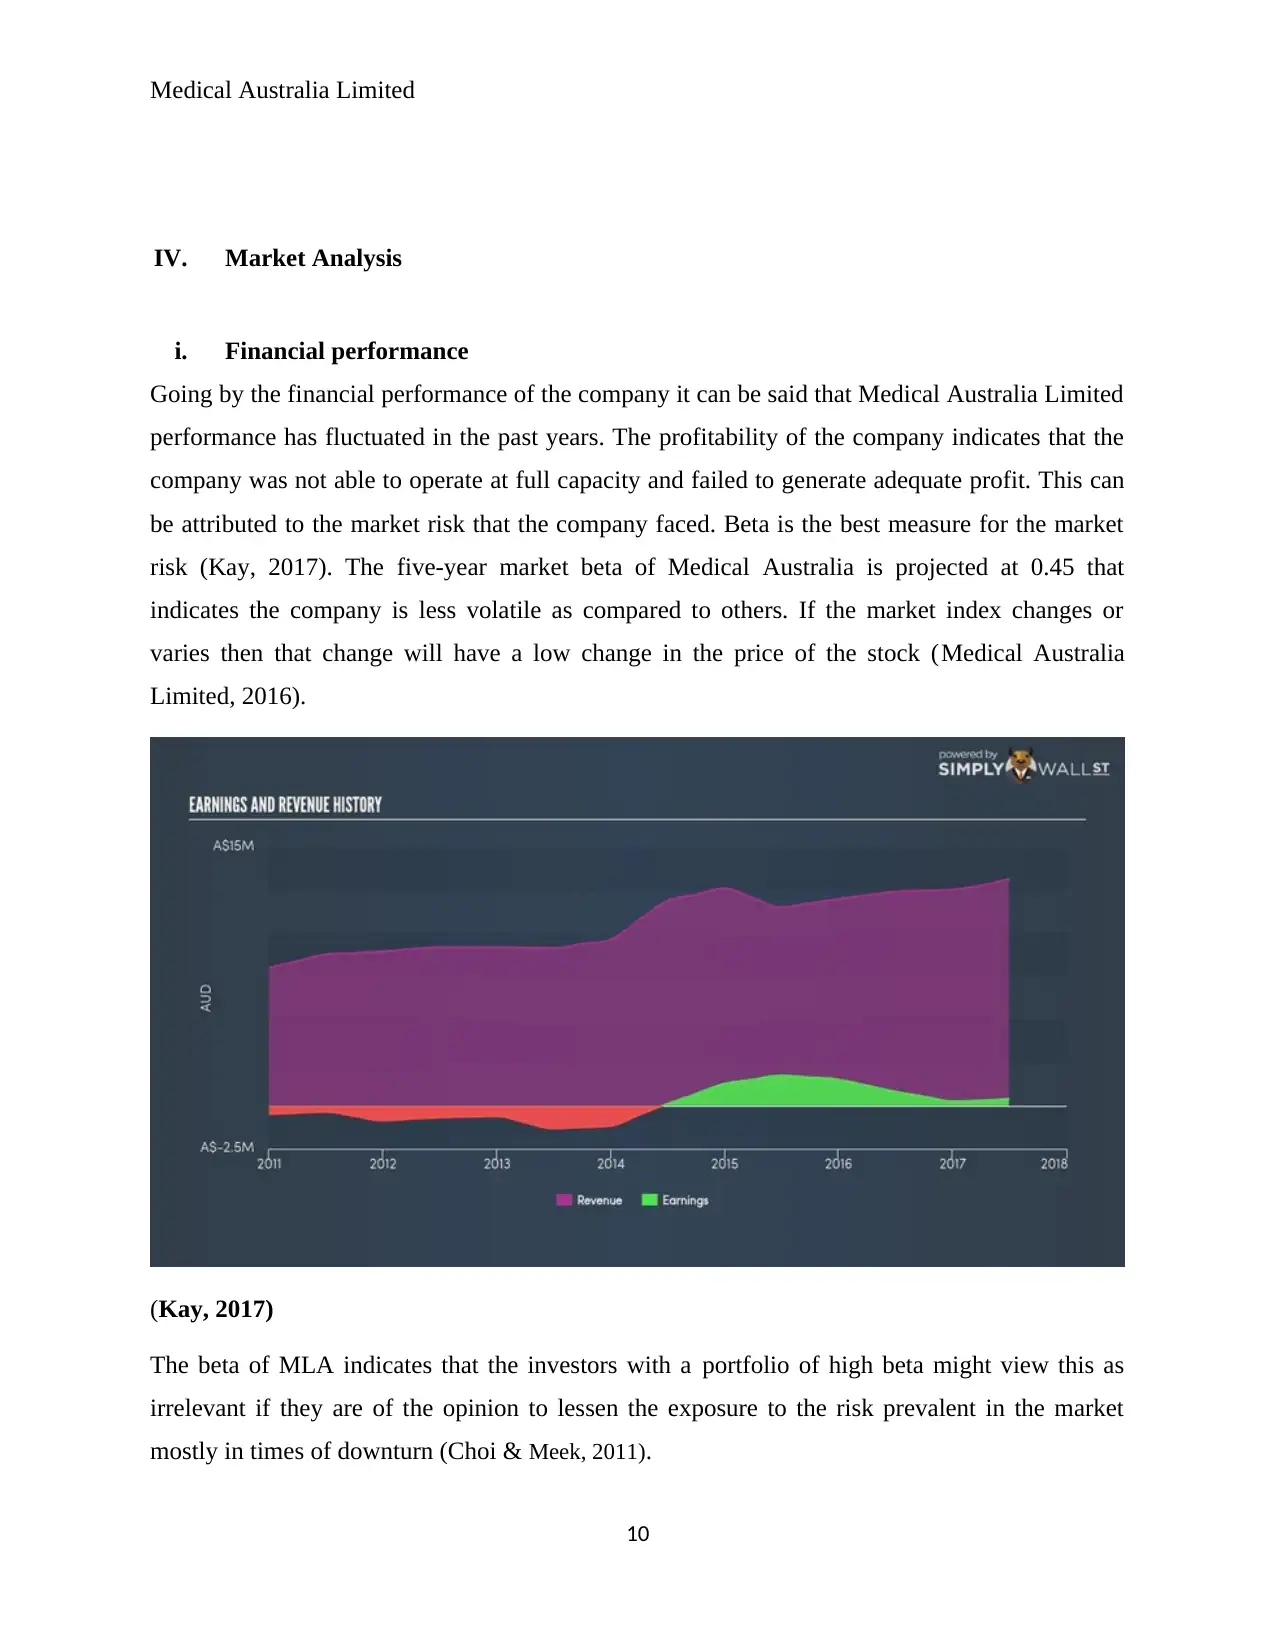
Going by the financial performance of the company it can be said that Medical Australia Limited
performance has fluctuated in the past years. The profitability of the company indicates that the
company was not able to operate at full capacity and failed to generate adequate profit. This can
be attributed to the market risk that the company faced. Beta is the best measure for the market
risk (Kay, 2017). The five-year market beta of Medical Australia is projected at 0.45 that
indicates the company is less volatile as compared to others. If the market index changes or
varies then that change will have a low change in the price of the stock (Medical Australia
Limited, 2016).
(Kay, 2017)
The beta of MLA indicates that the investors with a portfolio of high beta might view this as
irrelevant if they are of the opinion to lessen the exposure to the risk prevalent in the market
mostly in times of downturn (Choi & Meek, 2011).
10
IV. Market Analysis
i. Financial performance
Going by the financial performance of the company it can be said that Medical Australia Limited
performance has fluctuated in the past years. The profitability of the company indicates that the
company was not able to operate at full capacity and failed to generate adequate profit. This can
be attributed to the market risk that the company faced. Beta is the best measure for the market
risk (Kay, 2017). The five-year market beta of Medical Australia is projected at 0.45 that
indicates the company is less volatile as compared to others. If the market index changes or
varies then that change will have a low change in the price of the stock (Medical Australia
Limited, 2016).
(Kay, 2017)
The beta of MLA indicates that the investors with a portfolio of high beta might view this as
irrelevant if they are of the opinion to lessen the exposure to the risk prevalent in the market
mostly in times of downturn (Choi & Meek, 2011).
10
Paraphrase This Document
Need a fresh take? Get an instant paraphrase of this document with our AI Paraphraser
Medical Australia Limited
ii. Overview of the company
As per the market capitalization of the company that stands AUD $11.35M ranks MLA in the
small-cap category of stocks. Moreover, the company contains higher beta as compared to the
larger companies. The operation of the company is in the healthcare sector and tends to have low
sensitivity to the shocks of the market (Volcker, 2011). In tune to this, a high beta should be
expected for the company but overall a low beta should be present for the healthcare segment.
Therefore, it indicates that MLA should be more volatile (Brigham & Daves, 2012). During the
economic downturn, low demand will lead to re-assessment of the production. The fixed assets
of the company constitute only 22.23% of the total assets and the important fact that needs to be
noted is that the company does not have a heavy reliance on the costly assets (Medical Australia
Limited, 2016). Therefore, the volatility of the company is low and as per the experts, it is a safe
investment that is even projected by the beta of the company.
iii. Other discussion
The important fact that needs to be noted about MLA is that the company bears low fixed cost
meaning that when it comes to operating leverage, it is flexible when it is a downturn. Hence,
MLA can be tagged as a strong bet when it comes to the economic downturn as the beta is low
along with the fixed cost (Wagenhofer, 2014). Both the factors provide a strong cushion to the
company and hence, is an important element that can be taken into consideration.
11
Medical Australia Limited
Reference:
Brigham, E. & Daves, P 2012, Intermediate Financial Management , USA: Cengage Learning.
Choi, R.D. & Meek, G.K 2011, International accounting, Pearson .
Kay, L 2017, Before You Buy Medical Australia Limited’s, viewed 13 October 2017
https://simplywall.st/news/2017/10/10/before-you-buy-medical-australia-limiteds-asxmla-you-
should-consider-this/
Medical Australia Limited 2016, Medical Australia Limited 2016 annual report and accounts,
viewed 13 October 2017 http://www.medaust.com/irm/company/showpage.aspx?
CategoryId=190&CPID=1565&InstanceVersionNumber=0
Parrino, R., Kidwell, D. & Bates, T 2012, Fundamentals of corporate finance, Hoboken, NJ: Wiley
Peirson, G, Brown, R., Easton, S, Howard, P & Pinder, S 2015, Business Finance, 12th ed,
North Ryde: McGraw-Hill Australia.
Porter, G & Norton, C 2014, Financial Accounting: The Impact on Decision Maker, Texas:
Cengage Learning
Scapens, R.W 2012, Commentary: How important is practice-relevant management accounting
research? Qualitative Research in Accounting & Management, vol. 9, no.3, pp. 293 – 295.
Shah, P 2013, Financial Accounting, London: Oxford University Press
Subramanyam, K & Wild, J 2014, Financial Statement Analysis, McGraw Hill
Volcker, P 2011, Financial Reform: Unfinished Business, New York Review of Books.
Wagenhofer, A 2014, The role of revenue recognition in performance reporting, Oxford
University Press
12
⊘ This is a preview!⊘
Do you want full access?
Subscribe today to unlock all pages.
Trusted by 1+ million students worldwide
1 out of 13
Related Documents


Your All-in-One AI-Powered Toolkit for Academic Success.
+13062052269
info@desklib.com
Available 24*7 on WhatsApp / Email
![[object Object]](/_next/static/media/star-bottom.7253800d.svg)
Unlock your academic potential
Copyright © 2020–2026 A2Z Services. All Rights Reserved. Developed and managed by ZUCOL.