Accounting 12: Financial Analysis of a Pizza Franchise Project

Verified

Added on  2021/05/30

|11
|2109
|142
Homework Assignment
AI Summary
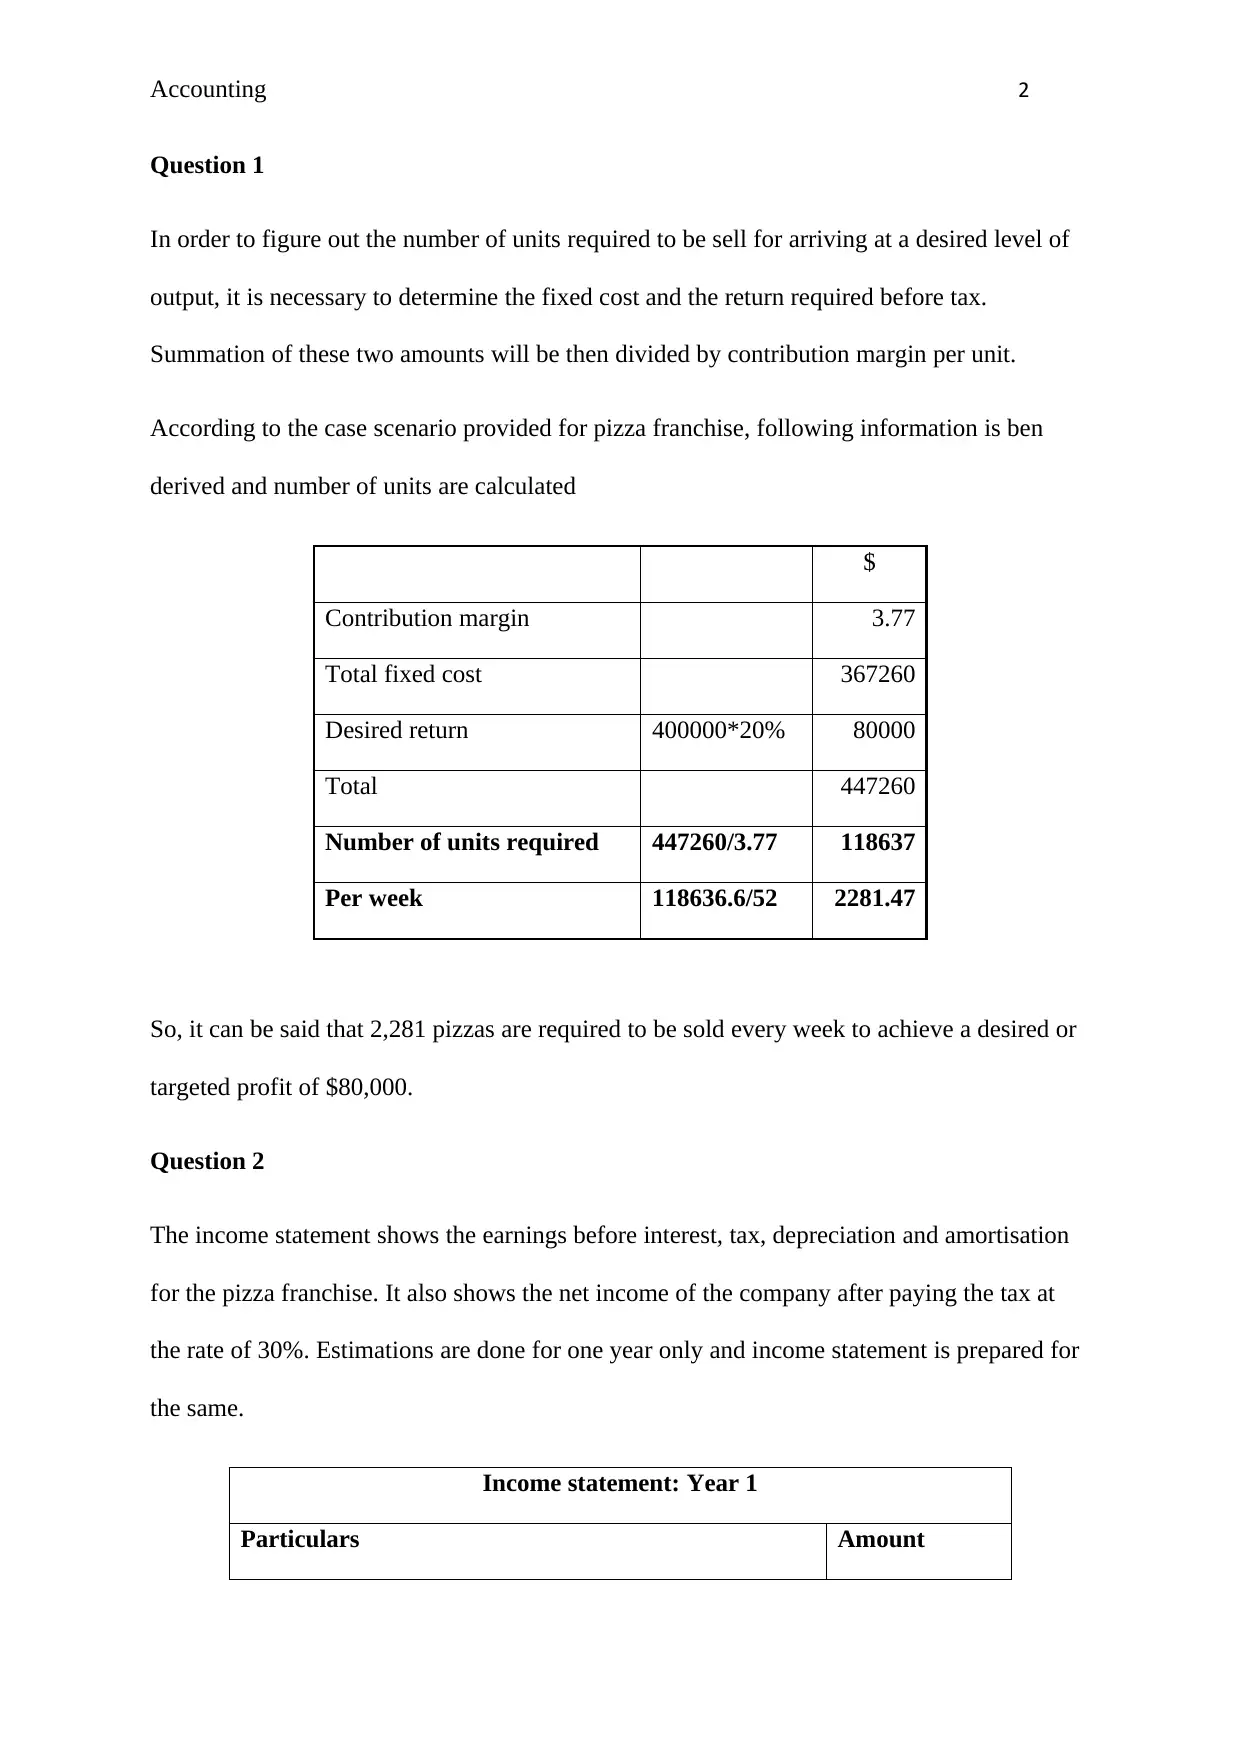
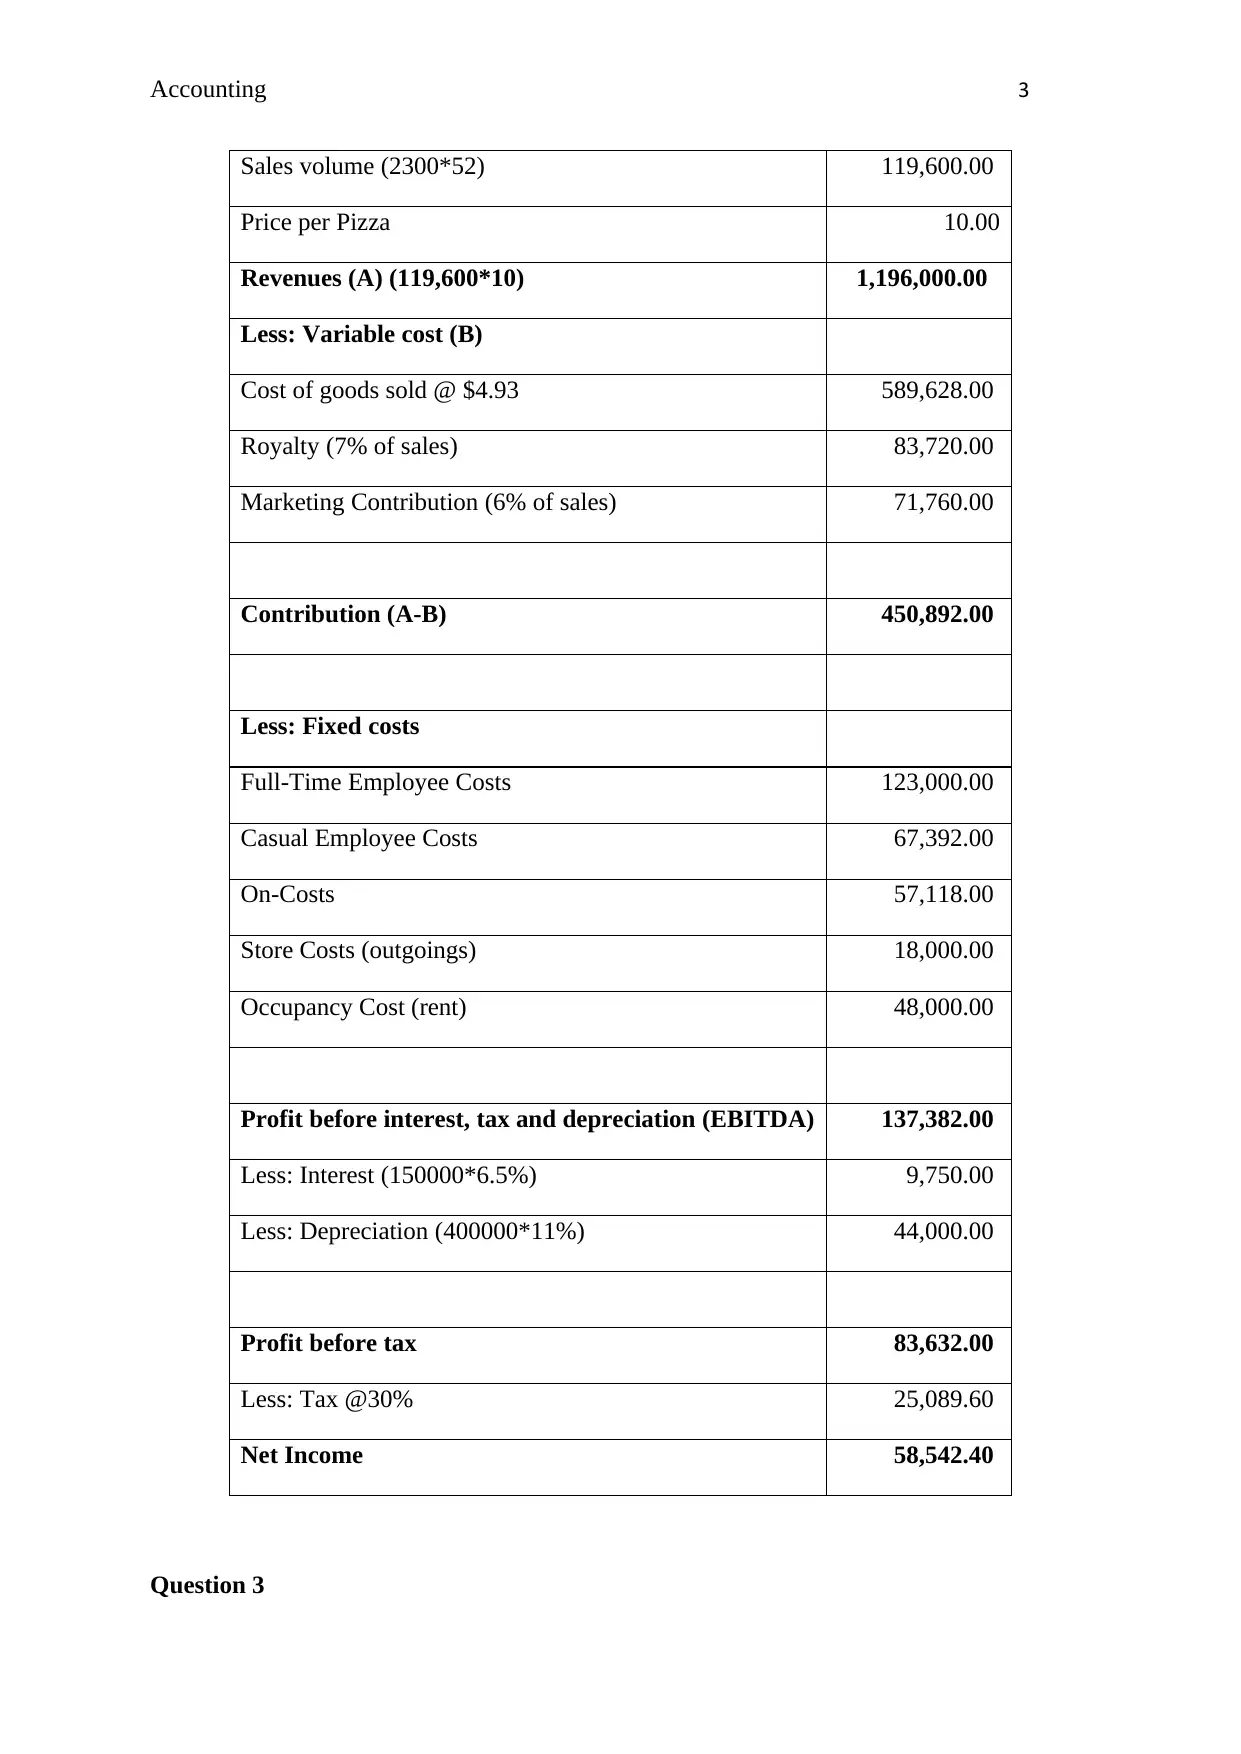
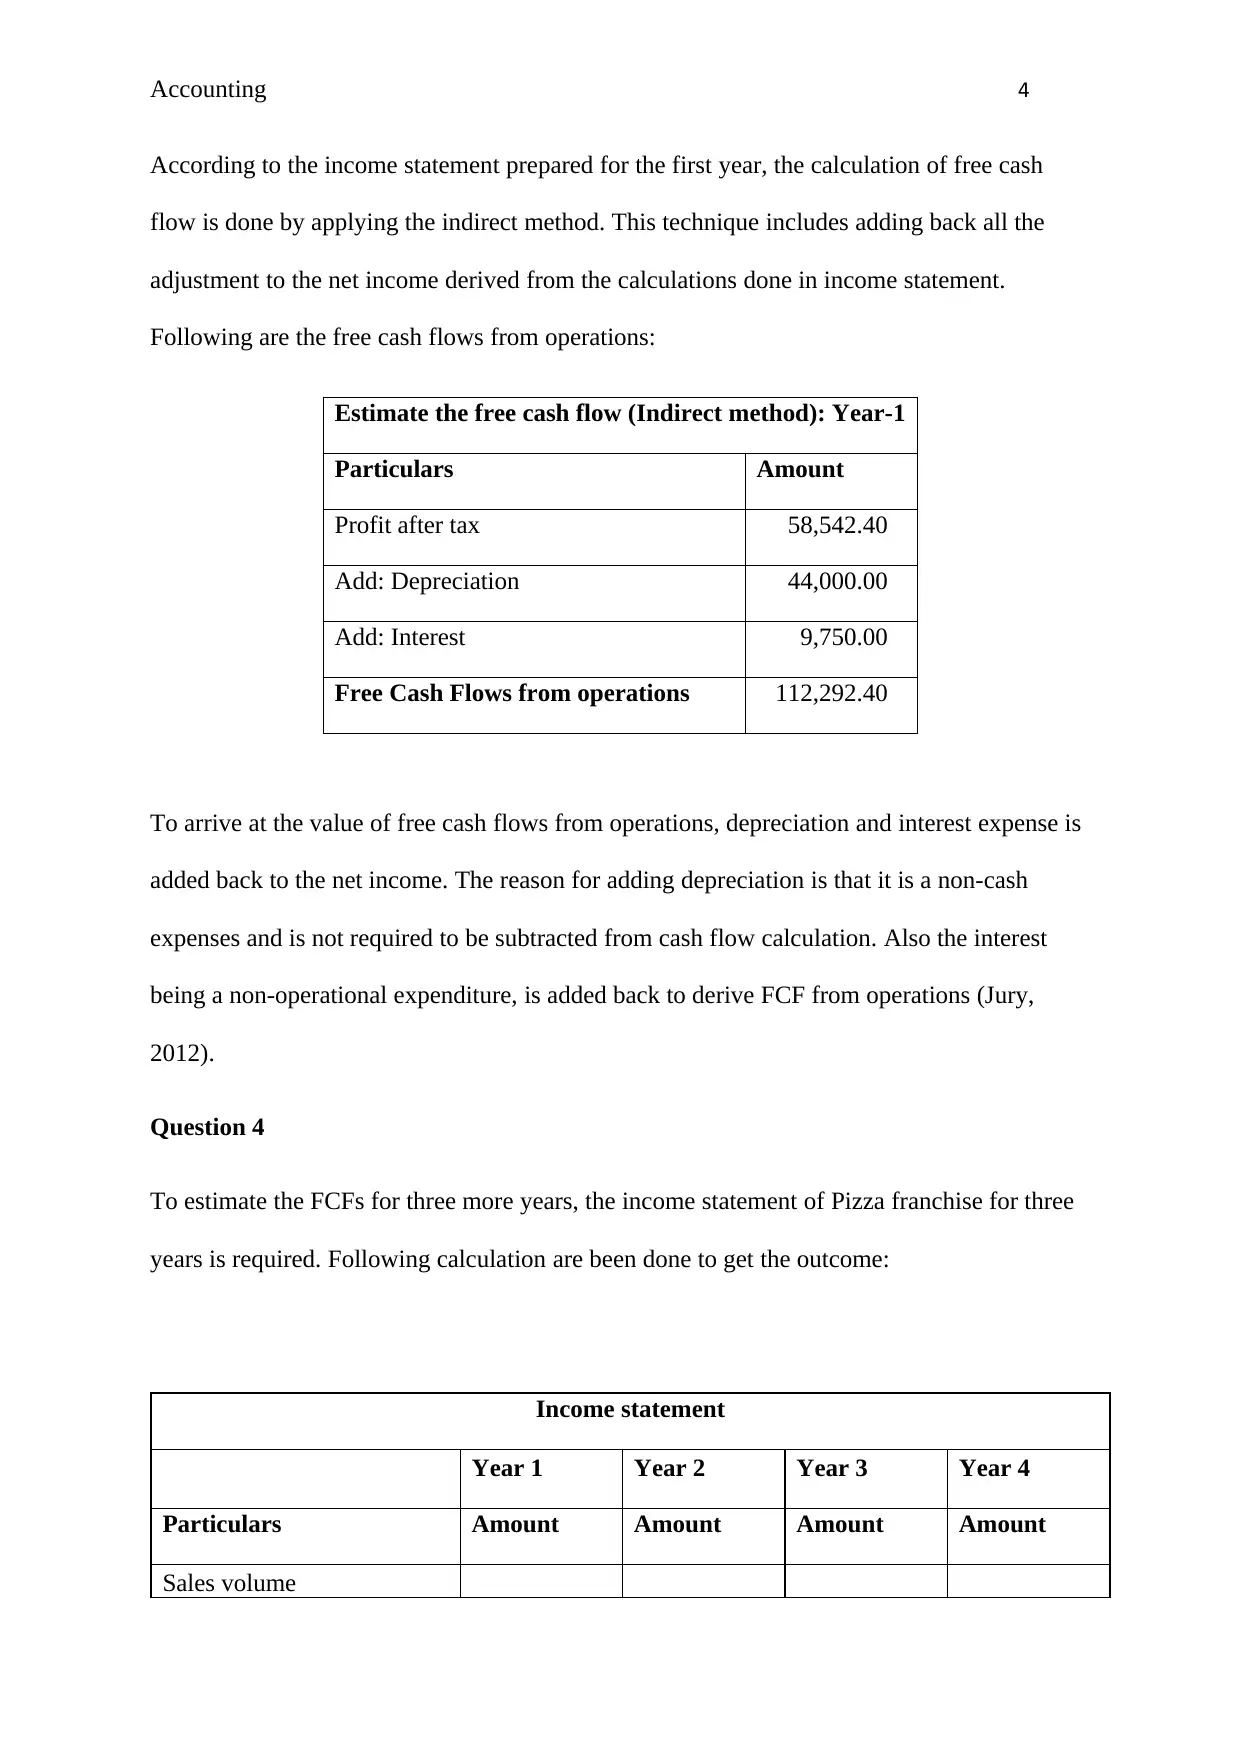
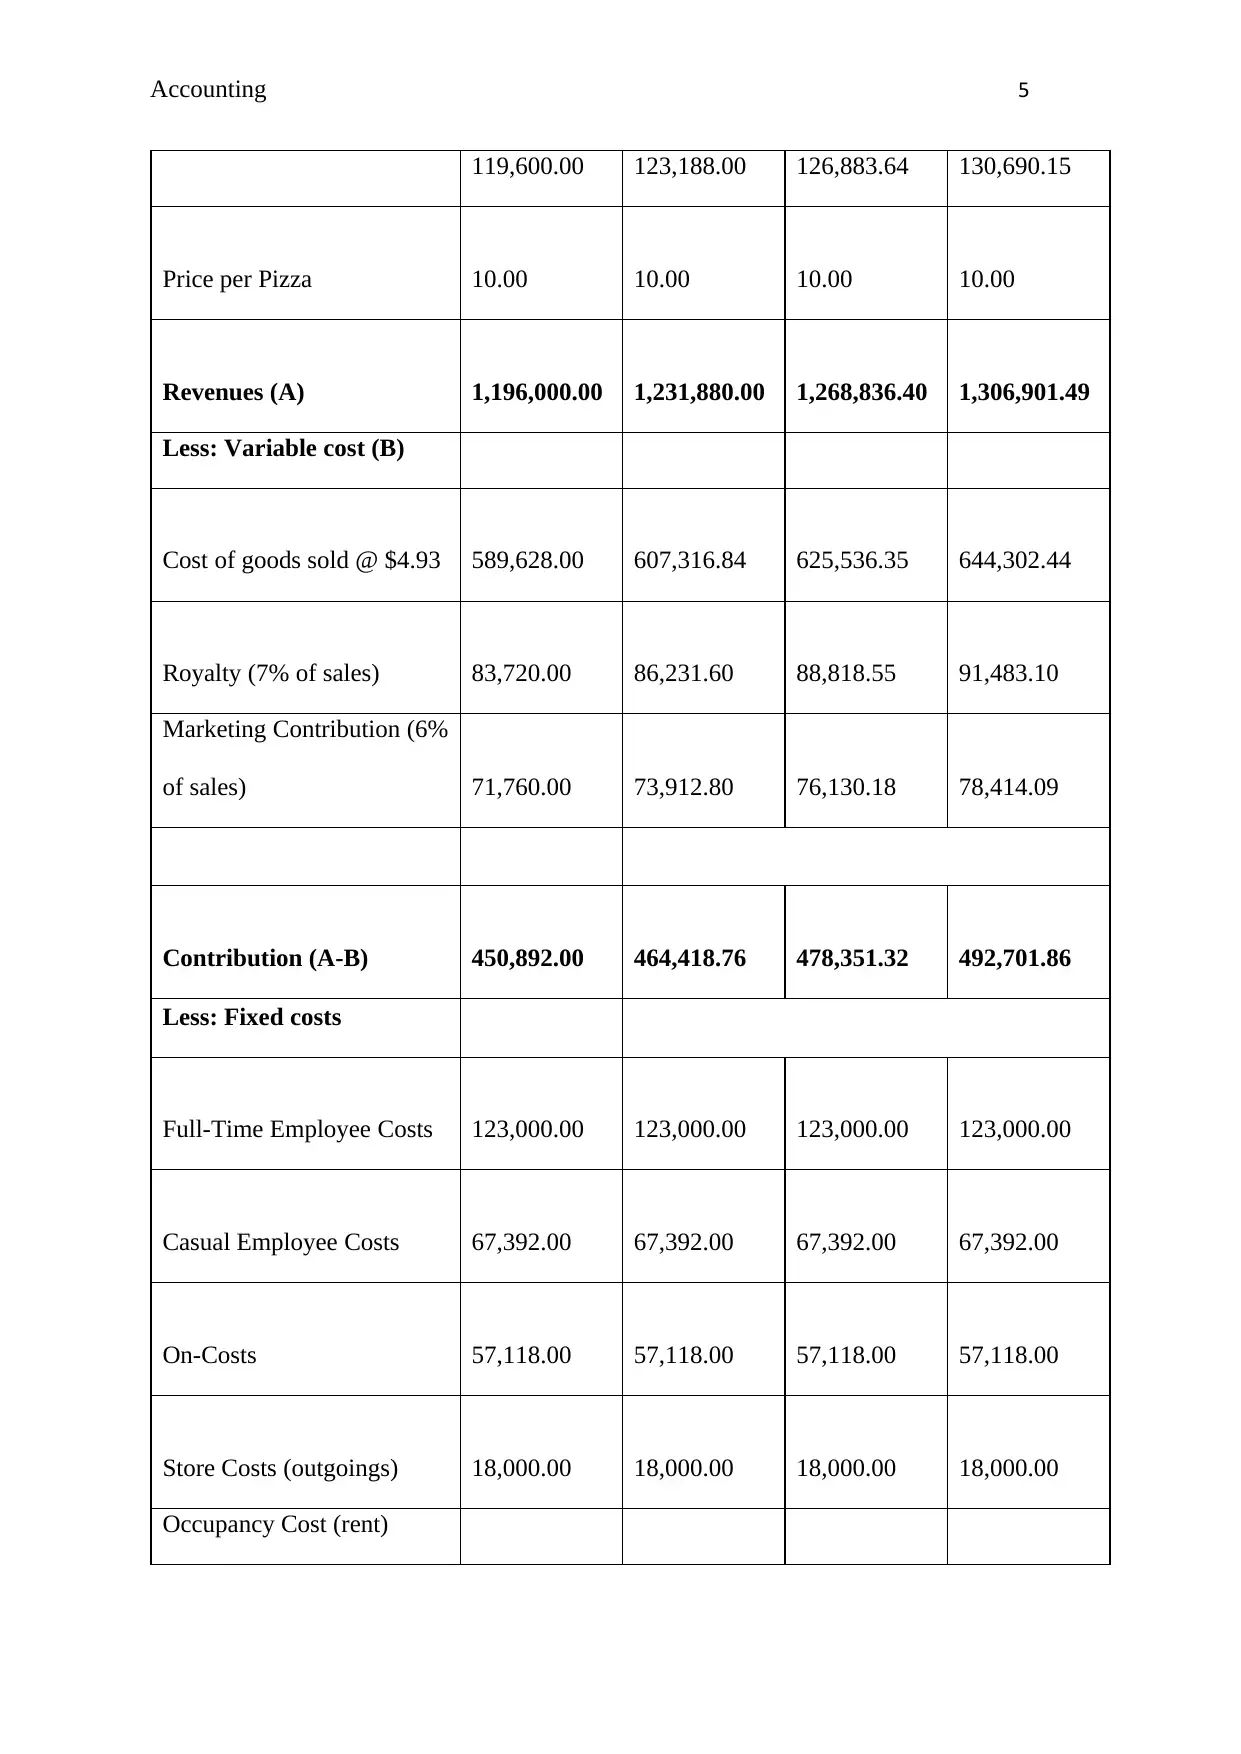
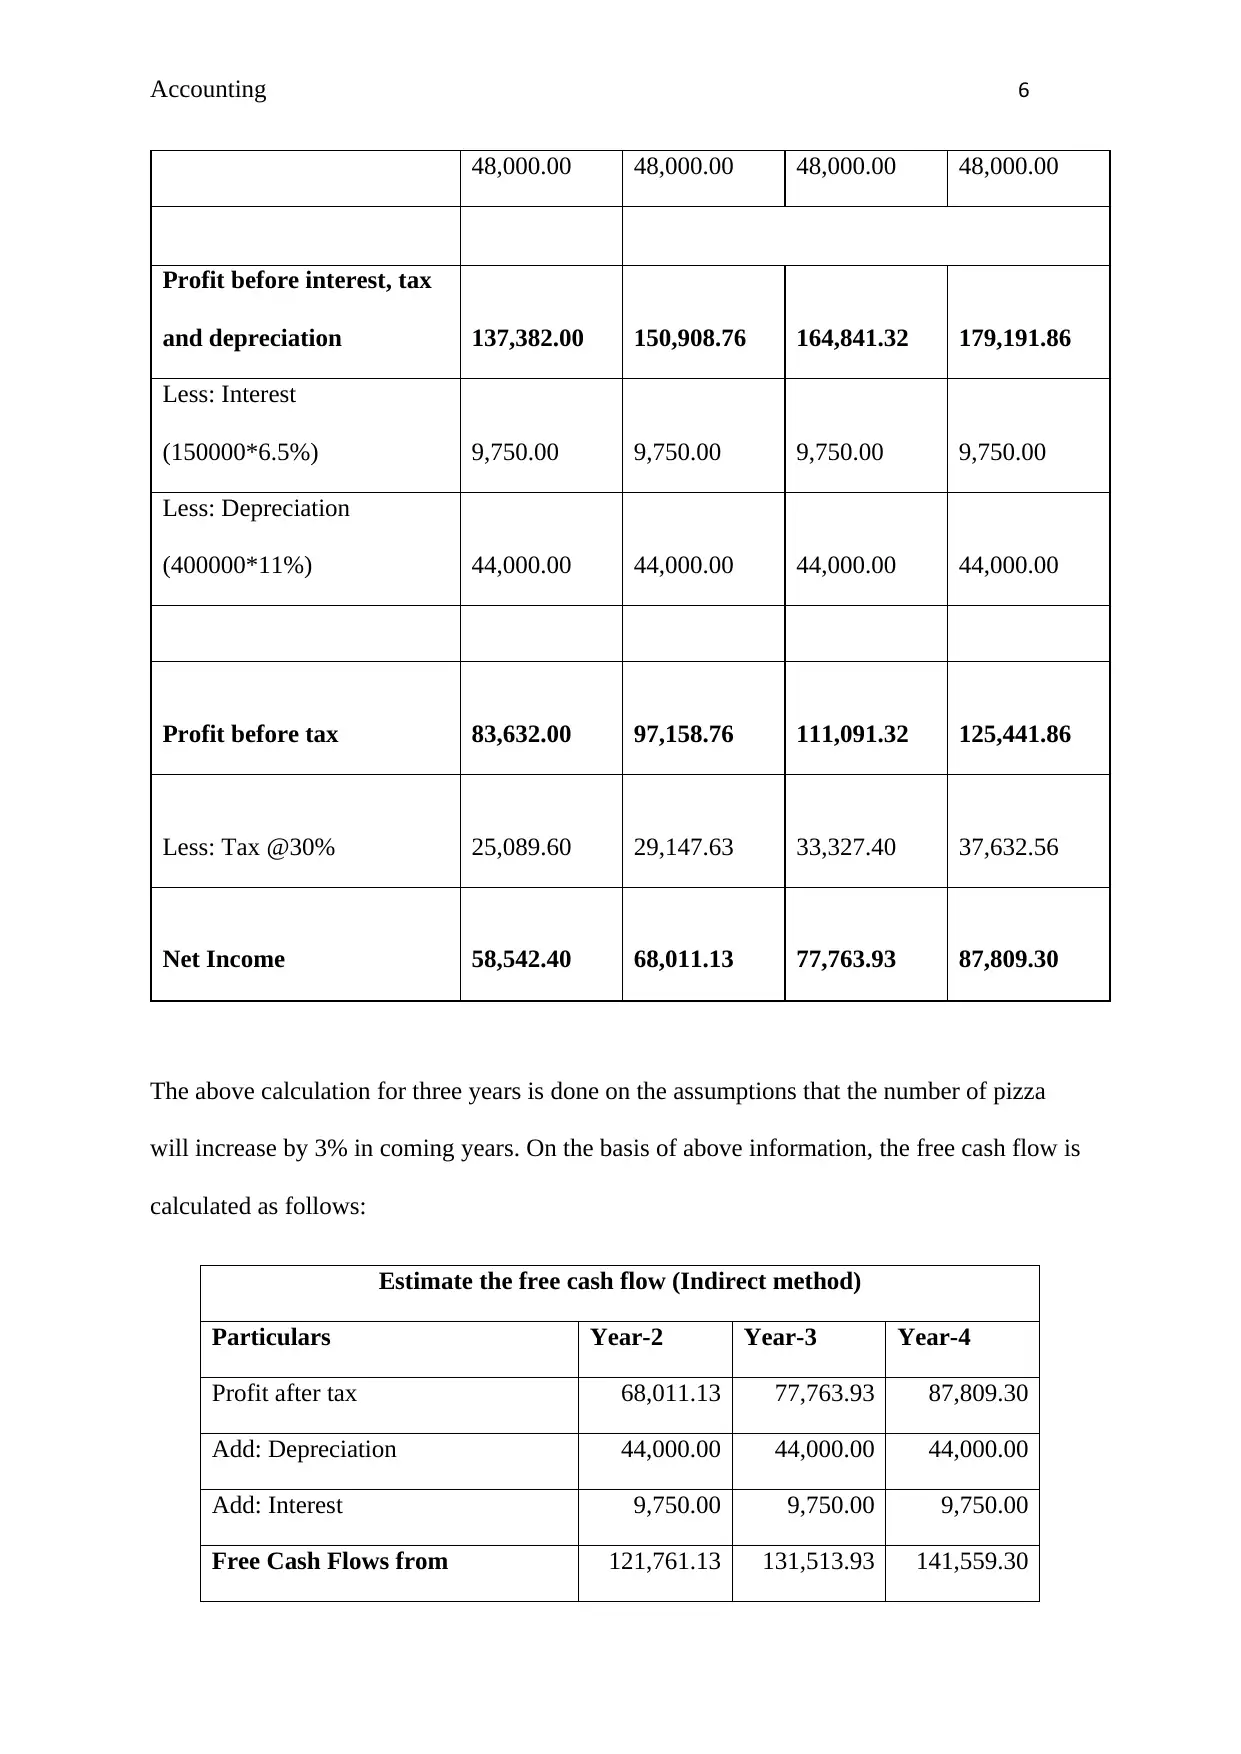
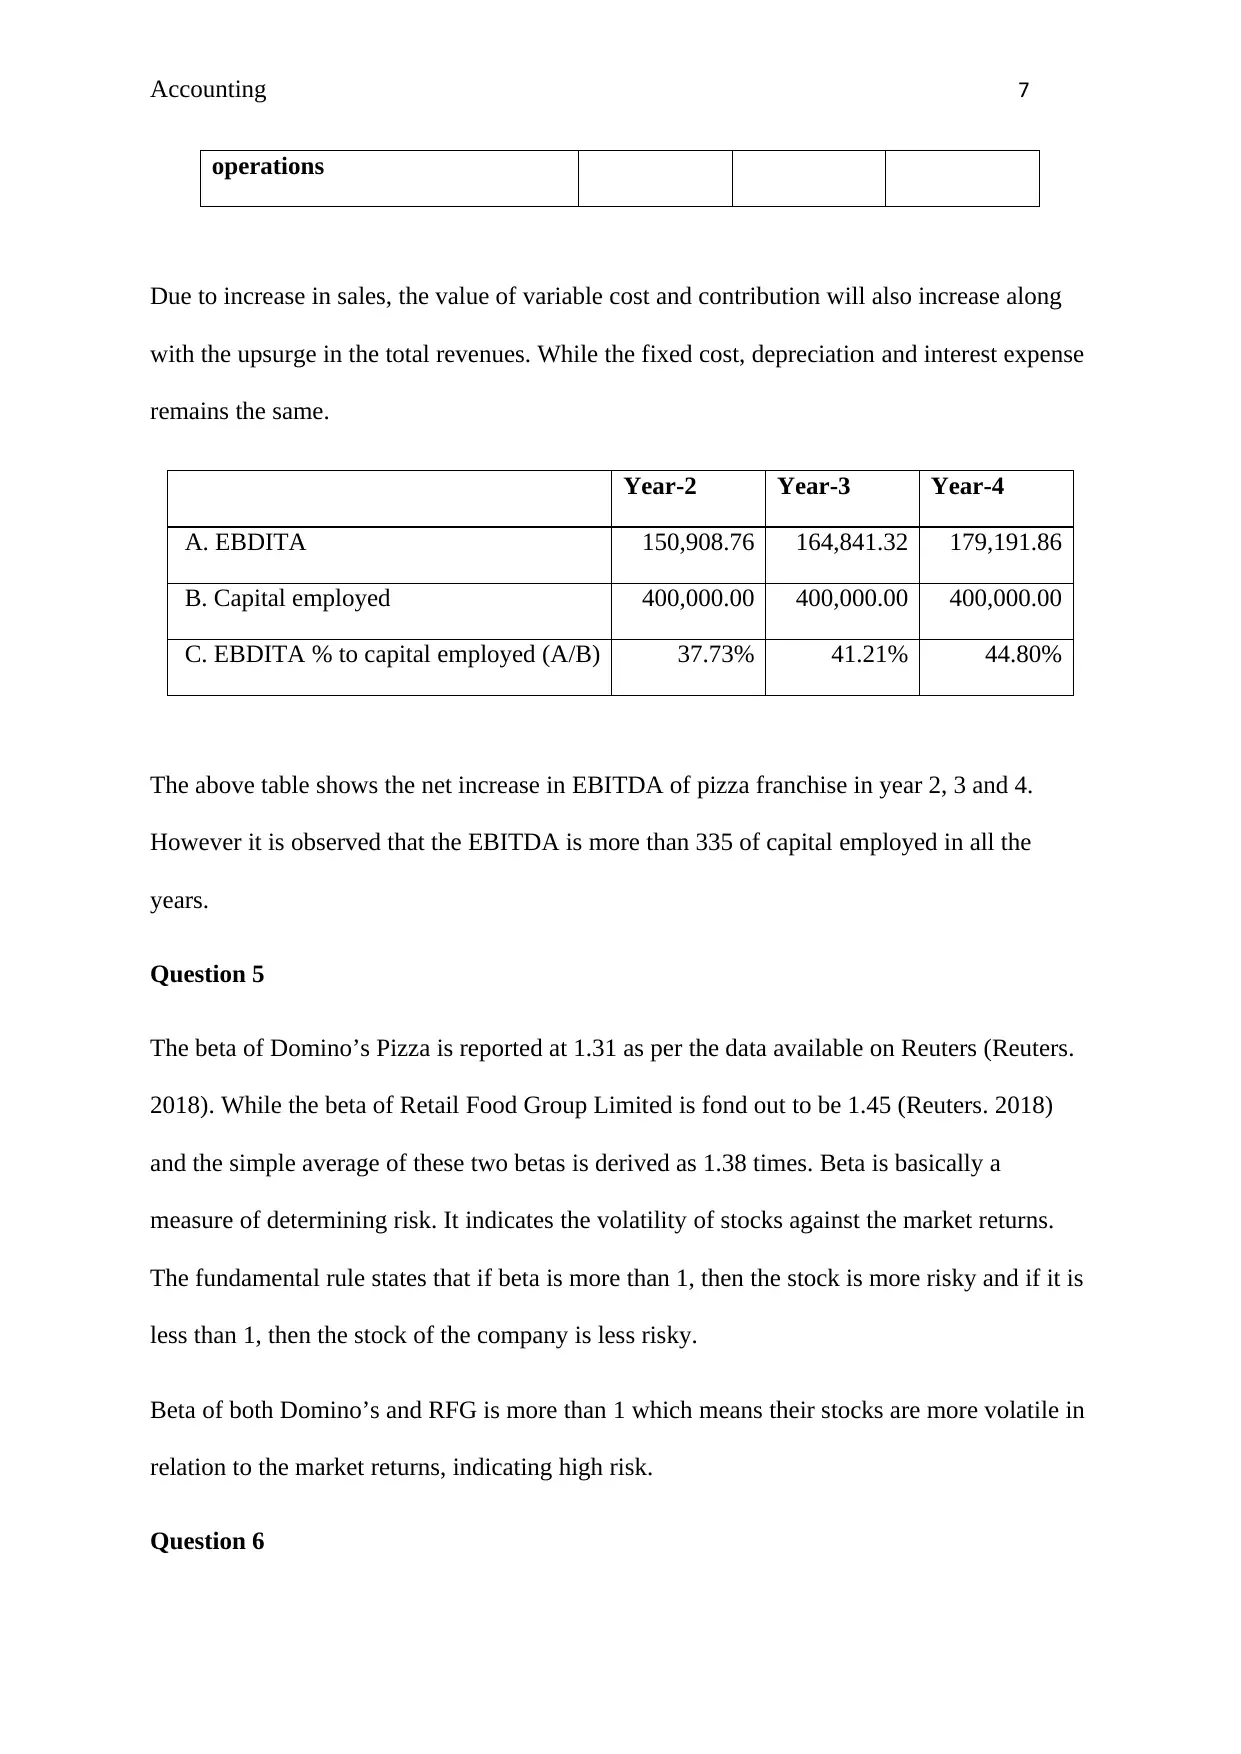
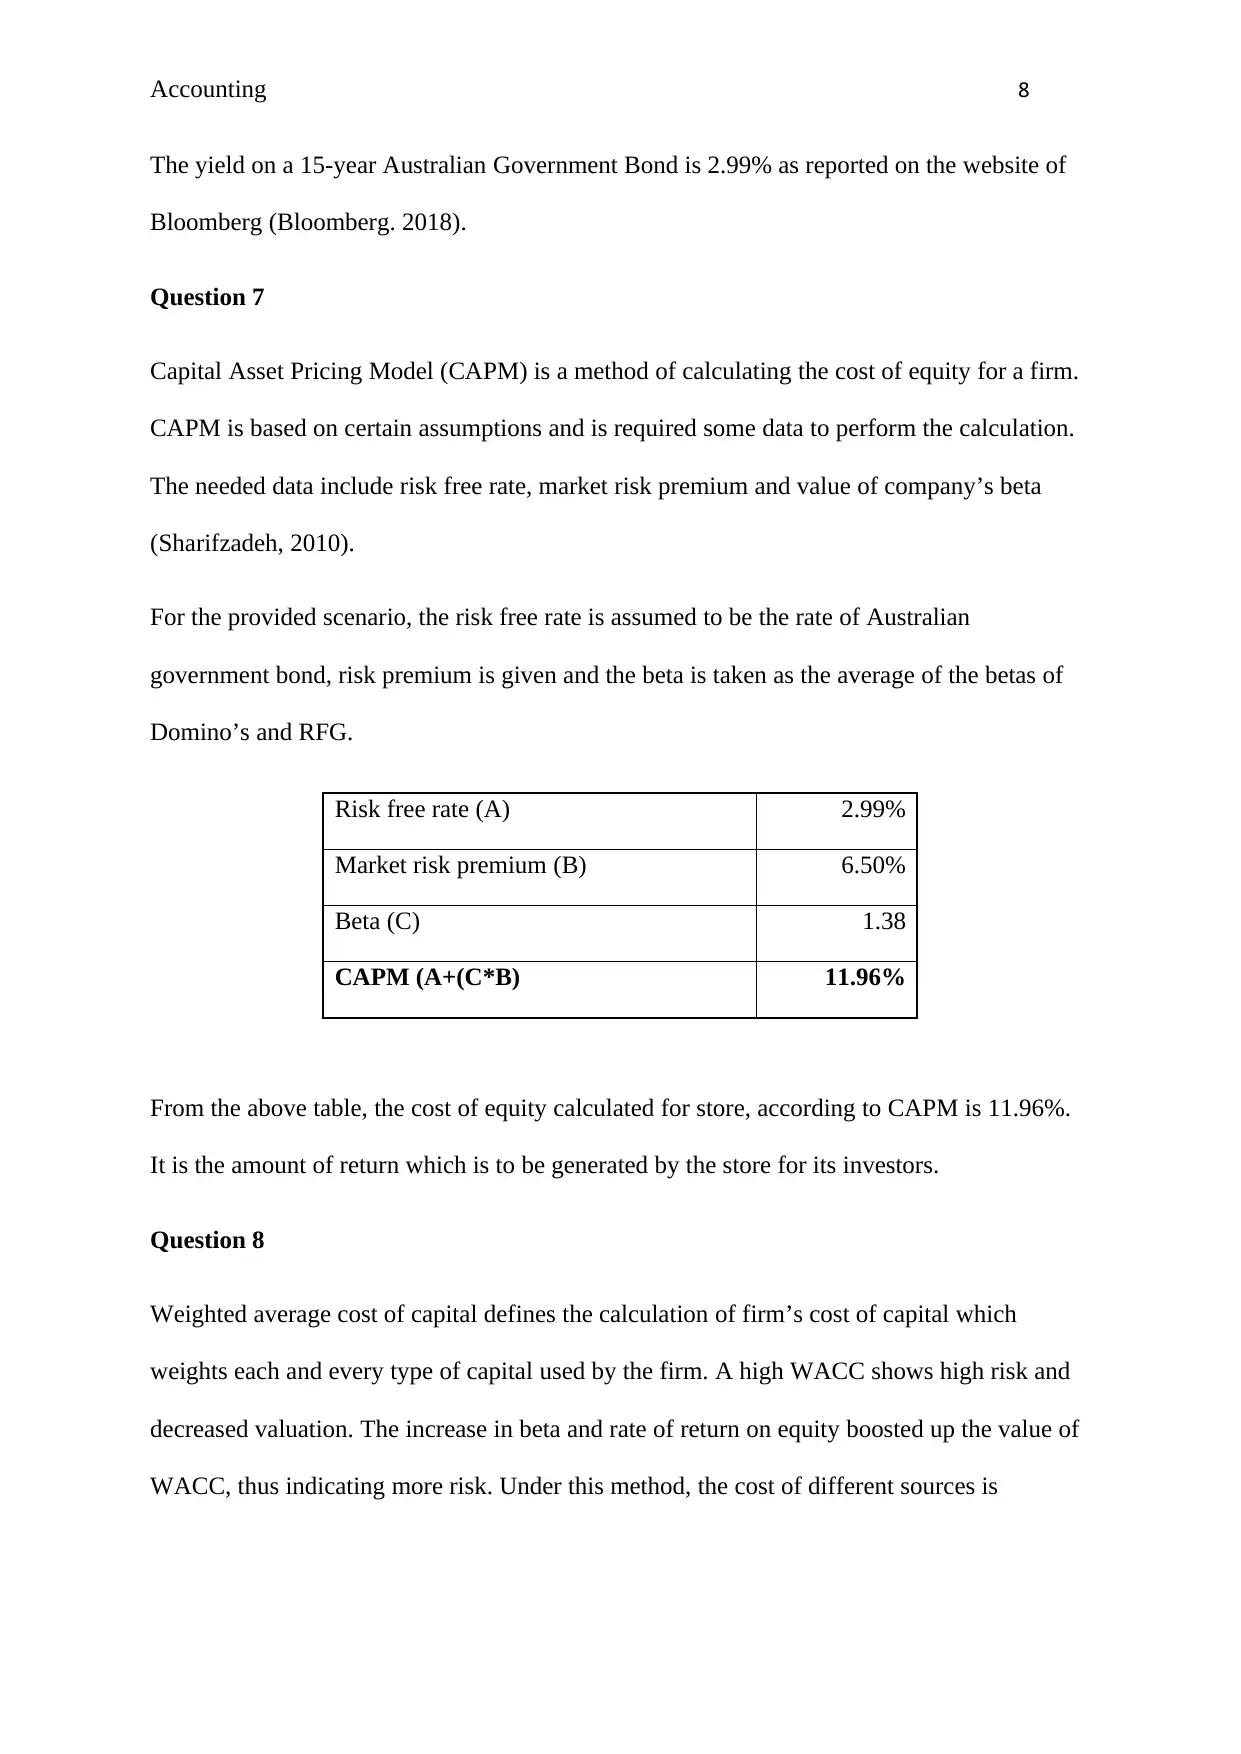
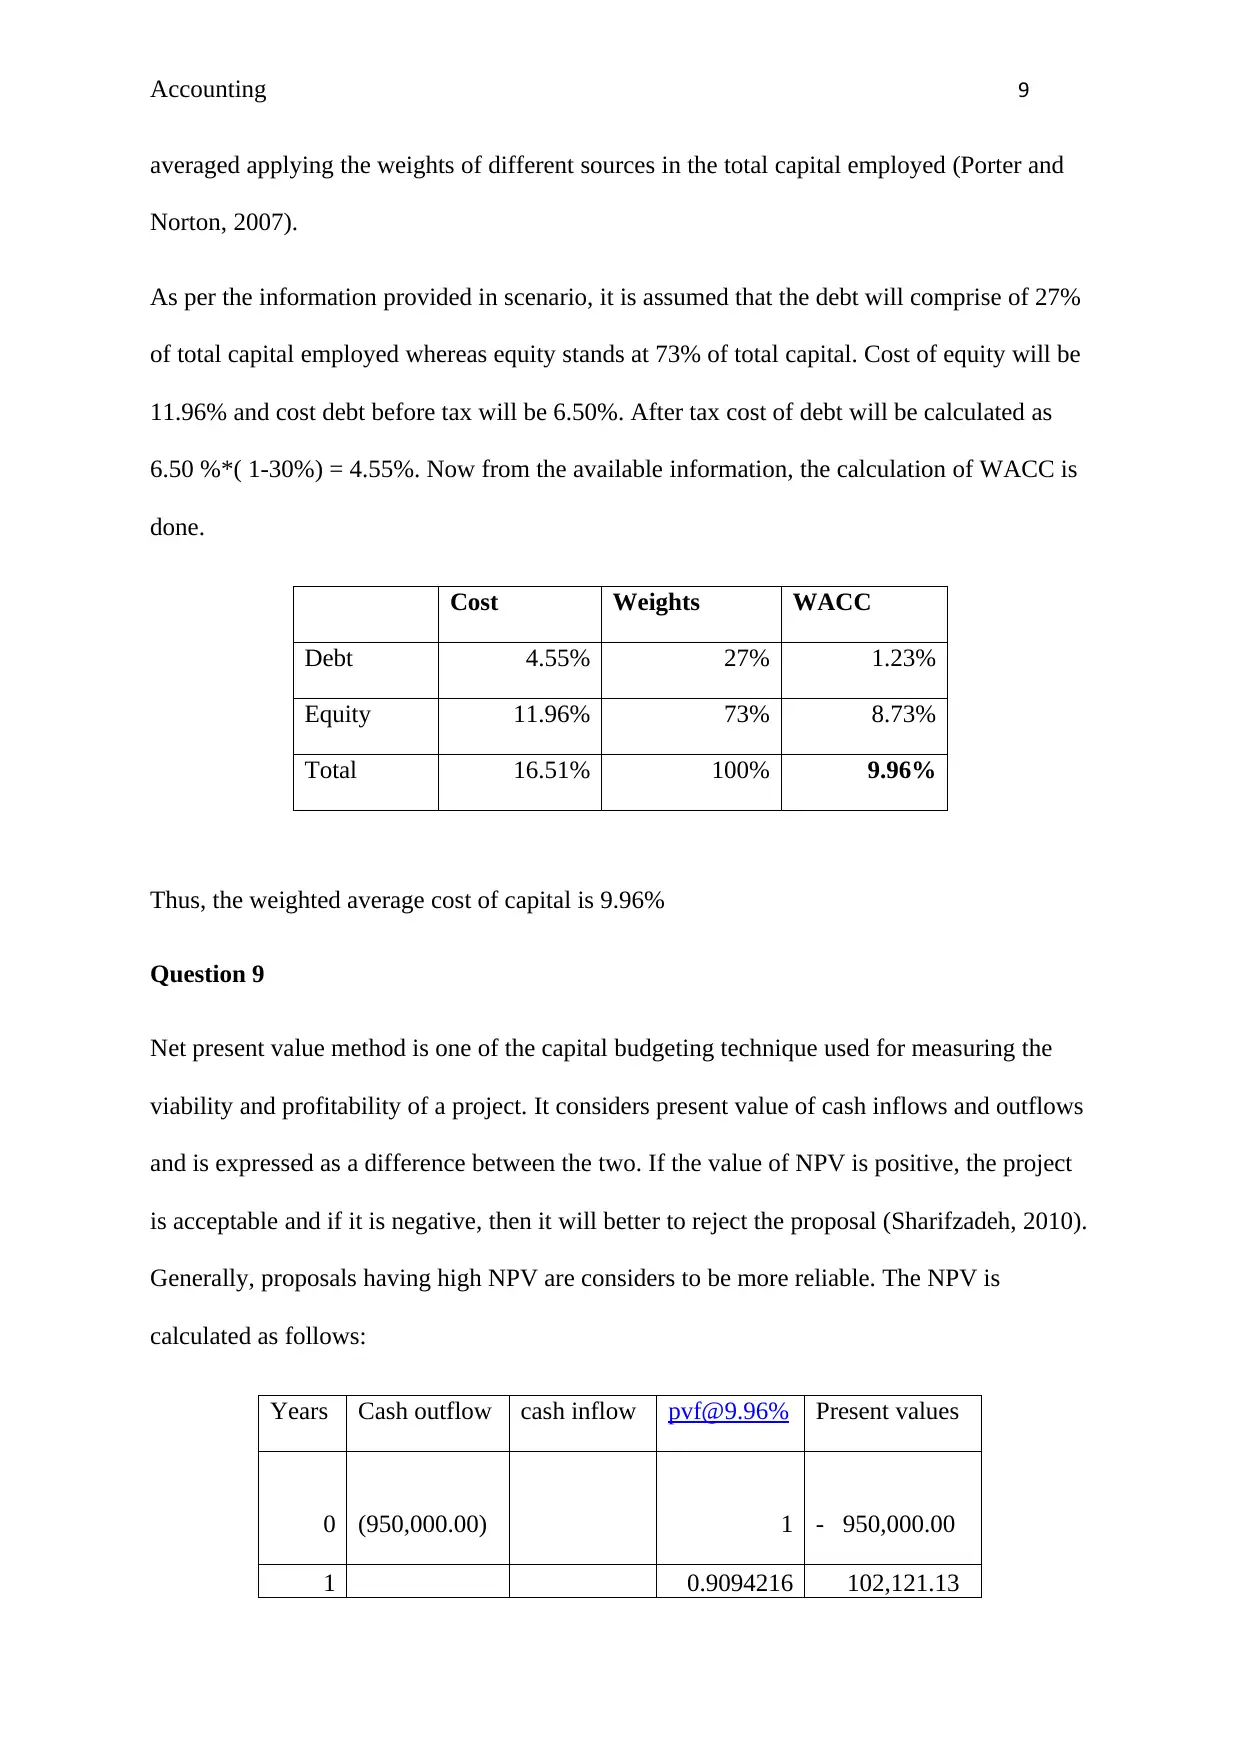
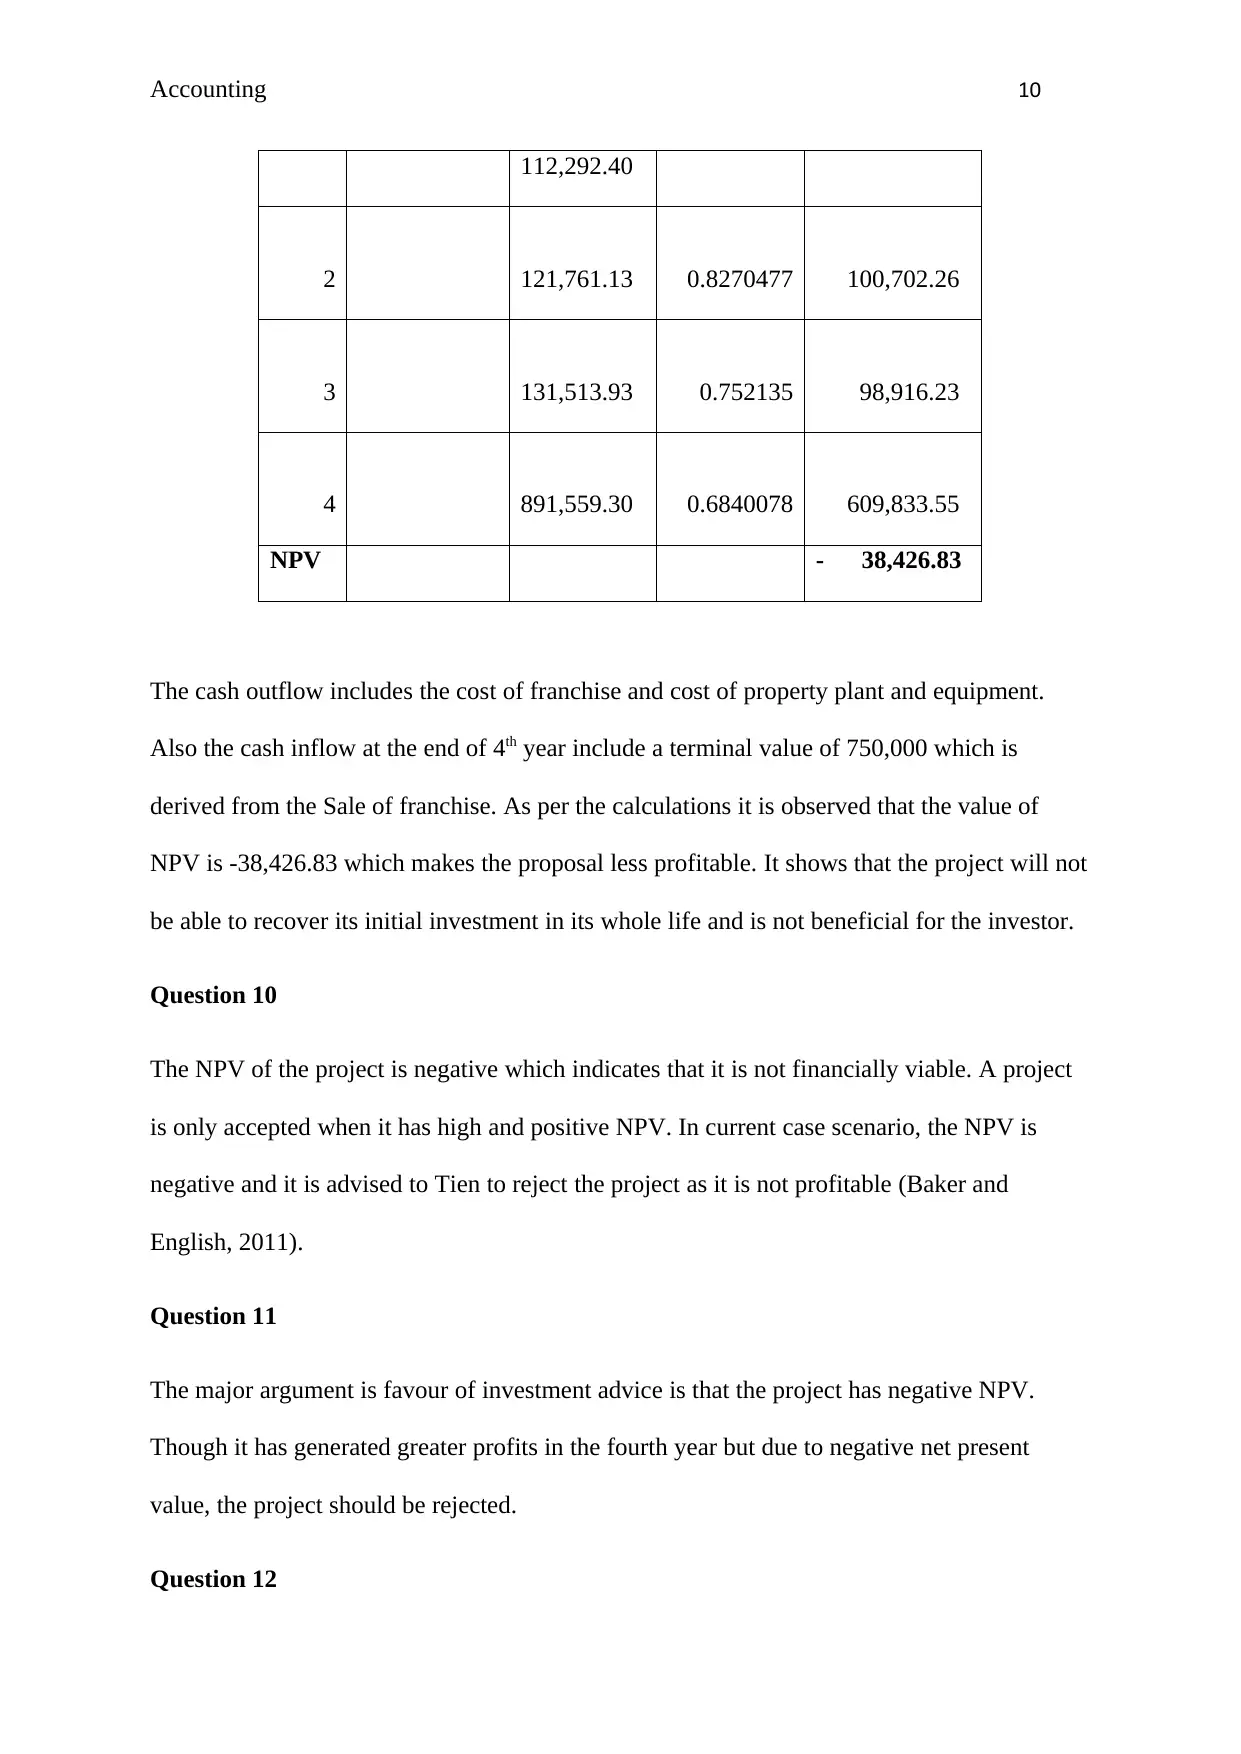
This assignment provides a comprehensive financial analysis of a pizza franchise, addressing several key financial concepts. It begins by calculating the number of pizza units needed to achieve a desired profit, followed by the preparation of an income statement and the calculation of free cash flow using the indirect method. The assignment then forecasts the income statement and free cash flows for the next three years, considering a 3% annual increase in pizza sales. It proceeds to determine the beta of the franchise and its competitors, calculate the cost of equity using the Capital Asset Pricing Model (CAPM), and estimate the weighted average cost of capital (WACC). Finally, the net present value (NPV) of the project is calculated, leading to an investment recommendation and a discussion of potential risks associated with the investment. The analysis utilizes various financial metrics and models to assess the project's viability and profitability.
Document Page
RUNNING HEAD: ACCOUNTING
Accounting
tabler-icon-diamond-filled.svg

Secure Best Marks with AI Grader

Need help grading? Try our AI Grader for instant feedback on your assignments.
Document Page
Accounting 2
Question 1
In order to figure out the number of units required to be sell for arriving at a desired level of
output, it is necessary to determine the fixed cost and the return required before tax.
Summation of these two amounts will be then divided by contribution margin per unit.
According to the case scenario provided for pizza franchise, following information is ben
derived and number of units are calculated
$
Contribution margin 3.77
Total fixed cost 367260
Desired return 400000*20% 80000
Total 447260
Number of units required 447260/3.77 118637
Per week 118636.6/52 2281.47
So, it can be said that 2,281 pizzas are required to be sold every week to achieve a desired or
targeted profit of $80,000.
Question 2
The income statement shows the earnings before interest, tax, depreciation and amortisation
for the pizza franchise. It also shows the net income of the company after paying the tax at
the rate of 30%. Estimations are done for one year only and income statement is prepared for
the same.
Income statement: Year 1
Particulars Amount
Document Page
Accounting 3
Sales volume (2300*52) 119,600.00
Price per Pizza 10.00
Revenues (A) (119,600*10) 1,196,000.00
Less: Variable cost (B)
Cost of goods sold @ $4.93 589,628.00
Royalty (7% of sales) 83,720.00
Marketing Contribution (6% of sales) 71,760.00
Contribution (A-B) 450,892.00
Less: Fixed costs
Full-Time Employee Costs 123,000.00
Casual Employee Costs 67,392.00
On-Costs 57,118.00
Store Costs (outgoings) 18,000.00
Occupancy Cost (rent) 48,000.00
Profit before interest, tax and depreciation (EBITDA) 137,382.00
Less: Interest (150000*6.5%) 9,750.00
Less: Depreciation (400000*11%) 44,000.00
Profit before tax 83,632.00
Less: Tax @30% 25,089.60
Net Income 58,542.40
Question 3
Document Page
Accounting 4
According to the income statement prepared for the first year, the calculation of free cash
flow is done by applying the indirect method. This technique includes adding back all the
adjustment to the net income derived from the calculations done in income statement.
Following are the free cash flows from operations:
Estimate the free cash flow (Indirect method): Year-1
Particulars Amount
Profit after tax 58,542.40
Add: Depreciation 44,000.00
Add: Interest 9,750.00
Free Cash Flows from operations 112,292.40
To arrive at the value of free cash flows from operations, depreciation and interest expense is
added back to the net income. The reason for adding depreciation is that it is a non-cash
expenses and is not required to be subtracted from cash flow calculation. Also the interest
being a non-operational expenditure, is added back to derive FCF from operations (Jury,
2012).
Question 4
To estimate the FCFs for three more years, the income statement of Pizza franchise for three
years is required. Following calculation are been done to get the outcome:
Income statement
Year 1 Year 2 Year 3 Year 4
Particulars Amount Amount Amount Amount
Sales volume
tabler-icon-diamond-filled.svg

Secure Best Marks with AI Grader

Need help grading? Try our AI Grader for instant feedback on your assignments.
Document Page
Accounting 5
119,600.00 123,188.00 126,883.64 130,690.15
Price per Pizza 10.00 10.00 10.00 10.00
Revenues (A) 1,196,000.00 1,231,880.00 1,268,836.40 1,306,901.49
Less: Variable cost (B)
Cost of goods sold @ $4.93 589,628.00 607,316.84 625,536.35 644,302.44
Royalty (7% of sales) 83,720.00 86,231.60 88,818.55 91,483.10
Marketing Contribution (6%
of sales) 71,760.00 73,912.80 76,130.18 78,414.09
Contribution (A-B) 450,892.00 464,418.76 478,351.32 492,701.86
Less: Fixed costs
Full-Time Employee Costs 123,000.00 123,000.00 123,000.00 123,000.00
Casual Employee Costs 67,392.00 67,392.00 67,392.00 67,392.00
On-Costs 57,118.00 57,118.00 57,118.00 57,118.00
Store Costs (outgoings) 18,000.00 18,000.00 18,000.00 18,000.00
Occupancy Cost (rent)
Document Page
Accounting 6
48,000.00 48,000.00 48,000.00 48,000.00
Profit before interest, tax
and depreciation 137,382.00 150,908.76 164,841.32 179,191.86
Less: Interest
(150000*6.5%) 9,750.00 9,750.00 9,750.00 9,750.00
Less: Depreciation
(400000*11%) 44,000.00 44,000.00 44,000.00 44,000.00
Profit before tax 83,632.00 97,158.76 111,091.32 125,441.86
Less: Tax @30% 25,089.60 29,147.63 33,327.40 37,632.56
Net Income 58,542.40 68,011.13 77,763.93 87,809.30
The above calculation for three years is done on the assumptions that the number of pizza
will increase by 3% in coming years. On the basis of above information, the free cash flow is
calculated as follows:
Estimate the free cash flow (Indirect method)
Particulars Year-2 Year-3 Year-4
Profit after tax 68,011.13 77,763.93 87,809.30
Add: Depreciation 44,000.00 44,000.00 44,000.00
Add: Interest 9,750.00 9,750.00 9,750.00
Free Cash Flows from 121,761.13 131,513.93 141,559.30
Document Page
Accounting 7
operations
Due to increase in sales, the value of variable cost and contribution will also increase along
with the upsurge in the total revenues. While the fixed cost, depreciation and interest expense
remains the same.
Year-2 Year-3 Year-4
A. EBDITA 150,908.76 164,841.32 179,191.86
B. Capital employed 400,000.00 400,000.00 400,000.00
C. EBDITA % to capital employed (A/B) 37.73% 41.21% 44.80%
The above table shows the net increase in EBITDA of pizza franchise in year 2, 3 and 4.
However it is observed that the EBITDA is more than 335 of capital employed in all the
years.
Question 5
The beta of Domino’s Pizza is reported at 1.31 as per the data available on Reuters (Reuters.
2018). While the beta of Retail Food Group Limited is fond out to be 1.45 (Reuters. 2018)
and the simple average of these two betas is derived as 1.38 times. Beta is basically a
measure of determining risk. It indicates the volatility of stocks against the market returns.
The fundamental rule states that if beta is more than 1, then the stock is more risky and if it is
less than 1, then the stock of the company is less risky.
Beta of both Domino’s and RFG is more than 1 which means their stocks are more volatile in
relation to the market returns, indicating high risk.
Question 6
tabler-icon-diamond-filled.svg

Paraphrase This Document

Need a fresh take? Get an instant paraphrase of this document with our AI Paraphraser
Document Page
Accounting 8
The yield on a 15-year Australian Government Bond is 2.99% as reported on the website of
Bloomberg (Bloomberg. 2018).
Question 7
Capital Asset Pricing Model (CAPM) is a method of calculating the cost of equity for a firm.
CAPM is based on certain assumptions and is required some data to perform the calculation.
The needed data include risk free rate, market risk premium and value of company’s beta
(Sharifzadeh, 2010).
For the provided scenario, the risk free rate is assumed to be the rate of Australian
government bond, risk premium is given and the beta is taken as the average of the betas of
Domino’s and RFG.
Risk free rate (A) 2.99%
Market risk premium (B) 6.50%
Beta (C) 1.38
CAPM (A+(C*B) 11.96%
From the above table, the cost of equity calculated for store, according to CAPM is 11.96%.
It is the amount of return which is to be generated by the store for its investors.
Question 8
Weighted average cost of capital defines the calculation of firm’s cost of capital which
weights each and every type of capital used by the firm. A high WACC shows high risk and
decreased valuation. The increase in beta and rate of return on equity boosted up the value of
WACC, thus indicating more risk. Under this method, the cost of different sources is
Document Page
Accounting 9
averaged applying the weights of different sources in the total capital employed (Porter and
Norton, 2007).
As per the information provided in scenario, it is assumed that the debt will comprise of 27%
of total capital employed whereas equity stands at 73% of total capital. Cost of equity will be
11.96% and cost debt before tax will be 6.50%. After tax cost of debt will be calculated as
6.50 %*( 1-30%) = 4.55%. Now from the available information, the calculation of WACC is
done.
Cost Weights WACC
Debt 4.55% 27% 1.23%
Equity 11.96% 73% 8.73%
Total 16.51% 100% 9.96%
Thus, the weighted average cost of capital is 9.96%
Question 9
Net present value method is one of the capital budgeting technique used for measuring the
viability and profitability of a project. It considers present value of cash inflows and outflows
and is expressed as a difference between the two. If the value of NPV is positive, the project
is acceptable and if it is negative, then it will better to reject the proposal (Sharifzadeh, 2010).
Generally, proposals having high NPV are considers to be more reliable. The NPV is
calculated as follows:
Years Cash outflow cash inflow pvf@9.96% Present values
0 (950,000.00) 1 - 950,000.00
1 0.9094216 102,121.13
Document Page
Accounting 10
112,292.40
2 121,761.13 0.8270477 100,702.26
3 131,513.93 0.752135 98,916.23
4 891,559.30 0.6840078 609,833.55
NPV - 38,426.83
The cash outflow includes the cost of franchise and cost of property plant and equipment.
Also the cash inflow at the end of 4th year include a terminal value of 750,000 which is
derived from the Sale of franchise. As per the calculations it is observed that the value of
NPV is -38,426.83 which makes the proposal less profitable. It shows that the project will not
be able to recover its initial investment in its whole life and is not beneficial for the investor.
Question 10
The NPV of the project is negative which indicates that it is not financially viable. A project
is only accepted when it has high and positive NPV. In current case scenario, the NPV is
negative and it is advised to Tien to reject the project as it is not profitable (Baker and
English, 2011).
Question 11
The major argument is favour of investment advice is that the project has negative NPV.
Though it has generated greater profits in the fourth year but due to negative net present
value, the project should be rejected.
Question 12
tabler-icon-diamond-filled.svg

Secure Best Marks with AI Grader

Need help grading? Try our AI Grader for instant feedback on your assignments.
Document Page
Accounting 11
Risks that can be faced by Tien while investing are:
High competition in the fast food market
Price cut and decrease in demand
Uncertain conditions prevailing in the environment which may affect the plan of 3%
increase in sales volume.
Risk related to political and environmental factors. Changes in government
regulations can be risky for the investment (Brigham and Houston, 2015).
All of the above risks can have a major impact on the investment made by Tien.
References
Baker, H.K. and English, P. (2011). Capital Budgeting Valuation: Financial Analysis for
Today's Investment Projects. New Jersey: John Wiley & Sons.
chevron_up_icon
1 out of 11
circle_padding
hide_on_mobile
zoom_out_icon
logo.png

Your All-in-One AI-Powered Toolkit for Academic Success.

Available 24*7 on WhatsApp / Email

[object Object]