Financial Analysis Report: Cash Budget, Breakeven, and NPV Analysis

Verified

Added on  2022/11/01

|9
|1234
|404
Report
AI Summary
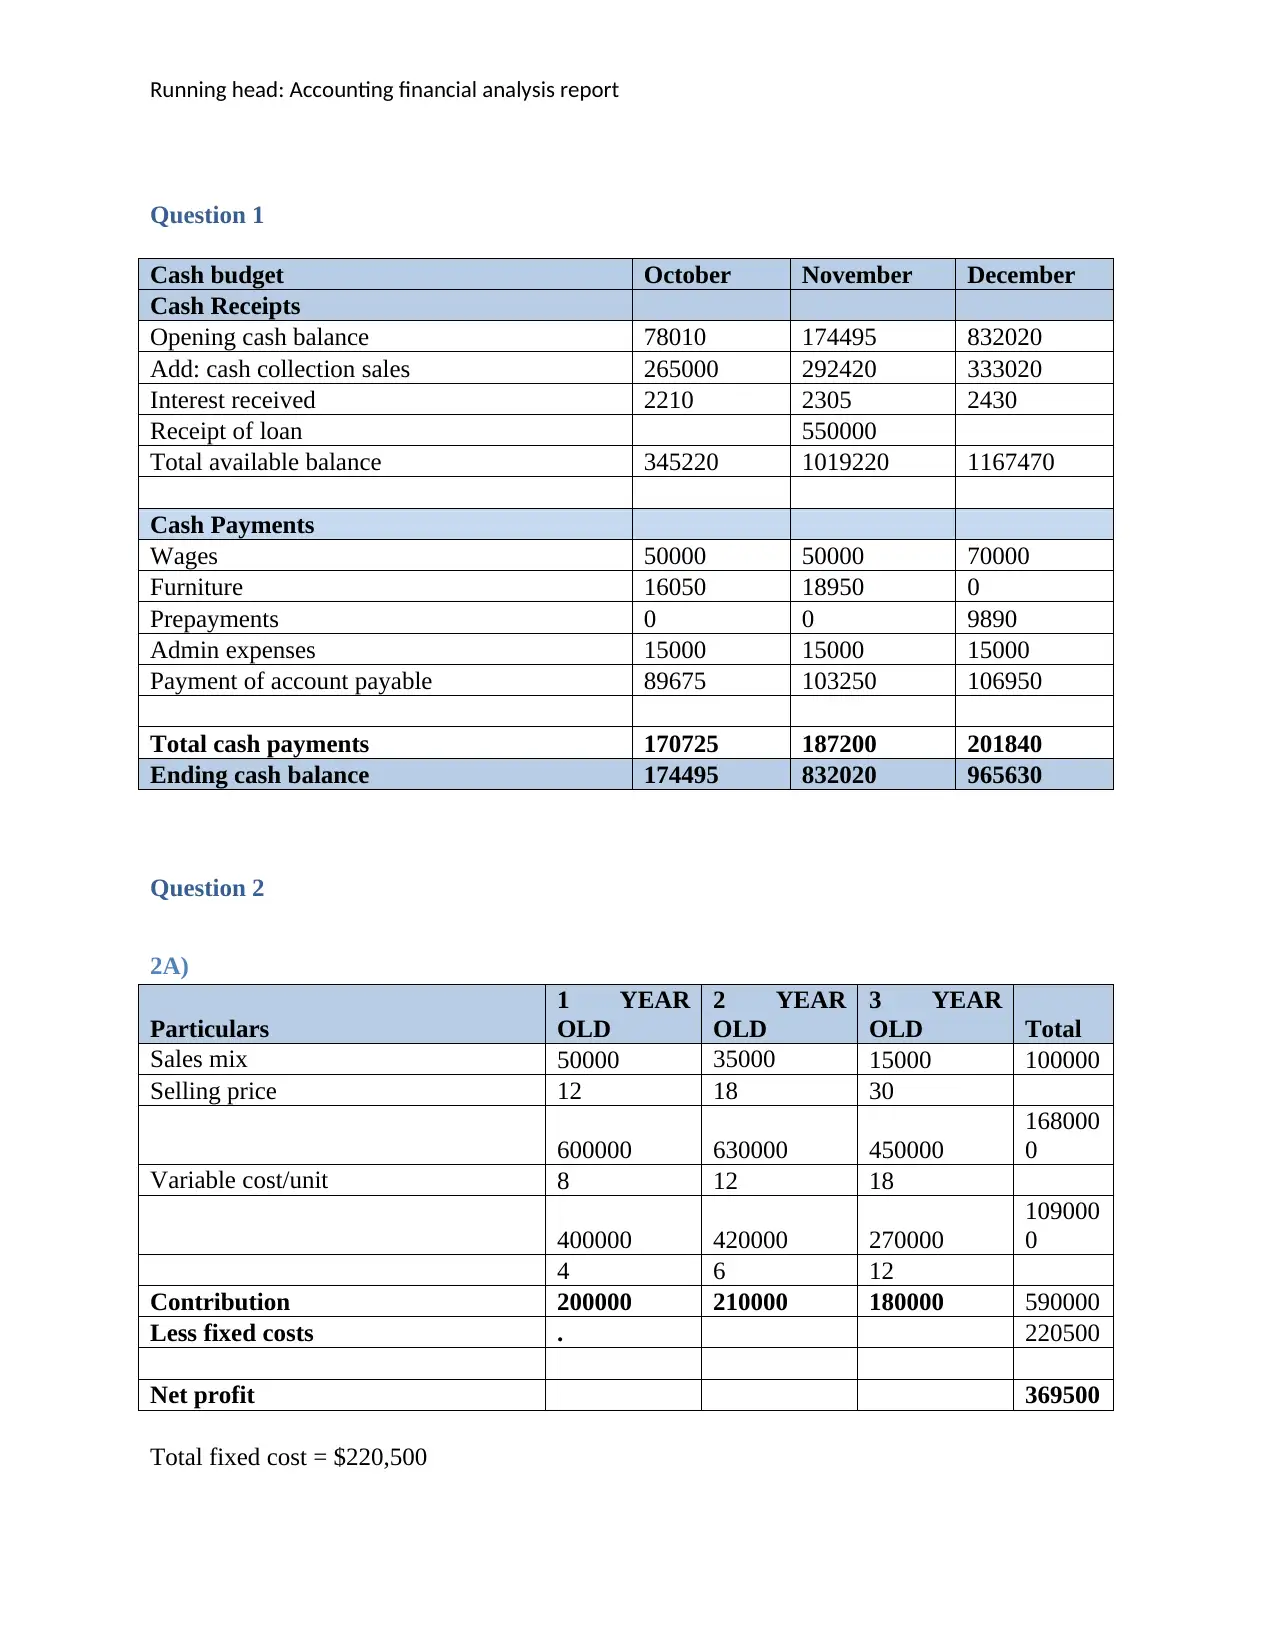
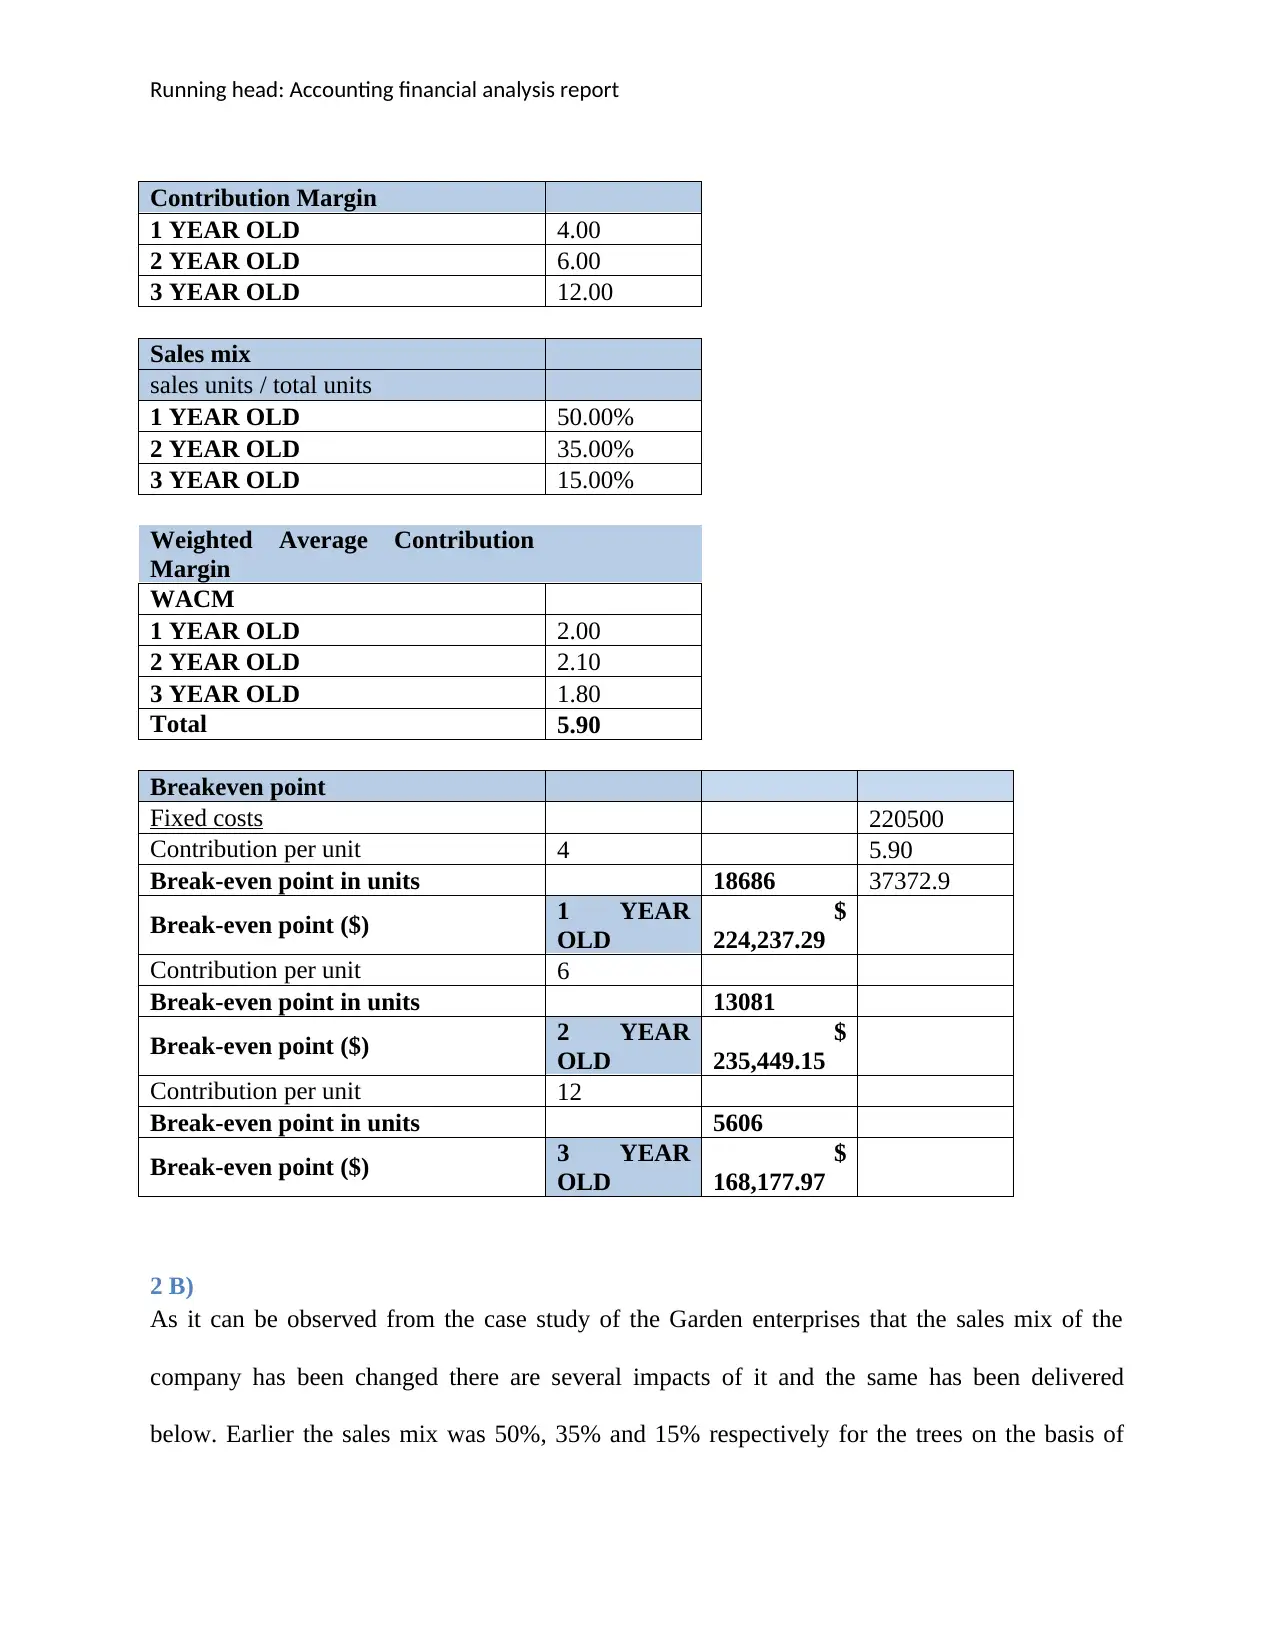
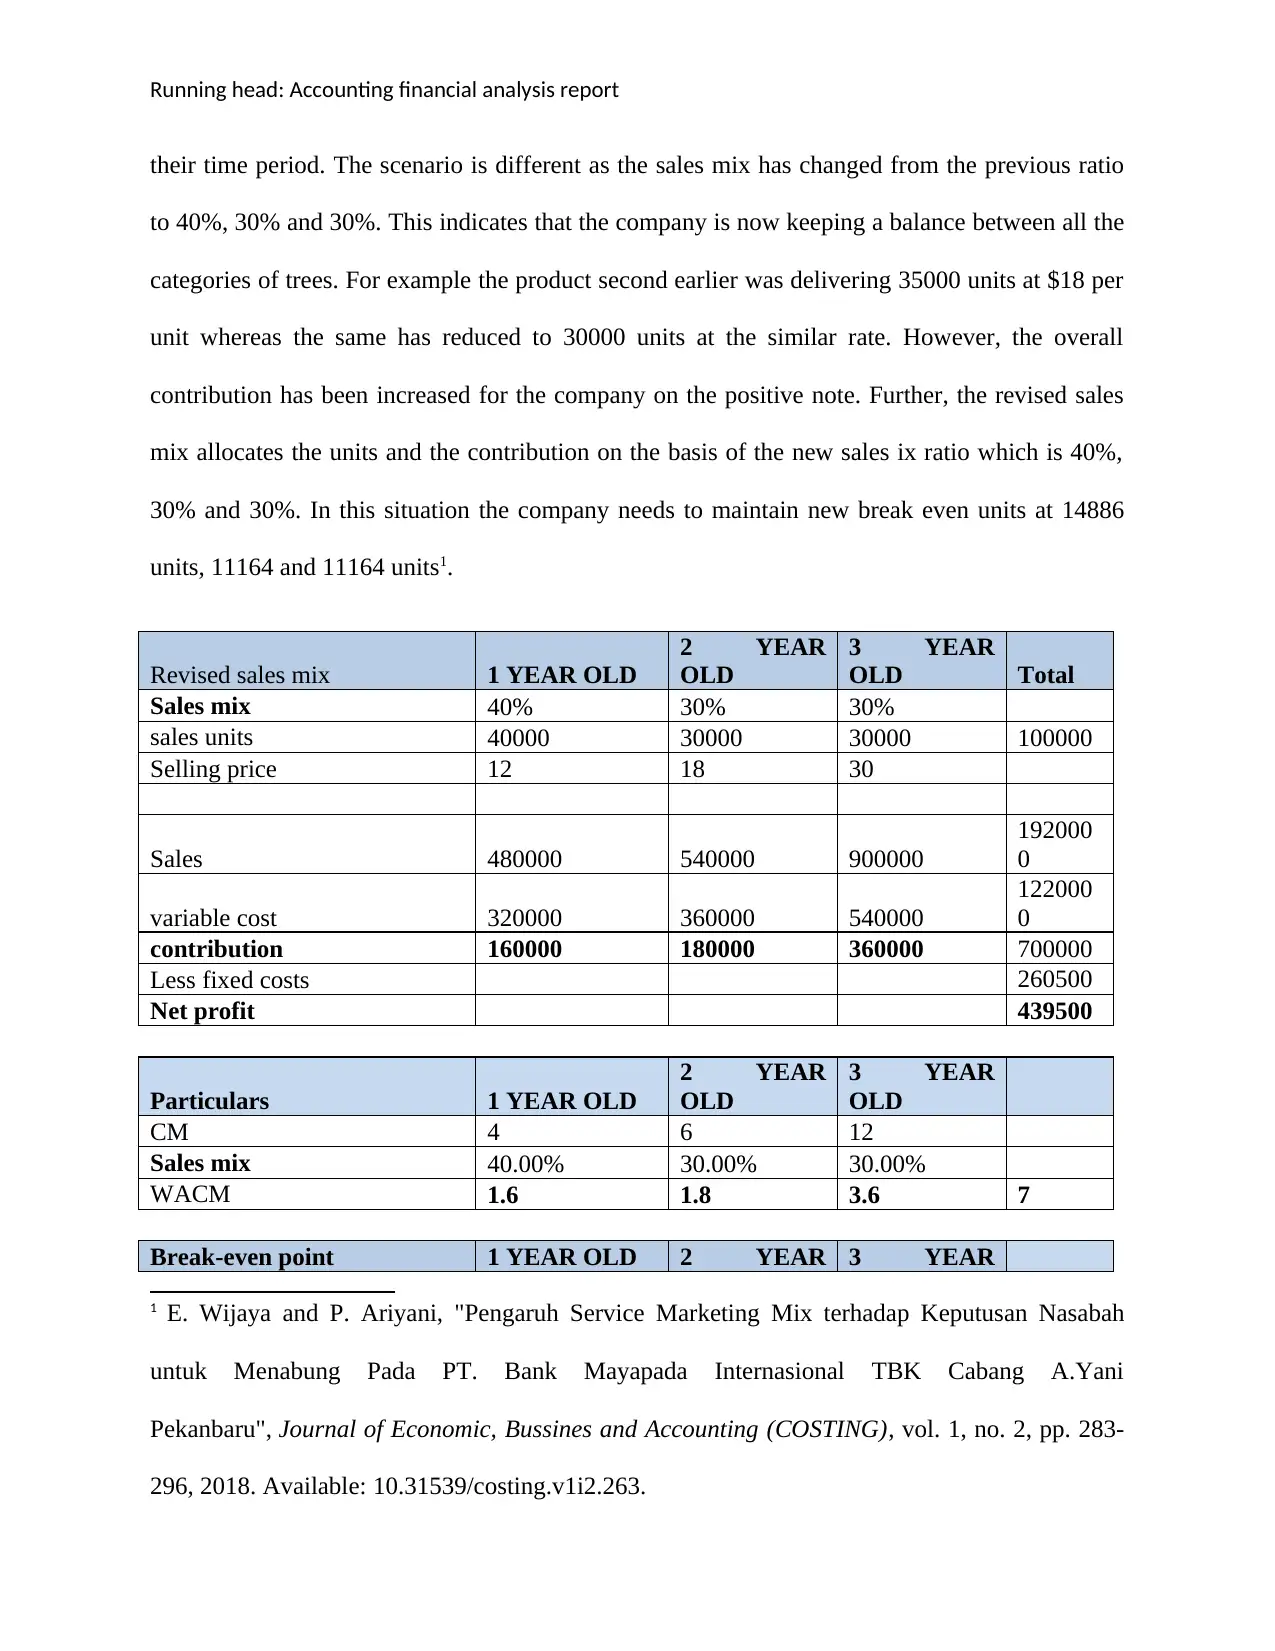
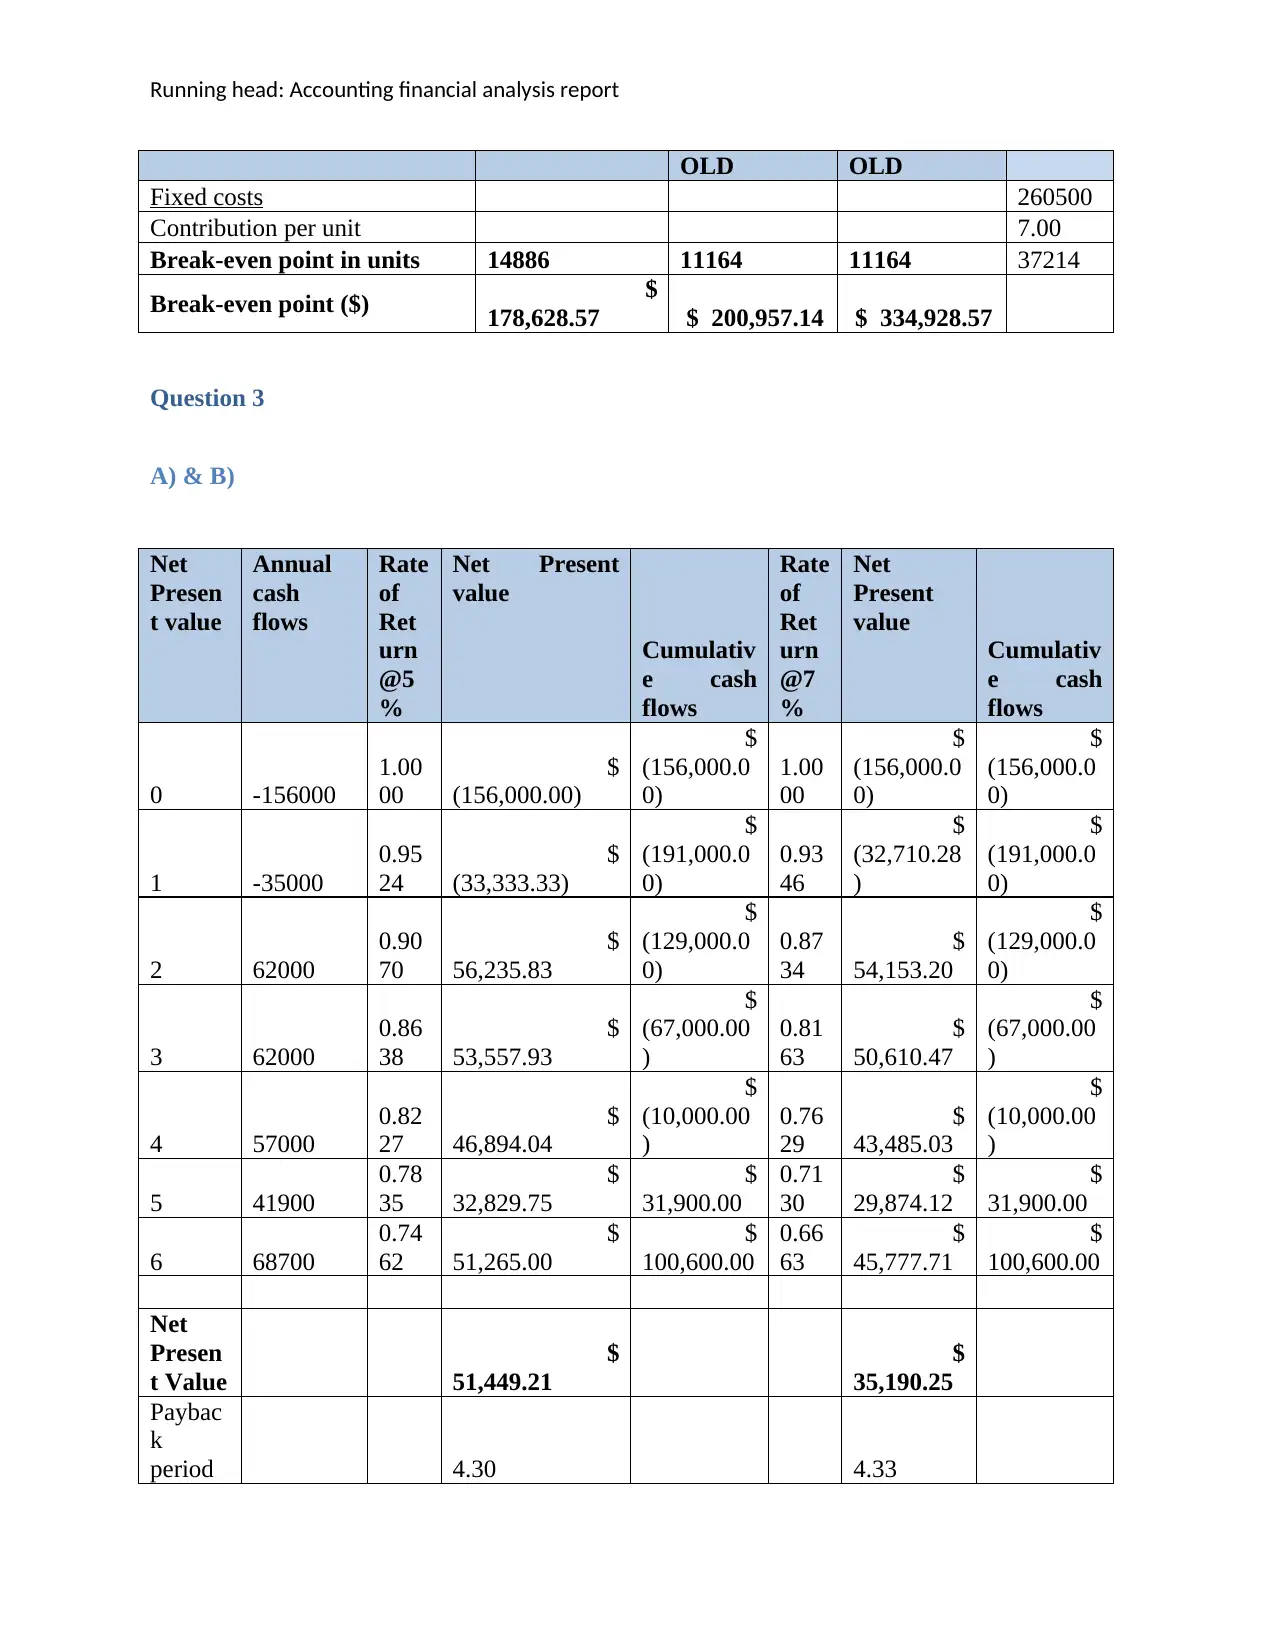
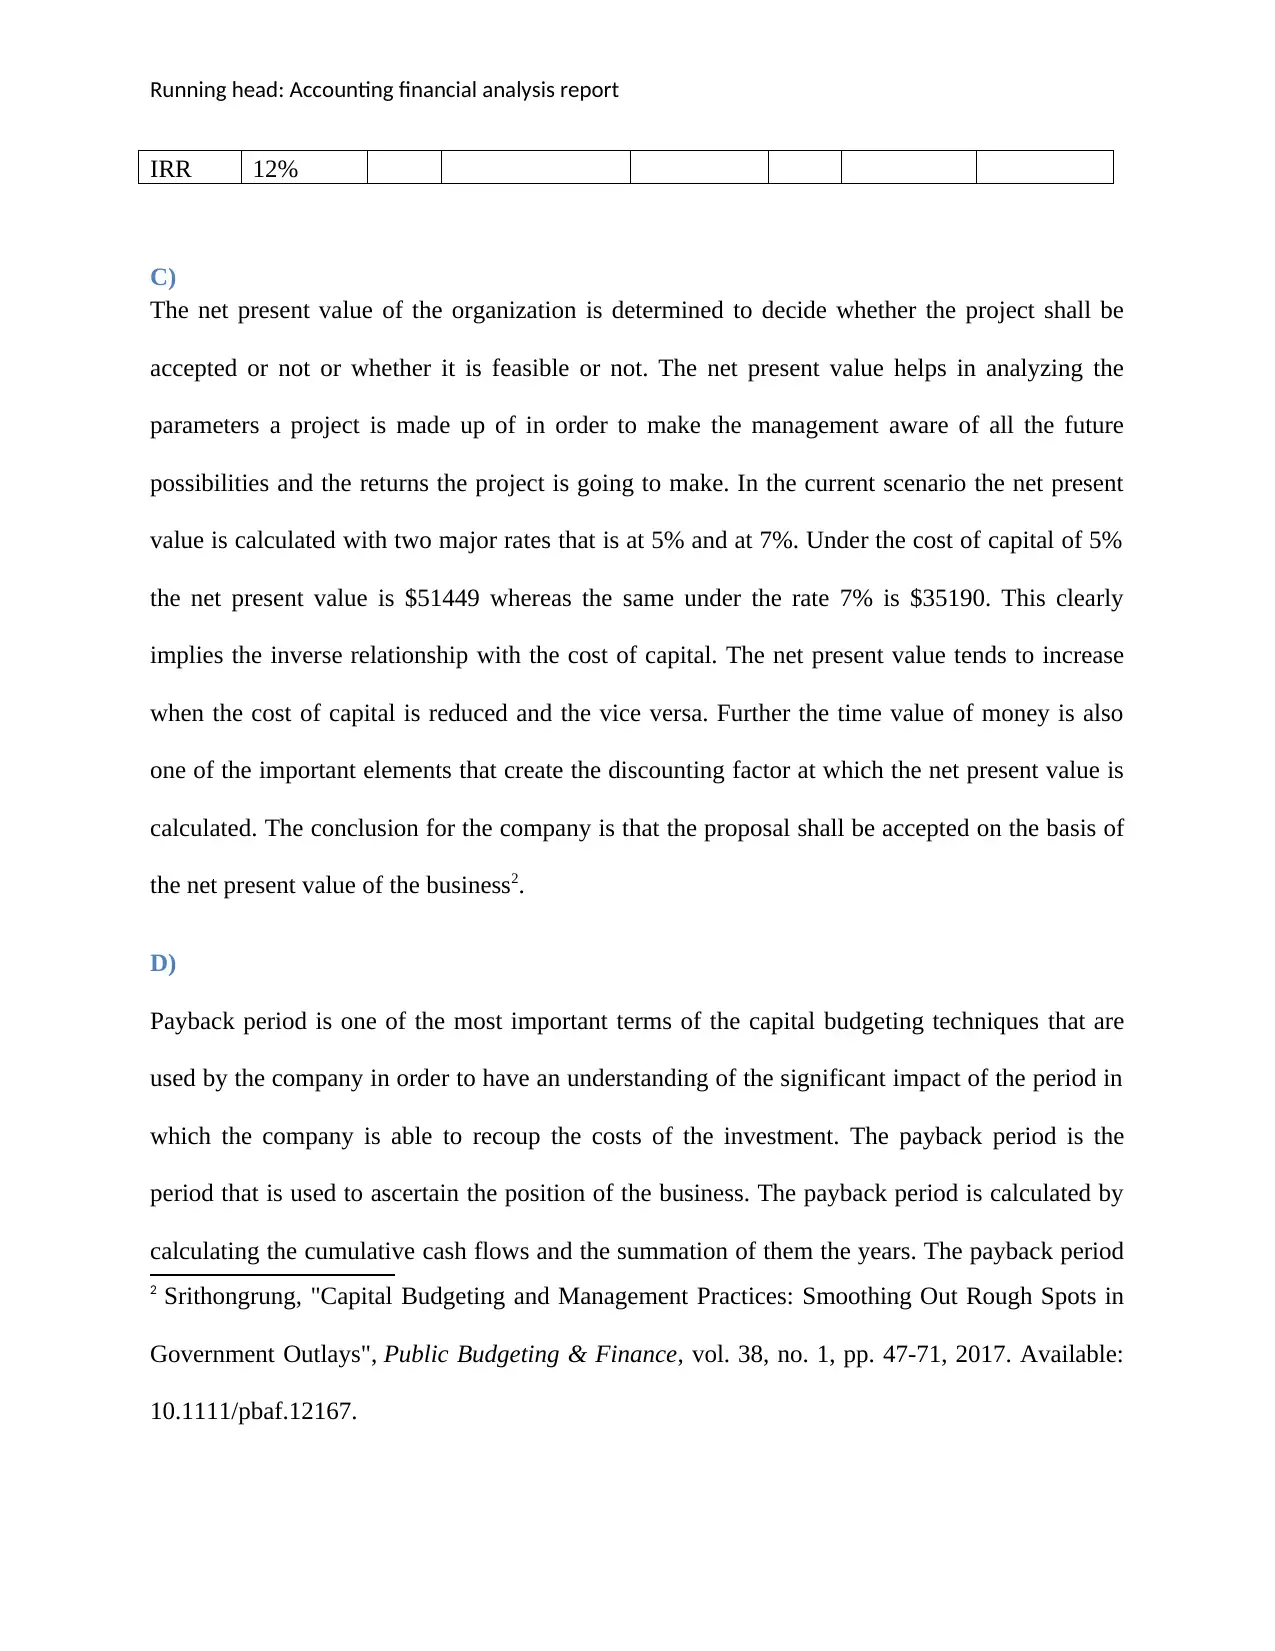
This financial analysis report presents a comprehensive examination of Garden Enterprises' financial performance. The report begins with a detailed cash budget analysis spanning three months, evaluating cash receipts and payments to determine the ending cash balance. Subsequently, a breakeven analysis is conducted, considering different product sales mixes and their impact on profitability. The report then delves into capital budgeting techniques, specifically net present value (NPV) calculations and payback period analysis, to assess the viability of a project under various discount rates. The NPV is calculated at 5% and 7%, and a payback period of 4.30 years is determined. The report concludes that the project should be accepted based on positive NPV and an acceptable payback period. The report includes references to relevant academic sources.
tabler-icon-diamond-filled.svg

Contribute Materials

Your contribution can guide someone’s learning journey. Share your documents today.
Document Page
Running head: Accounting financial analysis report 1
Accounting financial analysis report
tabler-icon-diamond-filled.svg

Secure Best Marks with AI Grader

Need help grading? Try our AI Grader for instant feedback on your assignments.
Document Page
Running head: Accounting financial analysis report
Table of Contents
Question 1........................................................................................................................................3
Question 2........................................................................................................................................4
A).................................................................................................................................................4
B)..................................................................................................................................................4
Question 3........................................................................................................................................6
A).................................................................................................................................................6
B)..................................................................................................................................................6
C)..................................................................................................................................................6
D).................................................................................................................................................7
References........................................................................................................................................8
Document Page
Running head: Accounting financial analysis report
Question 1
Cash budget October November December
Cash Receipts
Opening cash balance 78010 174495 832020
Add: cash collection sales 265000 292420 333020
Interest received 2210 2305 2430
Receipt of loan 550000
Total available balance 345220 1019220 1167470
Cash Payments
Wages 50000 50000 70000
Furniture 16050 18950 0
Prepayments 0 0 9890
Admin expenses 15000 15000 15000
Payment of account payable 89675 103250 106950
Total cash payments 170725 187200 201840
Ending cash balance 174495 832020 965630
Question 2
2A)
Particulars
1 YEAR
OLD
2 YEAR
OLD
3 YEAR
OLD Total
Sales mix 50000 35000 15000 100000
Selling price 12 18 30
600000 630000 450000
168000
0
Variable cost/unit 8 12 18
400000 420000 270000
109000
0
4 6 12
Contribution 200000 210000 180000 590000
Less fixed costs . 220500
Net profit 369500
Total fixed cost = $220,500
Document Page
Running head: Accounting financial analysis report
Contribution Margin
1 YEAR OLD 4.00
2 YEAR OLD 6.00
3 YEAR OLD 12.00
Sales mix
sales units / total units
1 YEAR OLD 50.00%
2 YEAR OLD 35.00%
3 YEAR OLD 15.00%
Weighted Average Contribution
Margin
WACM
1 YEAR OLD 2.00
2 YEAR OLD 2.10
3 YEAR OLD 1.80
Total 5.90
Breakeven point
Fixed costs 220500
Contribution per unit 4 5.90
Break-even point in units 18686 37372.9
Break-even point ($) 1 YEAR
OLD
$
224,237.29
Contribution per unit 6
Break-even point in units 13081
Break-even point ($) 2 YEAR
OLD
$
235,449.15
Contribution per unit 12
Break-even point in units 5606
Break-even point ($) 3 YEAR
OLD
$
168,177.97
2 B)
As it can be observed from the case study of the Garden enterprises that the sales mix of the
company has been changed there are several impacts of it and the same has been delivered
below. Earlier the sales mix was 50%, 35% and 15% respectively for the trees on the basis of
tabler-icon-diamond-filled.svg

Secure Best Marks with AI Grader

Need help grading? Try our AI Grader for instant feedback on your assignments.
Document Page
Running head: Accounting financial analysis report
their time period. The scenario is different as the sales mix has changed from the previous ratio
to 40%, 30% and 30%. This indicates that the company is now keeping a balance between all the
categories of trees. For example the product second earlier was delivering 35000 units at $18 per
unit whereas the same has reduced to 30000 units at the similar rate. However, the overall
contribution has been increased for the company on the positive note. Further, the revised sales
mix allocates the units and the contribution on the basis of the new sales ix ratio which is 40%,
30% and 30%. In this situation the company needs to maintain new break even units at 14886
units, 11164 and 11164 units1.
Revised sales mix 1 YEAR OLD
2 YEAR
OLD
3 YEAR
OLD Total
Sales mix 40% 30% 30%
sales units 40000 30000 30000 100000
Selling price 12 18 30
Sales 480000 540000 900000
192000
0
variable cost 320000 360000 540000
122000
0
contribution 160000 180000 360000 700000
Less fixed costs 260500
Net profit 439500
Particulars 1 YEAR OLD
2 YEAR
OLD
3 YEAR
OLD
CM 4 6 12
Sales mix 40.00% 30.00% 30.00%
WACM 1.6 1.8 3.6 7
Break-even point 1 YEAR OLD 2 YEAR 3 YEAR
1 E. Wijaya and P. Ariyani, "Pengaruh Service Marketing Mix terhadap Keputusan Nasabah
untuk Menabung Pada PT. Bank Mayapada Internasional TBK Cabang A.Yani
Pekanbaru", Journal of Economic, Bussines and Accounting (COSTING), vol. 1, no. 2, pp. 283-
296, 2018. Available: 10.31539/costing.v1i2.263.
Document Page
Running head: Accounting financial analysis report
OLD OLD
Fixed costs 260500
Contribution per unit 7.00
Break-even point in units 14886 11164 11164 37214
Break-even point ($) $
178,628.57 $ 200,957.14 $ 334,928.57
Question 3
A) & B)
Net
Presen
t value
Annual
cash
flows
Rate
of
Ret
urn
@5
%
Net Present
value
Cumulativ
e cash
flows
Rate
of
Ret
urn
@7
%
Net
Present
value
Cumulativ
e cash
flows
0 -156000
1.00
00
$
(156,000.00)
$
(156,000.0
0)
1.00
00
$
(156,000.0
0)
$
(156,000.0
0)
1 -35000
0.95
24
$
(33,333.33)
$
(191,000.0
0)
0.93
46
$
(32,710.28
)
$
(191,000.0
0)
2 62000
0.90
70
$
56,235.83
$
(129,000.0
0)
0.87
34
$
54,153.20
$
(129,000.0
0)
3 62000
0.86
38
$
53,557.93
$
(67,000.00
)
0.81
63
$
50,610.47
$
(67,000.00
)
4 57000
0.82
27
$
46,894.04
$
(10,000.00
)
0.76
29
$
43,485.03
$
(10,000.00
)
5 41900
0.78
35
$
32,829.75
$
31,900.00
0.71
30
$
29,874.12
$
31,900.00
6 68700
0.74
62
$
51,265.00
$
100,600.00
0.66
63
$
45,777.71
$
100,600.00
Net
Presen
t Value
$
51,449.21
$
35,190.25
Paybac
k
period 4.30 4.33
Document Page
Running head: Accounting financial analysis report
IRR 12%
C)
The net present value of the organization is determined to decide whether the project shall be
accepted or not or whether it is feasible or not. The net present value helps in analyzing the
parameters a project is made up of in order to make the management aware of all the future
possibilities and the returns the project is going to make. In the current scenario the net present
value is calculated with two major rates that is at 5% and at 7%. Under the cost of capital of 5%
the net present value is $51449 whereas the same under the rate 7% is $35190. This clearly
implies the inverse relationship with the cost of capital. The net present value tends to increase
when the cost of capital is reduced and the vice versa. Further the time value of money is also
one of the important elements that create the discounting factor at which the net present value is
calculated. The conclusion for the company is that the proposal shall be accepted on the basis of
the net present value of the business2.
D)
Payback period is one of the most important terms of the capital budgeting techniques that are
used by the company in order to have an understanding of the significant impact of the period in
which the company is able to recoup the costs of the investment. The payback period is the
period that is used to ascertain the position of the business. The payback period is calculated by
calculating the cumulative cash flows and the summation of them the years. The payback period
2 Srithongrung, "Capital Budgeting and Management Practices: Smoothing Out Rough Spots in
Government Outlays", Public Budgeting & Finance, vol. 38, no. 1, pp. 47-71, 2017. Available:
10.1111/pbaf.12167.
tabler-icon-diamond-filled.svg

Paraphrase This Document

Need a fresh take? Get an instant paraphrase of this document with our AI Paraphraser
Document Page
Running head: Accounting financial analysis report
as decided by the company is 2 years, whereas in case of the current situation the payback period
is extended to 4.30 days. The company is able to recoup the cost of the investment in 4 years
which is still acceptable and hence, the current proposal shall be accepted by the company3.
3 Srithongrung, "Capital Budgeting and Management Practices: Smoothing Out Rough Spots in
Government Outlays", Public Budgeting & Finance, vol. 38, no. 1, pp. 47-71, 2017. Available:
10.1111/pbaf.12167.
Document Page
Running head: Accounting financial analysis report
References
E. Wijaya and P. Ariyani, "Pengaruh Service Marketing Mix terhadap Keputusan Nasabah untuk
Menabung Pada PT. Bank Mayapada Internasional TBK Cabang A.Yani Pekanbaru", Journal of
Economic, Bussines and Accounting (COSTING), vol. 1, no. 2, pp. 283-296, 2018. Available:
10.31539/costing.v1i2.263.
Srithongrung, "Capital Budgeting and Management Practices: Smoothing Out Rough Spots in
Government Outlays", Public Budgeting & Finance, vol. 38, no. 1, pp. 47-71, 2017. Available:
10.1111/pbaf.12167.
chevron_up_icon
1 out of 9
circle_padding
hide_on_mobile
zoom_out_icon
logo.png

Your All-in-One AI-Powered Toolkit for Academic Success.

Available 24*7 on WhatsApp / Email

[object Object]