Financial Analysis Report
VerifiedAdded on 2020/02/18
|27
|4104
|205
Report
AI Summary
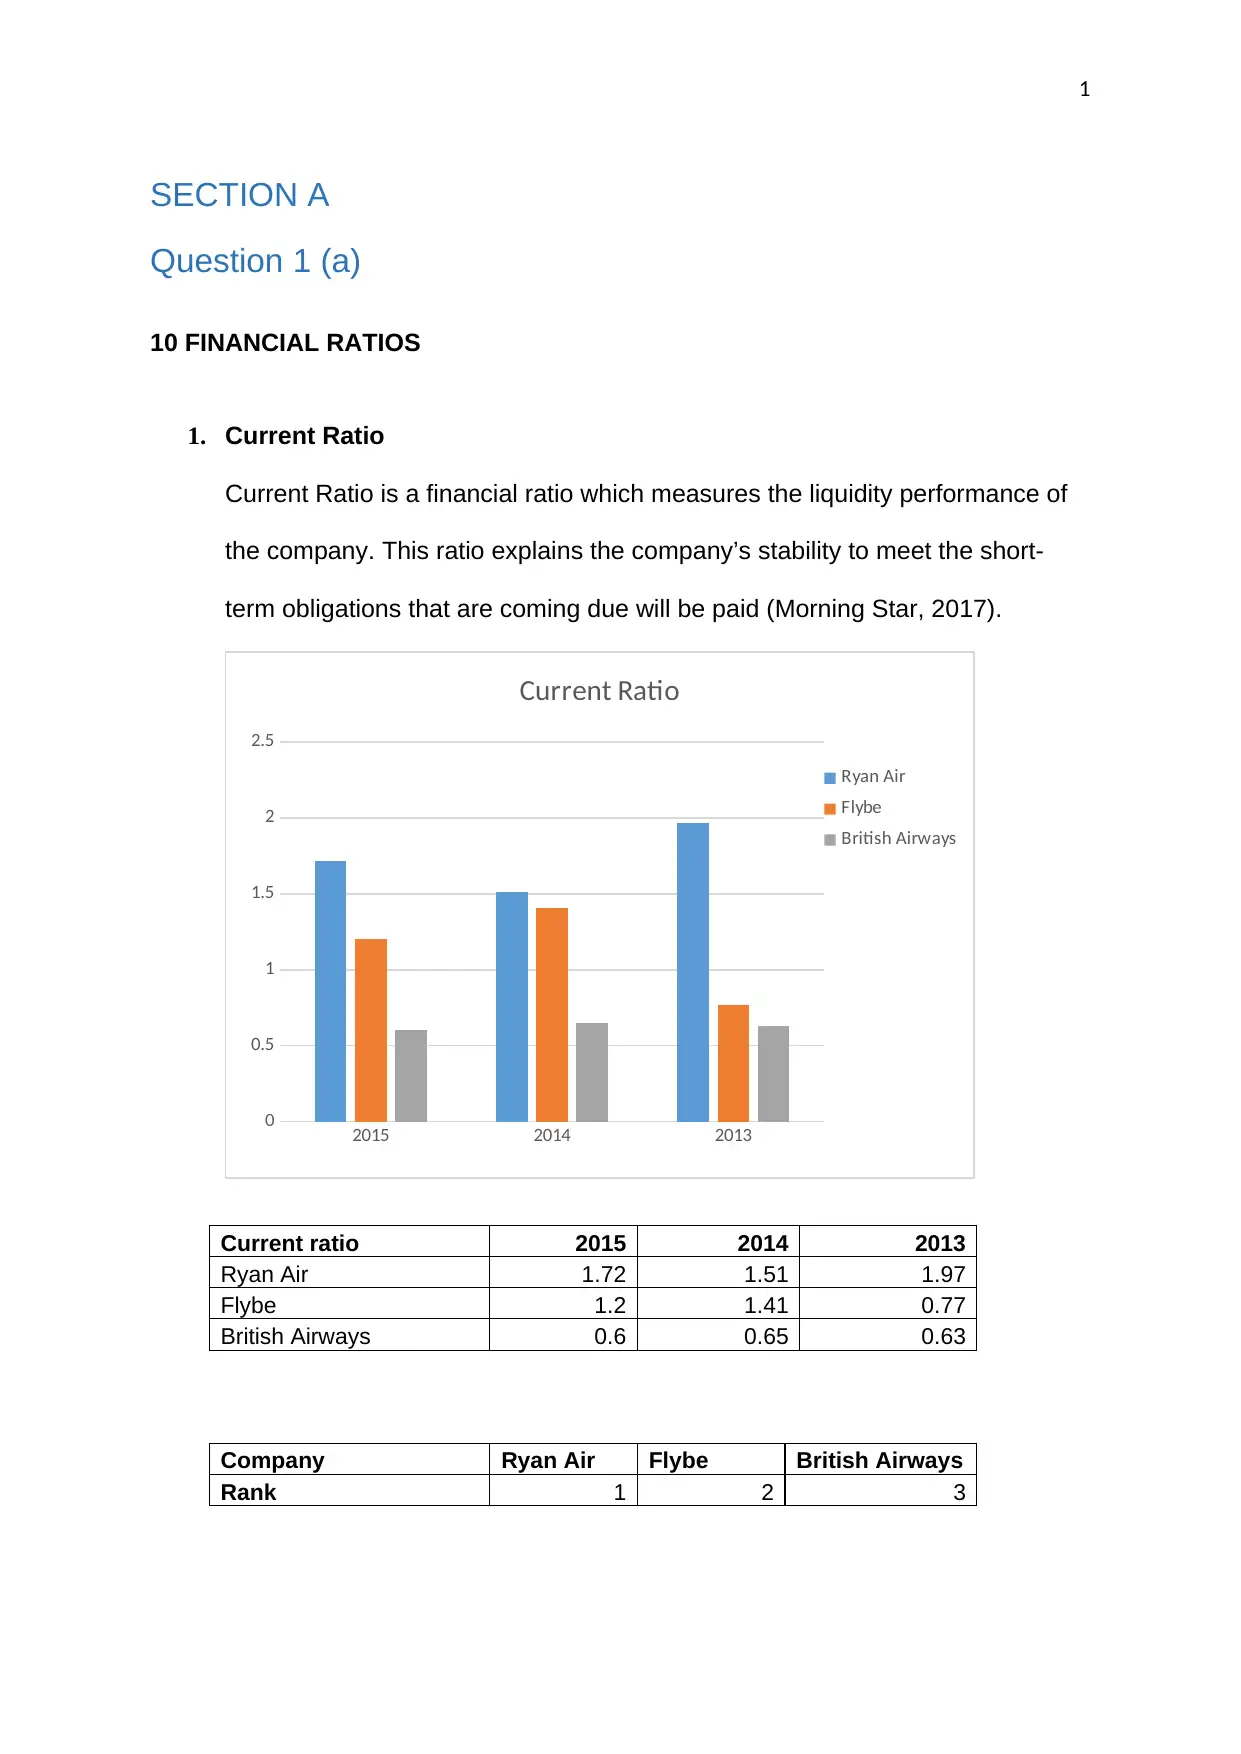
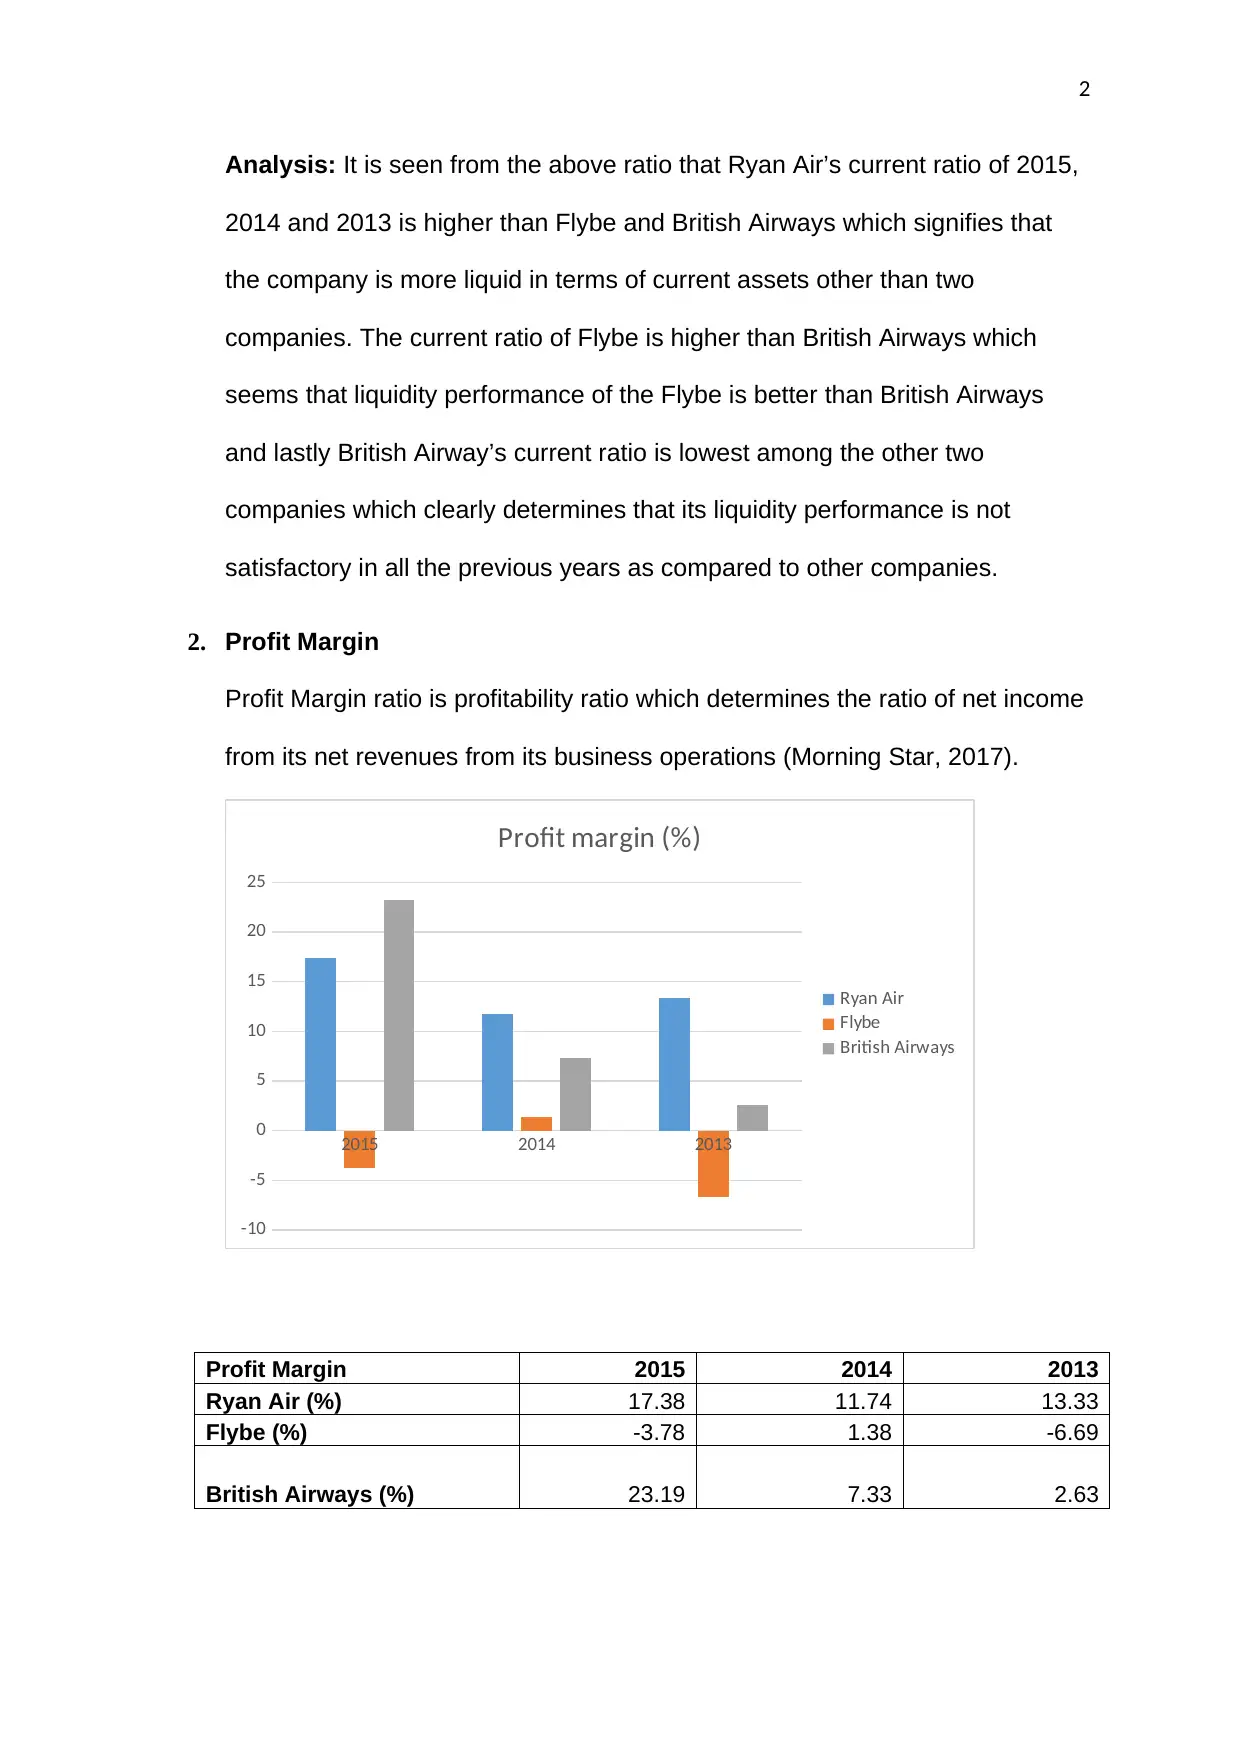
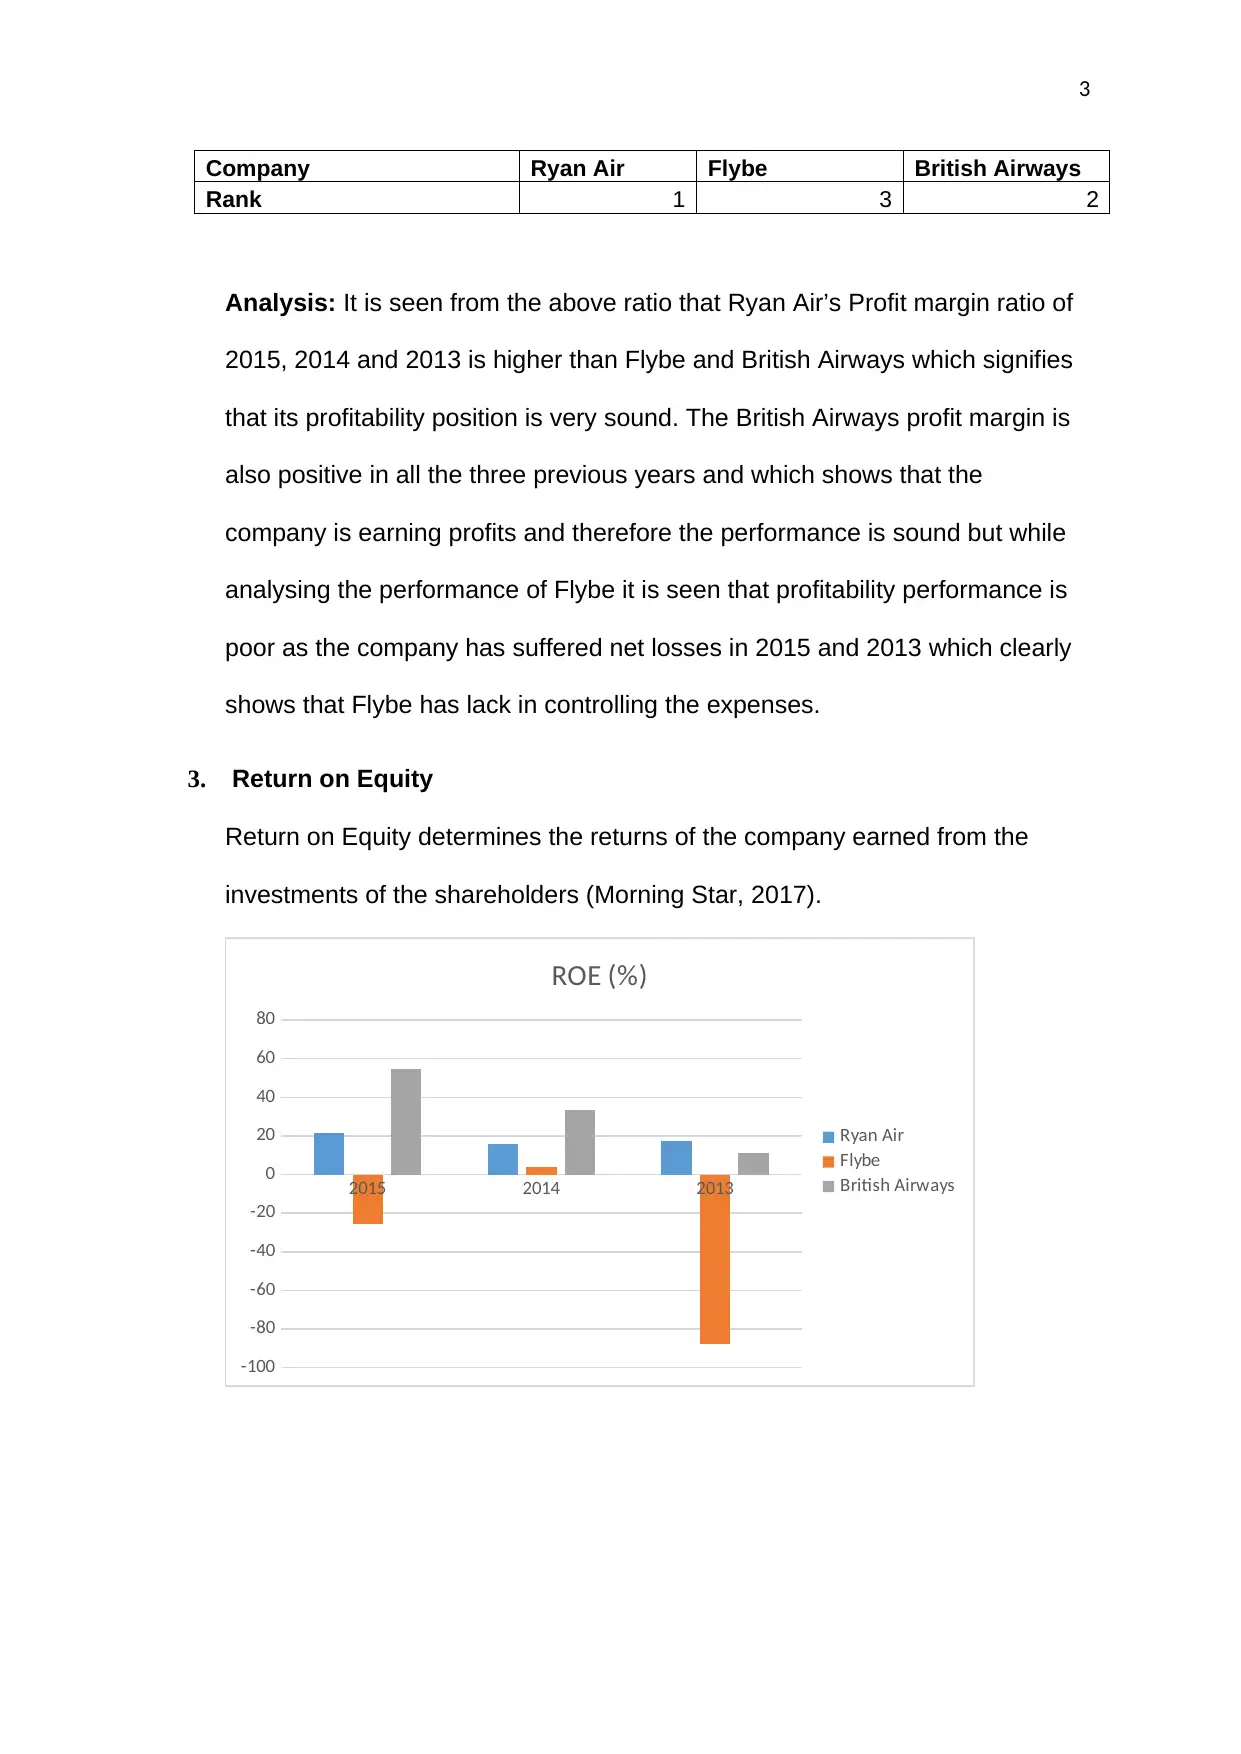
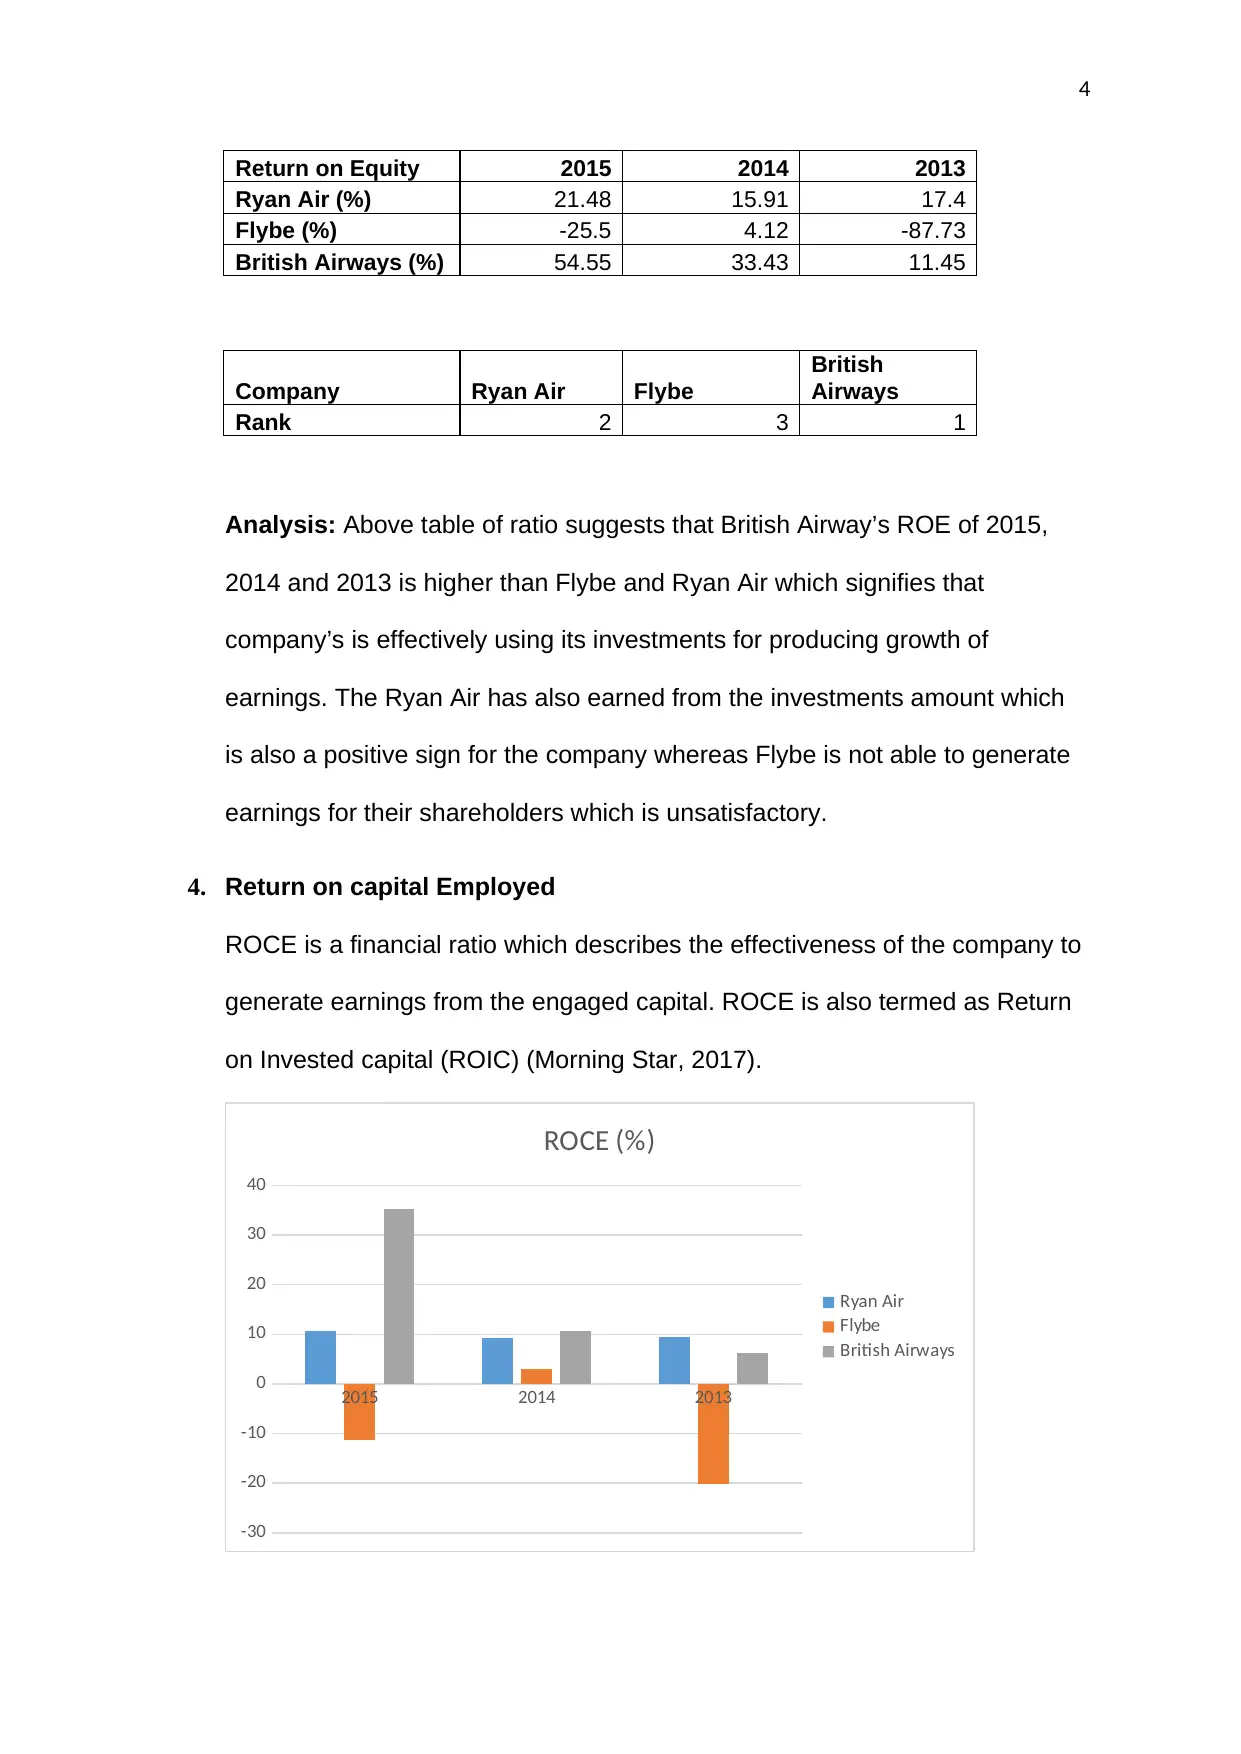
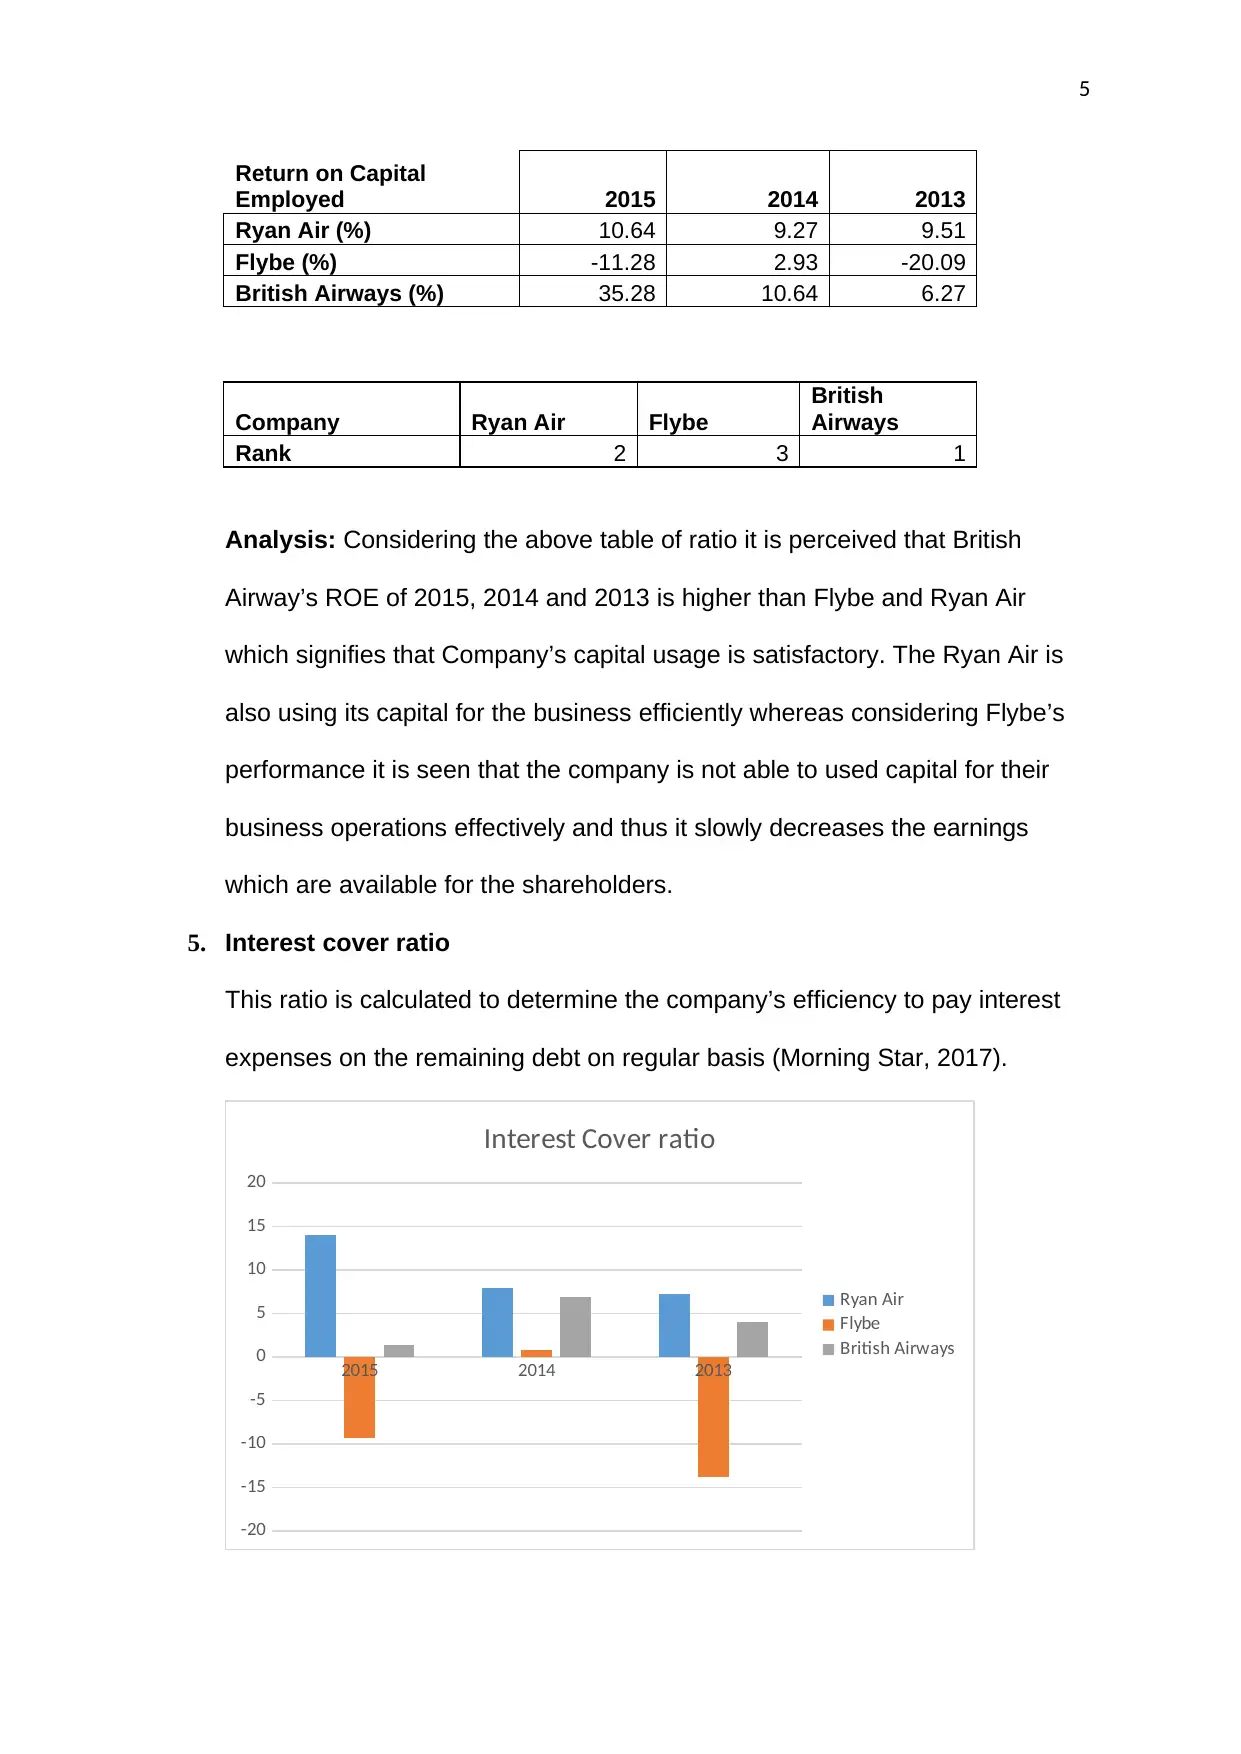
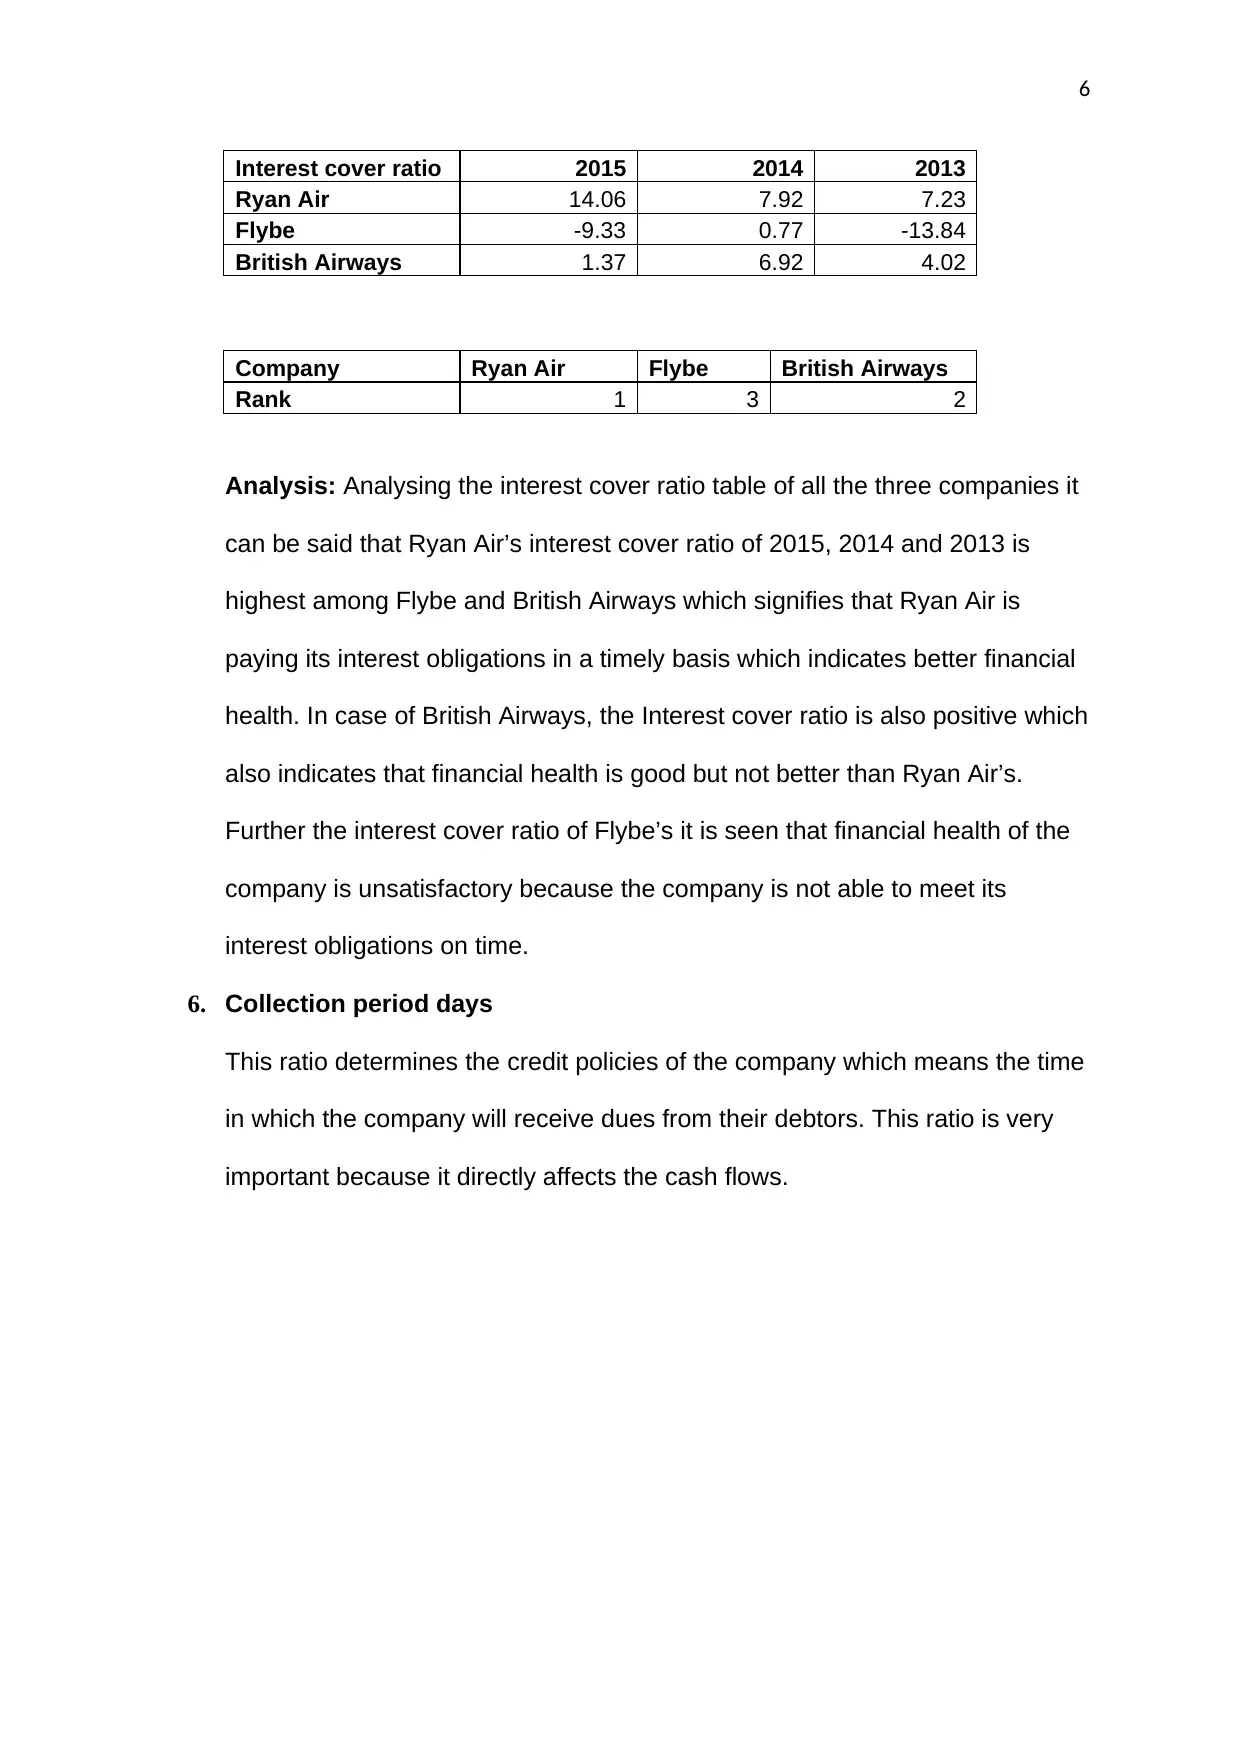
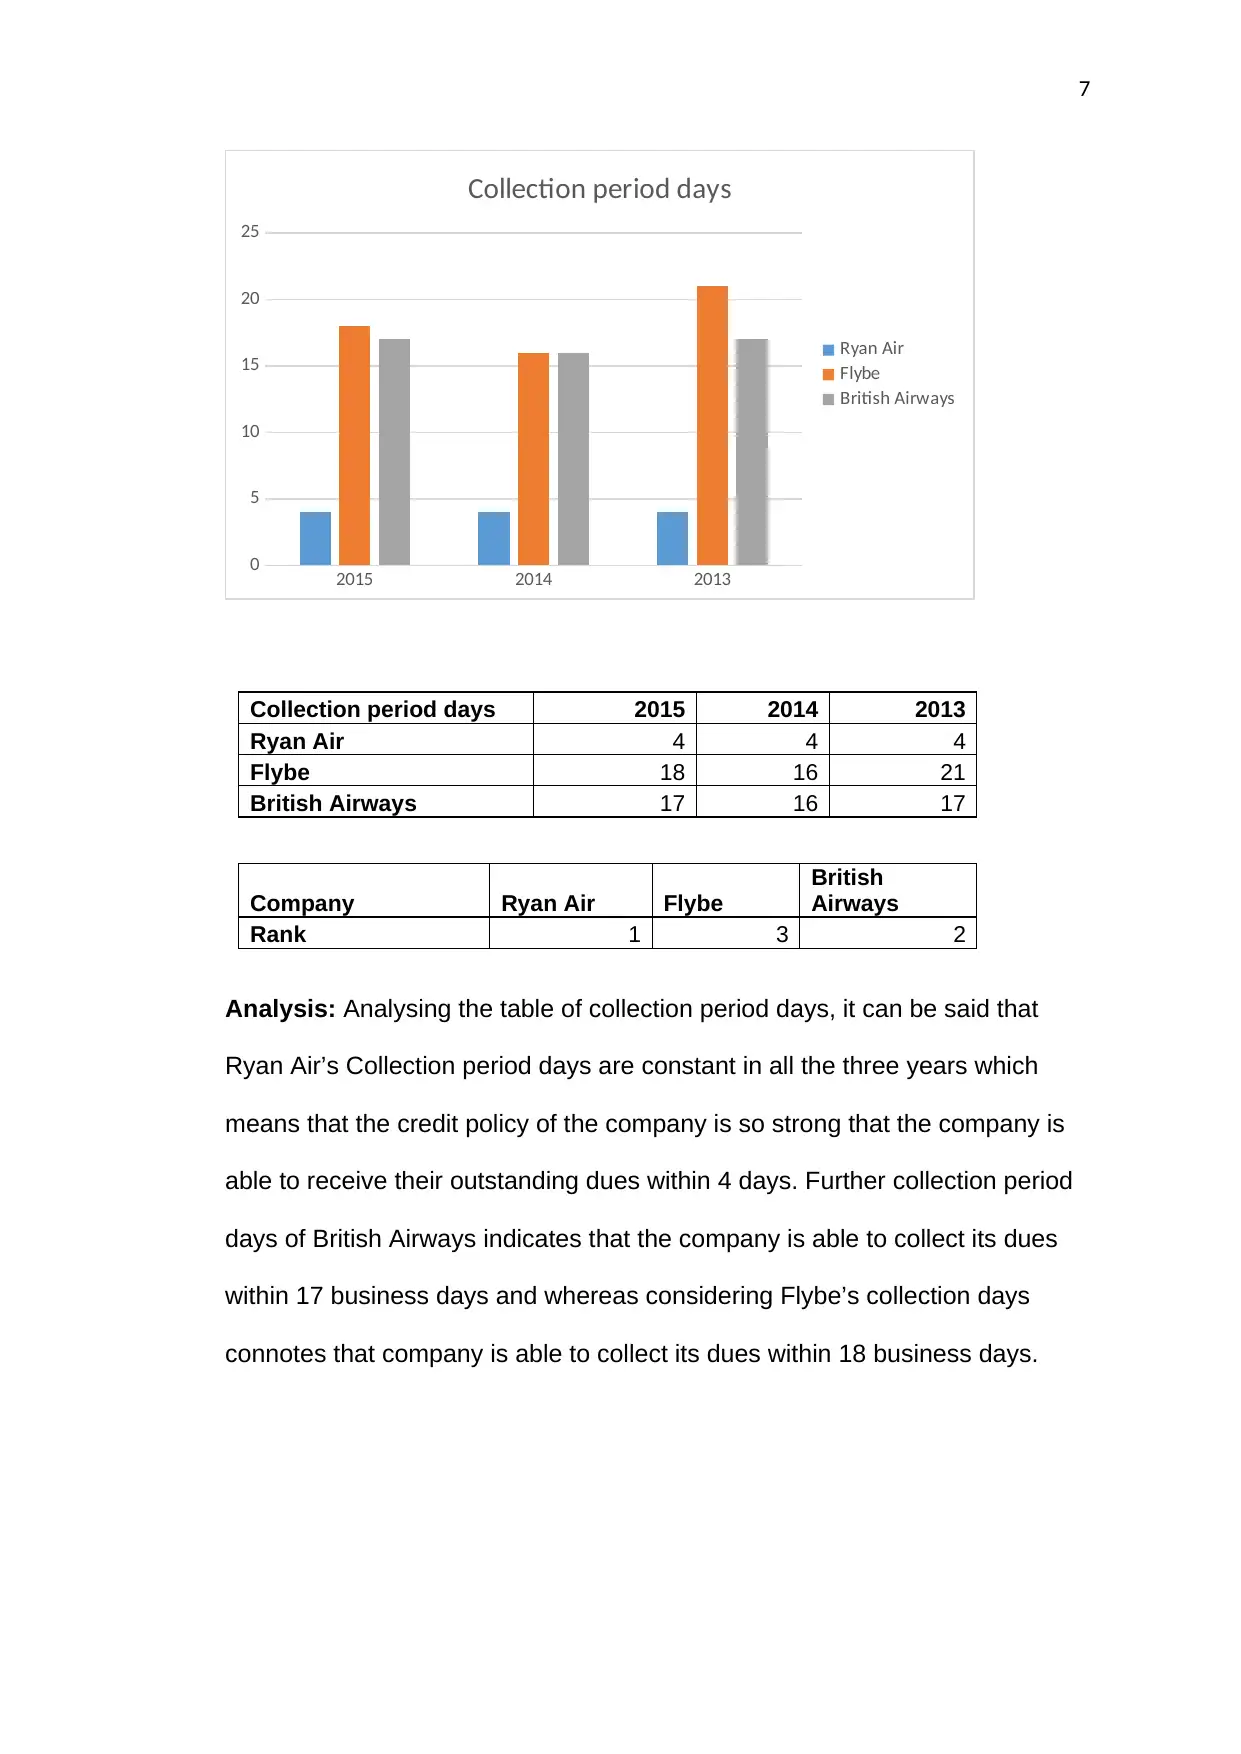
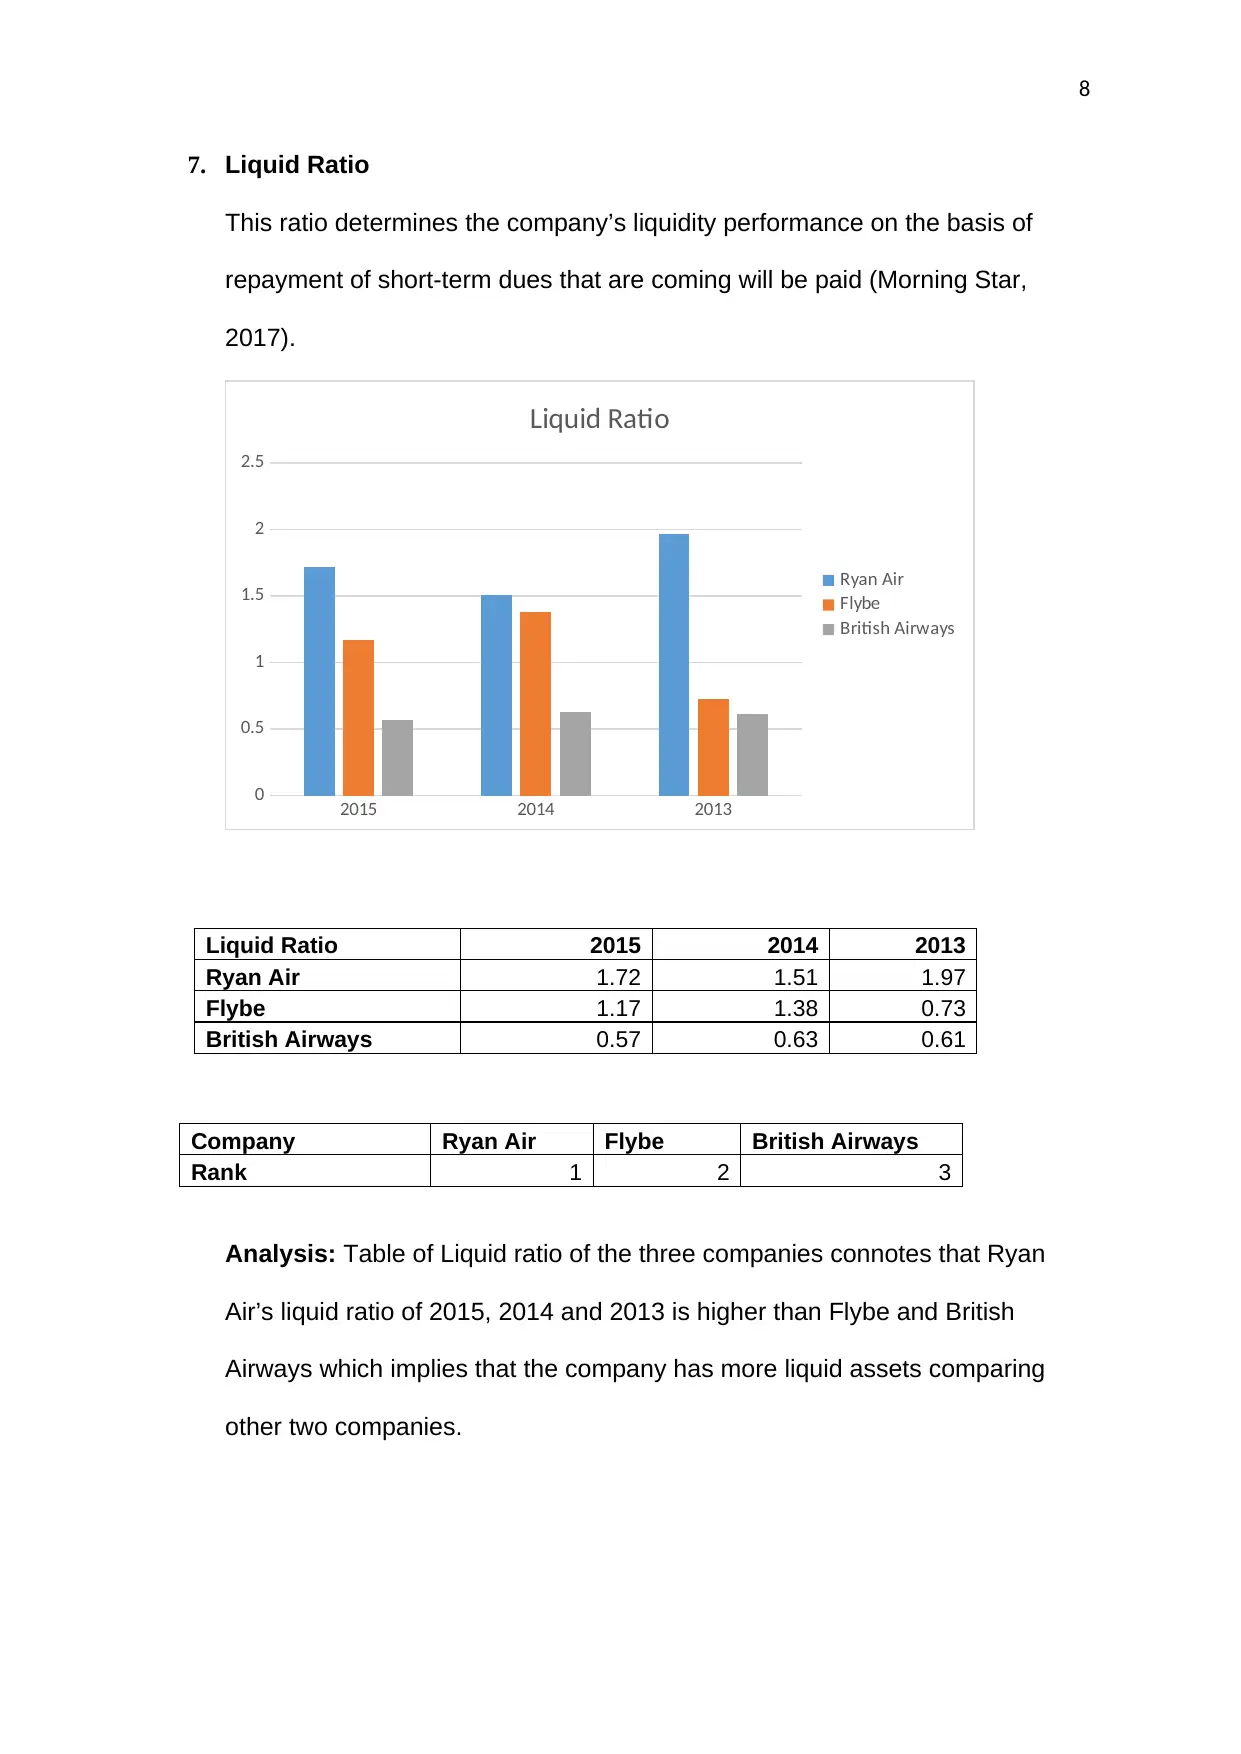
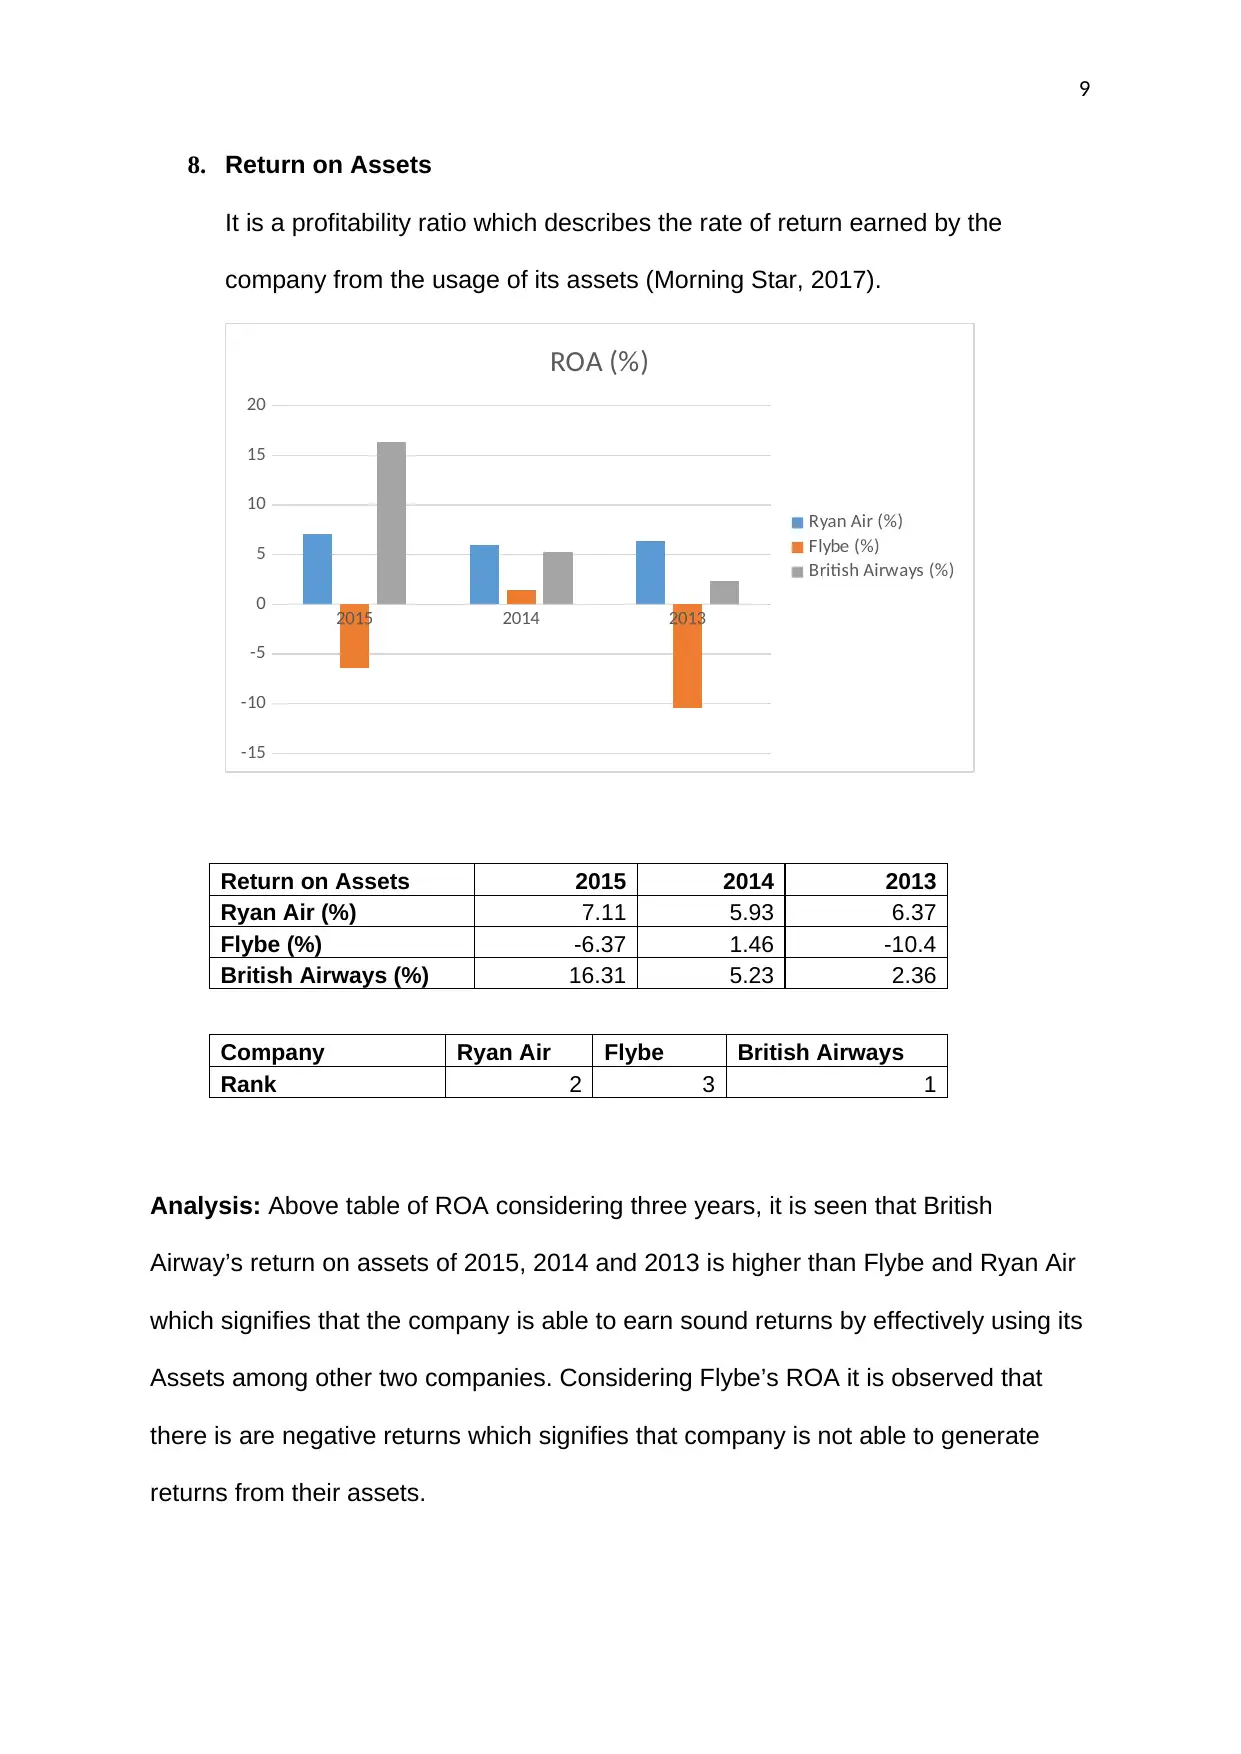
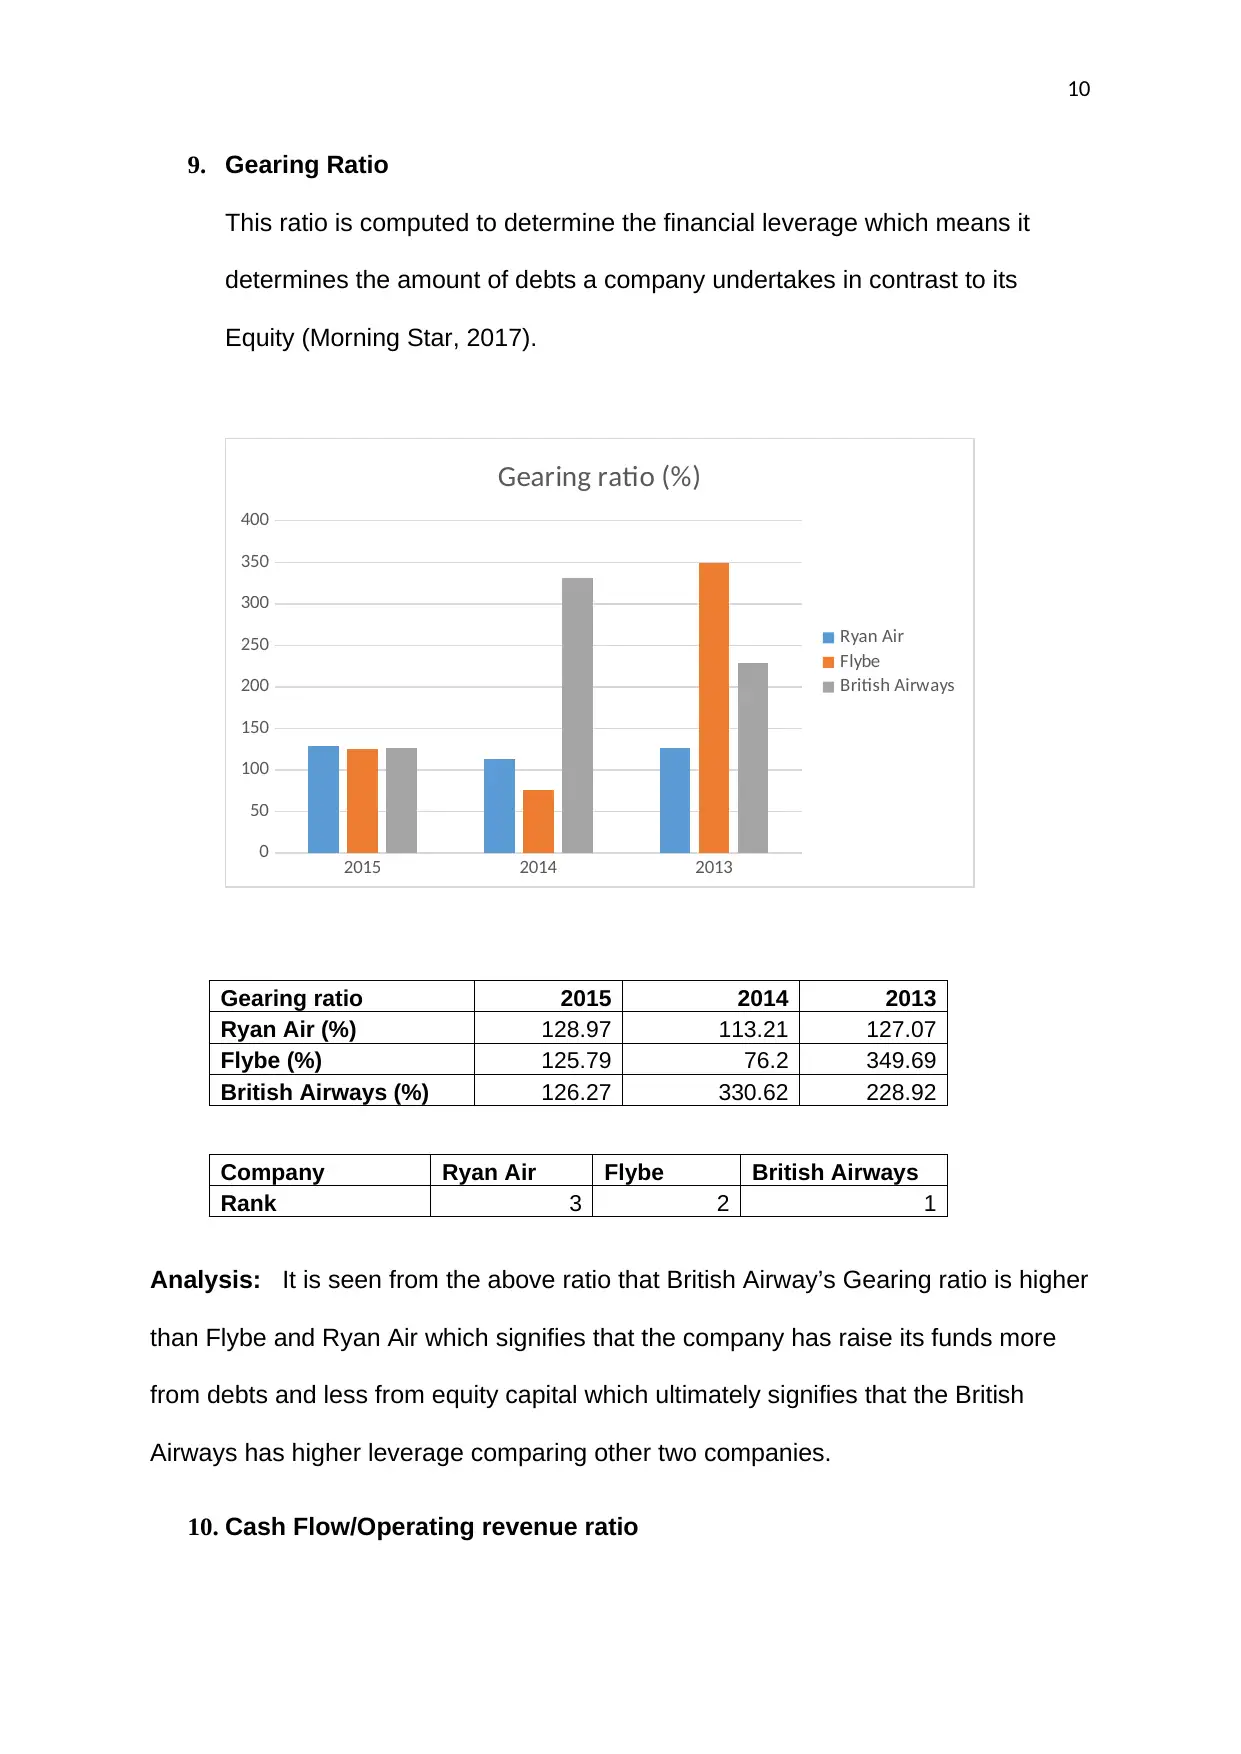
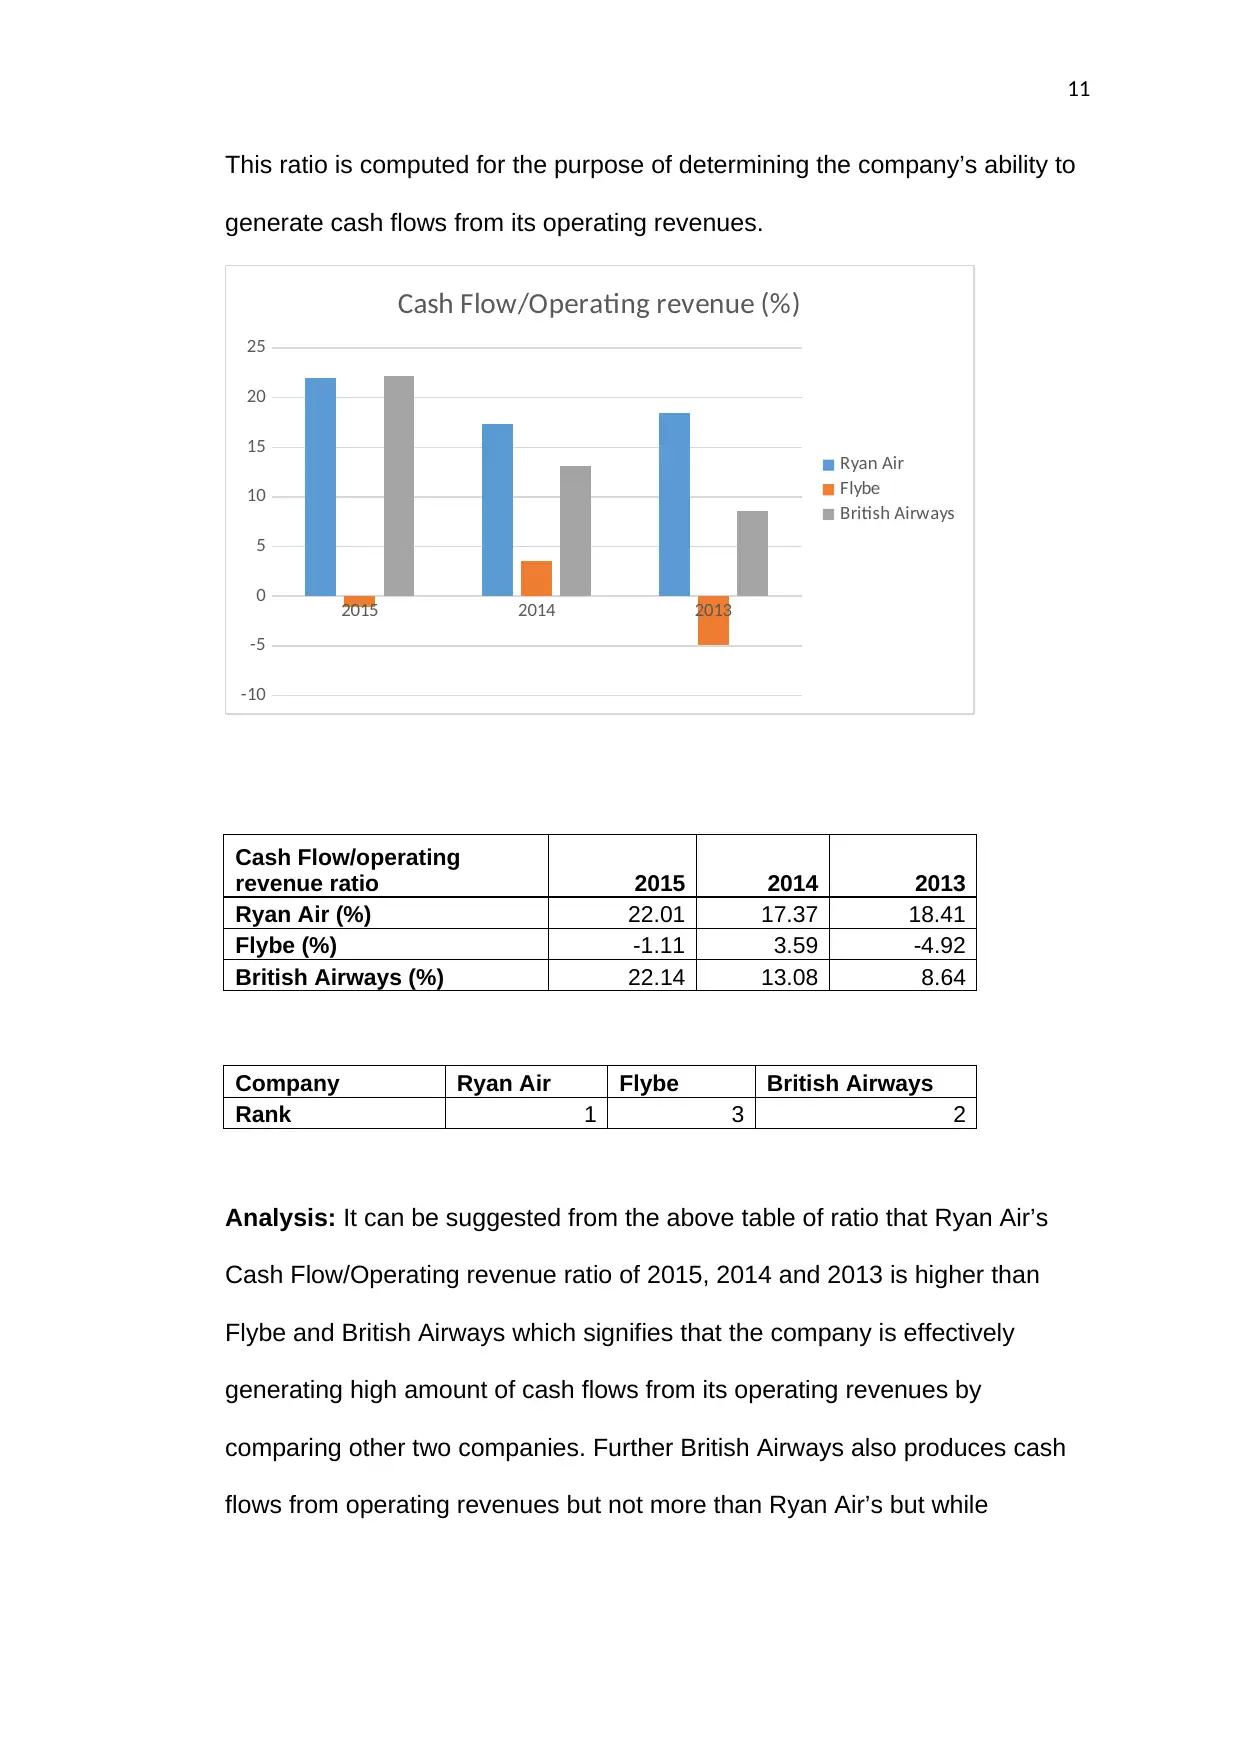
This report provides a comprehensive financial analysis of three airline companies: Ryanair, Flybe, and British Airways. The analysis utilizes various financial ratios, including liquidity ratios (current ratio, liquid ratio), profitability ratios (profit margin, return on equity, return on assets, return on capital employed), and solvency ratios (interest cover ratio, gearing ratio), along with non-financial ratios such as the number of employees and profit per employee. The report ranks the performance of these companies based on these ratios over a three-year period (2013-2015). Furthermore, the report includes an investment appraisal of two hypothetical projects (Project A and Project B) for UNO Bus Ltd, using methods such as payback period, discounted payback period, accounting rate of return, net present value (NPV), and internal rate of return (IRR). The analysis concludes with recommendations for improving Flybe's financial performance and discusses limitations of ratio analysis.

ACCOUNTING financial analysis report
Paraphrase This Document
Need a fresh take? Get an instant paraphrase of this document with our AI Paraphraser

1
SECTION A
Question 1 (a)
10 FINANCIAL RATIOS
1. Current Ratio
Current Ratio is a financial ratio which measures the liquidity performance of
the company. This ratio explains the company’s stability to meet the short-
term obligations that are coming due will be paid (Morning Star, 2017).
2015 2014 2013
0
0.5
1
1.5
2
2.5
Current Ratio
Ryan Air
Flybe
British Airways
Current ratio 2015 2014 2013
Ryan Air 1.72 1.51 1.97
Flybe 1.2 1.41 0.77
British Airways 0.6 0.65 0.63
Company Ryan Air Flybe British Airways
Rank 1 2 3

2
Analysis: It is seen from the above ratio that Ryan Air’s current ratio of 2015,
2014 and 2013 is higher than Flybe and British Airways which signifies that
the company is more liquid in terms of current assets other than two
companies. The current ratio of Flybe is higher than British Airways which
seems that liquidity performance of the Flybe is better than British Airways
and lastly British Airway’s current ratio is lowest among the other two
companies which clearly determines that its liquidity performance is not
satisfactory in all the previous years as compared to other companies.
2. Profit Margin
Profit Margin ratio is profitability ratio which determines the ratio of net income
from its net revenues from its business operations (Morning Star, 2017).
2015 2014 2013
-10
-5
0
5
10
15
20
25
Profit margin (%)
Ryan Air
Flybe
British Airways
Profit Margin 2015 2014 2013
Ryan Air (%) 17.38 11.74 13.33
Flybe (%) -3.78 1.38 -6.69
British Airways (%) 23.19 7.33 2.63
⊘ This is a preview!⊘
Do you want full access?
Subscribe today to unlock all pages.

Trusted by 1+ million students worldwide

3
Company Ryan Air Flybe British Airways
Rank 1 3 2
Analysis: It is seen from the above ratio that Ryan Air’s Profit margin ratio of
2015, 2014 and 2013 is higher than Flybe and British Airways which signifies
that its profitability position is very sound. The British Airways profit margin is
also positive in all the three previous years and which shows that the
company is earning profits and therefore the performance is sound but while
analysing the performance of Flybe it is seen that profitability performance is
poor as the company has suffered net losses in 2015 and 2013 which clearly
shows that Flybe has lack in controlling the expenses.
3. Return on Equity
Return on Equity determines the returns of the company earned from the
investments of the shareholders (Morning Star, 2017).
2015 2014 2013
-100
-80
-60
-40
-20
0
20
40
60
80
ROE (%)
Ryan Air
Flybe
British Airways
Paraphrase This Document
Need a fresh take? Get an instant paraphrase of this document with our AI Paraphraser

4
Return on Equity 2015 2014 2013
Ryan Air (%) 21.48 15.91 17.4
Flybe (%) -25.5 4.12 -87.73
British Airways (%) 54.55 33.43 11.45
Company Ryan Air Flybe
British
Airways
Rank 2 3 1
Analysis: Above table of ratio suggests that British Airway’s ROE of 2015,
2014 and 2013 is higher than Flybe and Ryan Air which signifies that
company’s is effectively using its investments for producing growth of
earnings. The Ryan Air has also earned from the investments amount which
is also a positive sign for the company whereas Flybe is not able to generate
earnings for their shareholders which is unsatisfactory.
4. Return on capital Employed
ROCE is a financial ratio which describes the effectiveness of the company to
generate earnings from the engaged capital. ROCE is also termed as Return
on Invested capital (ROIC) (Morning Star, 2017).
2015 2014 2013
-30
-20
-10
0
10
20
30
40
ROCE (%)
Ryan Air
Flybe
British Airways

5
Return on Capital
Employed 2015 2014 2013
Ryan Air (%) 10.64 9.27 9.51
Flybe (%) -11.28 2.93 -20.09
British Airways (%) 35.28 10.64 6.27
Company Ryan Air Flybe
British
Airways
Rank 2 3 1
Analysis: Considering the above table of ratio it is perceived that British
Airway’s ROE of 2015, 2014 and 2013 is higher than Flybe and Ryan Air
which signifies that Company’s capital usage is satisfactory. The Ryan Air is
also using its capital for the business efficiently whereas considering Flybe’s
performance it is seen that the company is not able to used capital for their
business operations effectively and thus it slowly decreases the earnings
which are available for the shareholders.
5. Interest cover ratio
This ratio is calculated to determine the company’s efficiency to pay interest
expenses on the remaining debt on regular basis (Morning Star, 2017).
2015 2014 2013
-20
-15
-10
-5
0
5
10
15
20
Interest Cover ratio
Ryan Air
Flybe
British Airways
⊘ This is a preview!⊘
Do you want full access?
Subscribe today to unlock all pages.

Trusted by 1+ million students worldwide

6
Interest cover ratio 2015 2014 2013
Ryan Air 14.06 7.92 7.23
Flybe -9.33 0.77 -13.84
British Airways 1.37 6.92 4.02
Company Ryan Air Flybe British Airways
Rank 1 3 2
Analysis: Analysing the interest cover ratio table of all the three companies it
can be said that Ryan Air’s interest cover ratio of 2015, 2014 and 2013 is
highest among Flybe and British Airways which signifies that Ryan Air is
paying its interest obligations in a timely basis which indicates better financial
health. In case of British Airways, the Interest cover ratio is also positive which
also indicates that financial health is good but not better than Ryan Air’s.
Further the interest cover ratio of Flybe’s it is seen that financial health of the
company is unsatisfactory because the company is not able to meet its
interest obligations on time.
6. Collection period days
This ratio determines the credit policies of the company which means the time
in which the company will receive dues from their debtors. This ratio is very
important because it directly affects the cash flows.
Paraphrase This Document
Need a fresh take? Get an instant paraphrase of this document with our AI Paraphraser

7
2015 2014 2013
0
5
10
15
20
25
Collection period days
Ryan Air
Flybe
British Airways
Collection period days 2015 2014 2013
Ryan Air 4 4 4
Flybe 18 16 21
British Airways 17 16 17
Company Ryan Air Flybe
British
Airways
Rank 1 3 2
Analysis: Analysing the table of collection period days, it can be said that
Ryan Air’s Collection period days are constant in all the three years which
means that the credit policy of the company is so strong that the company is
able to receive their outstanding dues within 4 days. Further collection period
days of British Airways indicates that the company is able to collect its dues
within 17 business days and whereas considering Flybe’s collection days
connotes that company is able to collect its dues within 18 business days.

8
7. Liquid Ratio
This ratio determines the company’s liquidity performance on the basis of
repayment of short-term dues that are coming will be paid (Morning Star,
2017).
2015 2014 2013
0
0.5
1
1.5
2
2.5
Liquid Ratio
Ryan Air
Flybe
British Airways
Liquid Ratio 2015 2014 2013
Ryan Air 1.72 1.51 1.97
Flybe 1.17 1.38 0.73
British Airways 0.57 0.63 0.61
Company Ryan Air Flybe British Airways
Rank 1 2 3
Analysis: Table of Liquid ratio of the three companies connotes that Ryan
Air’s liquid ratio of 2015, 2014 and 2013 is higher than Flybe and British
Airways which implies that the company has more liquid assets comparing
other two companies.
⊘ This is a preview!⊘
Do you want full access?
Subscribe today to unlock all pages.

Trusted by 1+ million students worldwide

9
8. Return on Assets
It is a profitability ratio which describes the rate of return earned by the
company from the usage of its assets (Morning Star, 2017).
2015 2014 2013
-15
-10
-5
0
5
10
15
20
ROA (%)
Ryan Air (%)
Flybe (%)
British Airways (%)
Return on Assets 2015 2014 2013
Ryan Air (%) 7.11 5.93 6.37
Flybe (%) -6.37 1.46 -10.4
British Airways (%) 16.31 5.23 2.36
Company Ryan Air Flybe British Airways
Rank 2 3 1
Analysis: Above table of ROA considering three years, it is seen that British
Airway’s return on assets of 2015, 2014 and 2013 is higher than Flybe and Ryan Air
which signifies that the company is able to earn sound returns by effectively using its
Assets among other two companies. Considering Flybe’s ROA it is observed that
there is are negative returns which signifies that company is not able to generate
returns from their assets.
Paraphrase This Document
Need a fresh take? Get an instant paraphrase of this document with our AI Paraphraser

10
9. Gearing Ratio
This ratio is computed to determine the financial leverage which means it
determines the amount of debts a company undertakes in contrast to its
Equity (Morning Star, 2017).
2015 2014 2013
0
50
100
150
200
250
300
350
400
Gearing ratio (%)
Ryan Air
Flybe
British Airways
Gearing ratio 2015 2014 2013
Ryan Air (%) 128.97 113.21 127.07
Flybe (%) 125.79 76.2 349.69
British Airways (%) 126.27 330.62 228.92
Company Ryan Air Flybe British Airways
Rank 3 2 1
Analysis: It is seen from the above ratio that British Airway’s Gearing ratio is higher
than Flybe and Ryan Air which signifies that the company has raise its funds more
from debts and less from equity capital which ultimately signifies that the British
Airways has higher leverage comparing other two companies.
10. Cash Flow/Operating revenue ratio

11
This ratio is computed for the purpose of determining the company’s ability to
generate cash flows from its operating revenues.
2015 2014 2013
-10
-5
0
5
10
15
20
25
Cash Flow/Operating revenue (%)
Ryan Air
Flybe
British Airways
Cash Flow/operating
revenue ratio 2015 2014 2013
Ryan Air (%) 22.01 17.37 18.41
Flybe (%) -1.11 3.59 -4.92
British Airways (%) 22.14 13.08 8.64
Company Ryan Air Flybe British Airways
Rank 1 3 2
Analysis: It can be suggested from the above table of ratio that Ryan Air’s
Cash Flow/Operating revenue ratio of 2015, 2014 and 2013 is higher than
Flybe and British Airways which signifies that the company is effectively
generating high amount of cash flows from its operating revenues by
comparing other two companies. Further British Airways also produces cash
flows from operating revenues but not more than Ryan Air’s but while
⊘ This is a preview!⊘
Do you want full access?
Subscribe today to unlock all pages.

Trusted by 1+ million students worldwide
1 out of 27
Related Documents

Your All-in-One AI-Powered Toolkit for Academic Success.
+13062052269
info@desklib.com
Available 24*7 on WhatsApp / Email
Unlock your academic potential
Copyright © 2020–2025 A2Z Services. All Rights Reserved. Developed and managed by ZUCOL.