Financial Performance Analysis Report: Royal Mail Plc (2013-2015)
VerifiedAdded on 2020/01/23
|19
|5462
|61
Report
AI Summary
This report provides a comprehensive financial performance analysis of Royal Mail Plc for the years 2013, 2014, and 2015. The analysis includes an examination of the company's profitability, liquidity, efficiency, and gearing ratios, providing insights into its financial health and operational effectiveness. The report uses ratio analysis to assess trends and identify areas of strength and weakness. Furthermore, the assignment delves into investment appraisal techniques, such as payback period, discounted payback period, and net present value, to evaluate the viability of potential projects. The report concludes with recommendations for improving financial performance. The financial statements and vertical and horizontal trend analysis are also incorporated. The analysis is presented from the perspective of an accountant reporting to the Board of Directors. The document is a past paper and solved assignment contributed by a student and published on Desklib.

FINANCE
Paraphrase This Document
Need a fresh take? Get an instant paraphrase of this document with our AI Paraphraser
Table of Contents
INTRODUCTION......................................................................................................................3
TASK 1......................................................................................................................................3
Financial performance analysis.............................................................................................3
QUESTION 2.............................................................................................................................9
a) Highlands Wind Farm.......................................................................................................9
b) Outsourcing production of bolts......................................................................................12
QUESTION 3...........................................................................................................................14
Balanced scorecards............................................................................................................14
CONCLUSION........................................................................................................................16
REFERENCES.........................................................................................................................17
TASK 1
To: Board of Director of Royal Mail Plc
From: Royal Mail Plc's accountant
Date: 21st April, 2016
Subject: Analysis of company performance for the consecutive three years 2013, 2014
and 2015
Introduction
Royal mail plc is UK postal service company which was established in the year 1516.
It provides mail collection and delivery services to the large number of consumers throughout
UK. Financial performance of Royal Mail Plc's has been analysed and attached here with the
present report.
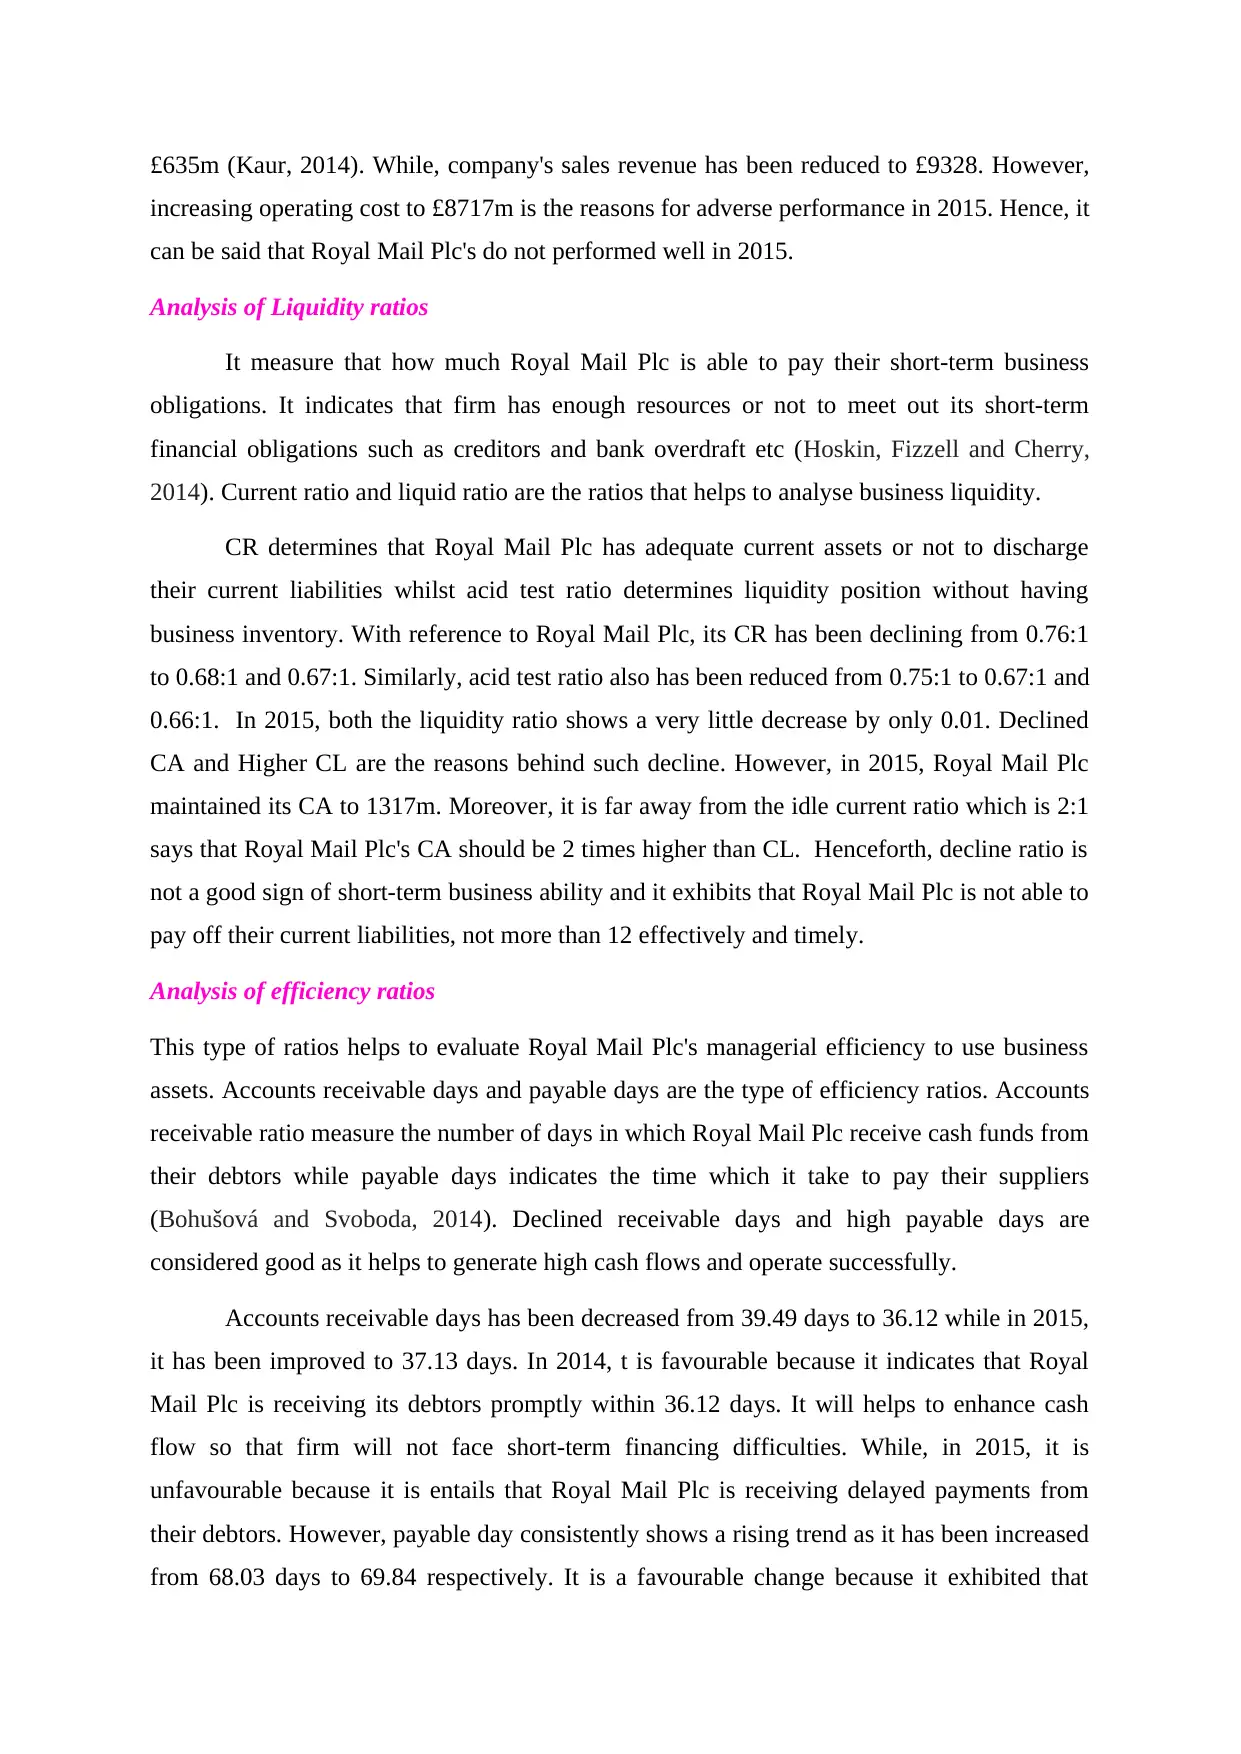
Financial performance analysis
Consolidated financial statements represent Royal Mail Plc's financial performance
for the respective financial years. Income statement summarized all the revenues and
expenditures helps to determine profitability while balance sheet combines all the assets as
well as liabilities shows financial position (Islam, Alam and Hossain, 2014). Ratio analysis is
an effective way to analyse each and every aspects of company's performance such as
profitability, liquidity, efficiency and gearing ratio, described below:
Analysis of Profitability ratios
Royal Mail Plc is a profit making organization who aims at maximizing profits
through its daily operations. It is the excess or surplus of firm's revenues over its total
expenses. It measure Royal Mail Plc's profit generating ability through its market operations
(Hasani, and Fathi, 2012). Increasing trend is considered good as it indicates that business is
performing well continuously while declining trend is a negative sign of business
performance. ROE, ROA, operating profit margin and assets turnover ratio are the type of
profitability ratios.
From the ratio analysis, it can be seen that in 2014, ROCE, ROA and operating
margin ratio has been improved to 38.30%, 30.35% and 7.15%. It is because of higher
turnover, high PBIT and high operating profit to £9357m, £1662m and £669m. It indicates
that Royal Mail plc performed well in 2014. On contrary to this, in 2015, ROCE, ROA and
operating profit has been significantly reduced to 12.35%, 8.64% and 6.84%. Huge decrease
in profitability has been caused because of lower PBIT and operating profit to £399m and
To: Board of Director of Royal Mail Plc
From: Royal Mail Plc's accountant
Date: 21st April, 2016
Subject: Analysis of company performance for the consecutive three years 2013, 2014
and 2015
Introduction
Royal mail plc is UK postal service company which was established in the year 1516.
It provides mail collection and delivery services to the large number of consumers throughout
UK. Financial performance of Royal Mail Plc's has been analysed and attached here with the
present report.
Financial performance analysis
Consolidated financial statements represent Royal Mail Plc's financial performance
for the respective financial years. Income statement summarized all the revenues and
expenditures helps to determine profitability while balance sheet combines all the assets as
well as liabilities shows financial position (Islam, Alam and Hossain, 2014). Ratio analysis is
an effective way to analyse each and every aspects of company's performance such as
profitability, liquidity, efficiency and gearing ratio, described below:
Analysis of Profitability ratios
Royal Mail Plc is a profit making organization who aims at maximizing profits
through its daily operations. It is the excess or surplus of firm's revenues over its total
expenses. It measure Royal Mail Plc's profit generating ability through its market operations
(Hasani, and Fathi, 2012). Increasing trend is considered good as it indicates that business is
performing well continuously while declining trend is a negative sign of business
performance. ROE, ROA, operating profit margin and assets turnover ratio are the type of
profitability ratios.
From the ratio analysis, it can be seen that in 2014, ROCE, ROA and operating
margin ratio has been improved to 38.30%, 30.35% and 7.15%. It is because of higher
turnover, high PBIT and high operating profit to £9357m, £1662m and £669m. It indicates
that Royal Mail plc performed well in 2014. On contrary to this, in 2015, ROCE, ROA and
operating profit has been significantly reduced to 12.35%, 8.64% and 6.84%. Huge decrease
in profitability has been caused because of lower PBIT and operating profit to £399m and
⊘ This is a preview!⊘
Do you want full access?
Subscribe today to unlock all pages.
Trusted by 1+ million students worldwide
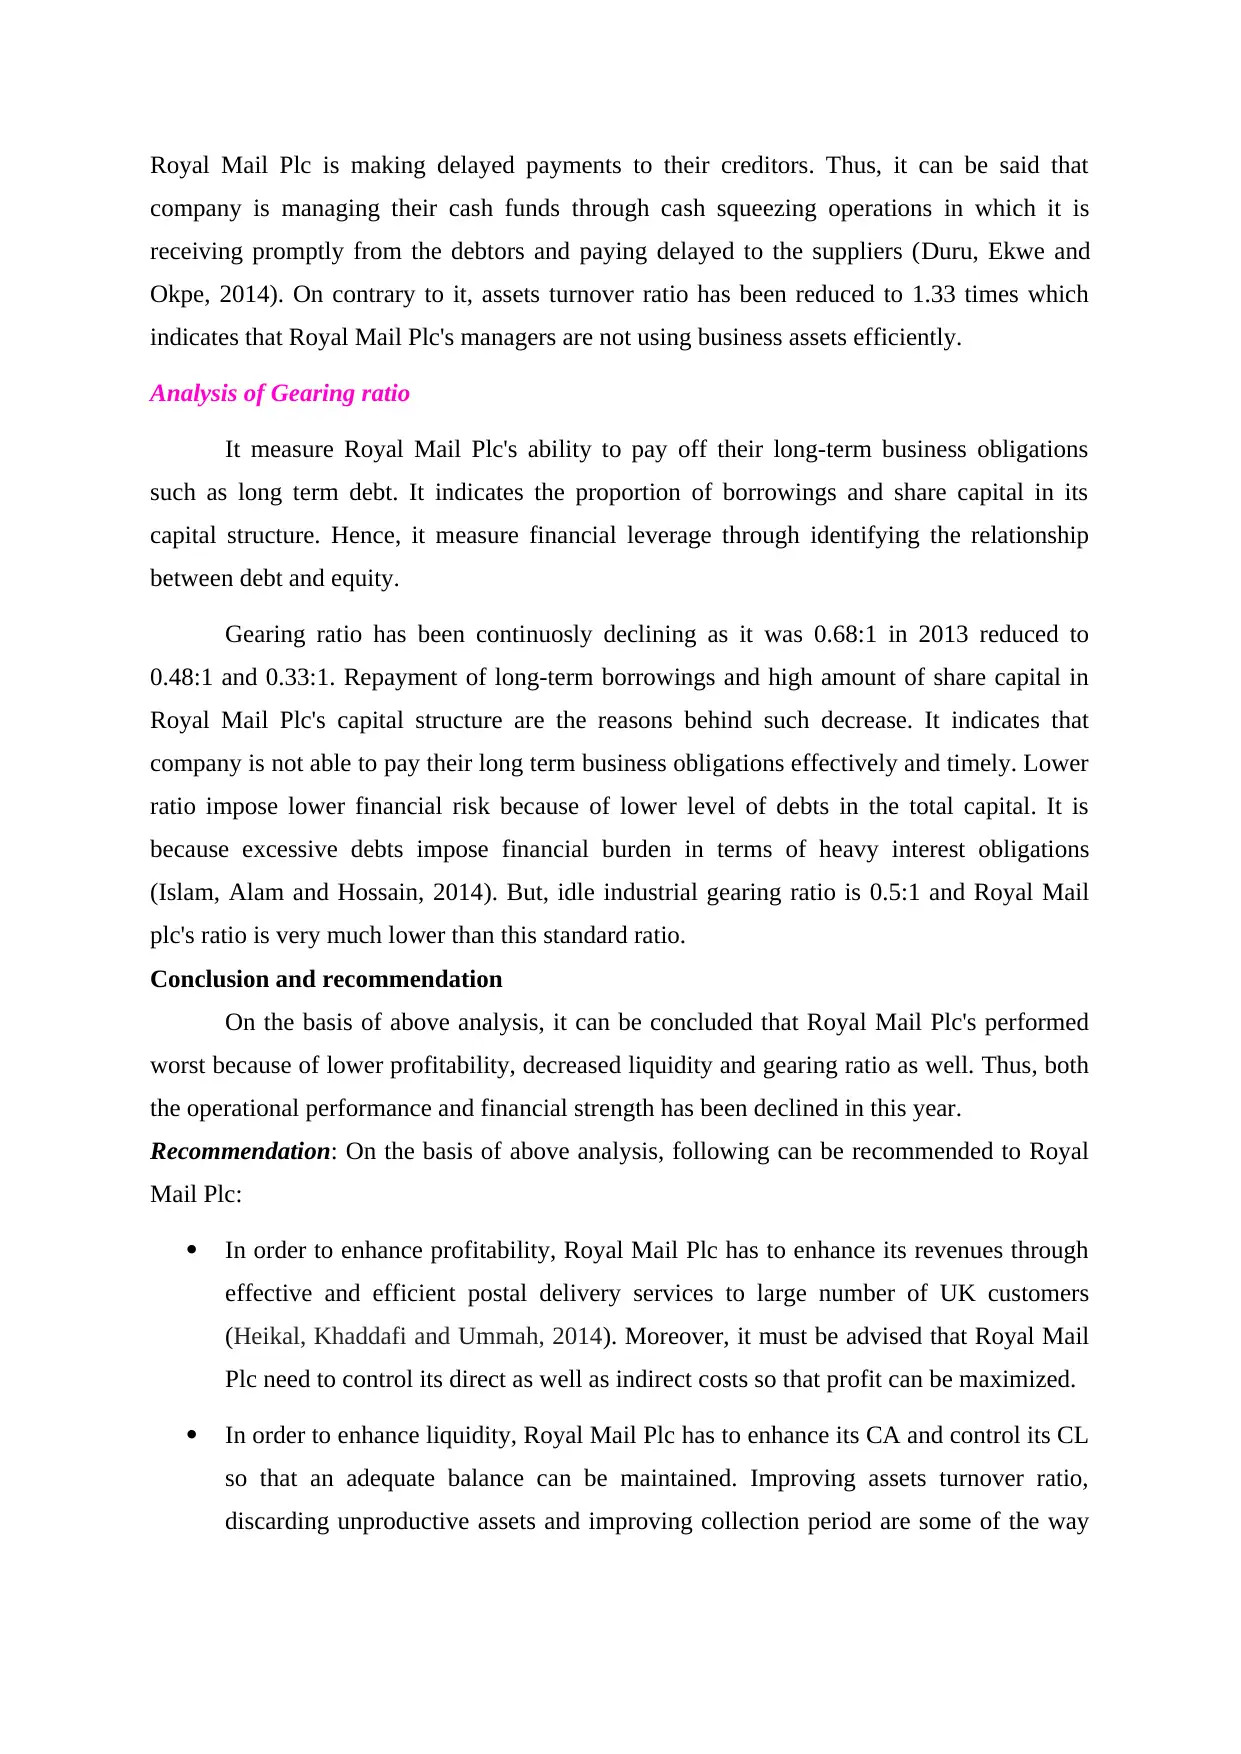
£635m (Kaur, 2014). While, company's sales revenue has been reduced to £9328. However,
increasing operating cost to £8717m is the reasons for adverse performance in 2015. Hence, it
can be said that Royal Mail Plc's do not performed well in 2015.
Analysis of Liquidity ratios
It measure that how much Royal Mail Plc is able to pay their short-term business
obligations. It indicates that firm has enough resources or not to meet out its short-term
financial obligations such as creditors and bank overdraft etc (Hoskin, Fizzell and Cherry,
2014). Current ratio and liquid ratio are the ratios that helps to analyse business liquidity.
CR determines that Royal Mail Plc has adequate current assets or not to discharge
their current liabilities whilst acid test ratio determines liquidity position without having
business inventory. With reference to Royal Mail Plc, its CR has been declining from 0.76:1
to 0.68:1 and 0.67:1. Similarly, acid test ratio also has been reduced from 0.75:1 to 0.67:1 and
0.66:1. In 2015, both the liquidity ratio shows a very little decrease by only 0.01. Declined
CA and Higher CL are the reasons behind such decline. However, in 2015, Royal Mail Plc
maintained its CA to 1317m. Moreover, it is far away from the idle current ratio which is 2:1
says that Royal Mail Plc's CA should be 2 times higher than CL. Henceforth, decline ratio is
not a good sign of short-term business ability and it exhibits that Royal Mail Plc is not able to
pay off their current liabilities, not more than 12 effectively and timely.
Analysis of efficiency ratios
This type of ratios helps to evaluate Royal Mail Plc's managerial efficiency to use business
assets. Accounts receivable days and payable days are the type of efficiency ratios. Accounts
receivable ratio measure the number of days in which Royal Mail Plc receive cash funds from
their debtors while payable days indicates the time which it take to pay their suppliers
(Bohušová and Svoboda, 2014). Declined receivable days and high payable days are
considered good as it helps to generate high cash flows and operate successfully.
Accounts receivable days has been decreased from 39.49 days to 36.12 while in 2015,
it has been improved to 37.13 days. In 2014, t is favourable because it indicates that Royal
Mail Plc is receiving its debtors promptly within 36.12 days. It will helps to enhance cash
flow so that firm will not face short-term financing difficulties. While, in 2015, it is
unfavourable because it is entails that Royal Mail Plc is receiving delayed payments from
their debtors. However, payable day consistently shows a rising trend as it has been increased
from 68.03 days to 69.84 respectively. It is a favourable change because it exhibited that
Paraphrase This Document
Need a fresh take? Get an instant paraphrase of this document with our AI Paraphraser
Royal Mail Plc is making delayed payments to their creditors. Thus, it can be said that
company is managing their cash funds through cash squeezing operations in which it is
receiving promptly from the debtors and paying delayed to the suppliers (Duru, Ekwe and
Okpe, 2014). On contrary to it, assets turnover ratio has been reduced to 1.33 times which
indicates that Royal Mail Plc's managers are not using business assets efficiently.
Analysis of Gearing ratio
It measure Royal Mail Plc's ability to pay off their long-term business obligations
such as long term debt. It indicates the proportion of borrowings and share capital in its
capital structure. Hence, it measure financial leverage through identifying the relationship
between debt and equity.
Gearing ratio has been continuosly declining as it was 0.68:1 in 2013 reduced to
0.48:1 and 0.33:1. Repayment of long-term borrowings and high amount of share capital in
Royal Mail Plc's capital structure are the reasons behind such decrease. It indicates that
company is not able to pay their long term business obligations effectively and timely. Lower
ratio impose lower financial risk because of lower level of debts in the total capital. It is
because excessive debts impose financial burden in terms of heavy interest obligations
(Islam, Alam and Hossain, 2014). But, idle industrial gearing ratio is 0.5:1 and Royal Mail
plc's ratio is very much lower than this standard ratio.
Conclusion and recommendation
On the basis of above analysis, it can be concluded that Royal Mail Plc's performed
worst because of lower profitability, decreased liquidity and gearing ratio as well. Thus, both
the operational performance and financial strength has been declined in this year.
Recommendation: On the basis of above analysis, following can be recommended to Royal
Mail Plc:
In order to enhance profitability, Royal Mail Plc has to enhance its revenues through
effective and efficient postal delivery services to large number of UK customers
(Heikal, Khaddafi and Ummah, 2014). Moreover, it must be advised that Royal Mail
Plc need to control its direct as well as indirect costs so that profit can be maximized.
In order to enhance liquidity, Royal Mail Plc has to enhance its CA and control its CL
so that an adequate balance can be maintained. Improving assets turnover ratio,
discarding unproductive assets and improving collection period are some of the way
to enhance liquidity position. Through this, it can achieve standard or target ratio of
CR and QR which is 2:1 and 1:1.
Managers has to reduce their receivable days so that cash can be generated more
quickly from the debtors. It will helps to enhance Royal Mail Plc's cash sources and
reduce possibility of potential operational hazards due to lack of funds.
In order to improve gearing ratio, it must be advised that Royal Mail Plc should take
additional borrowings rather than equity to fulfil its long term financial need (Islam,
Alam and Hossain, 2014). Through this, it can achieve its standard ratio of 5:1 and
increase its ability to pay off their long term financial obligations timely.
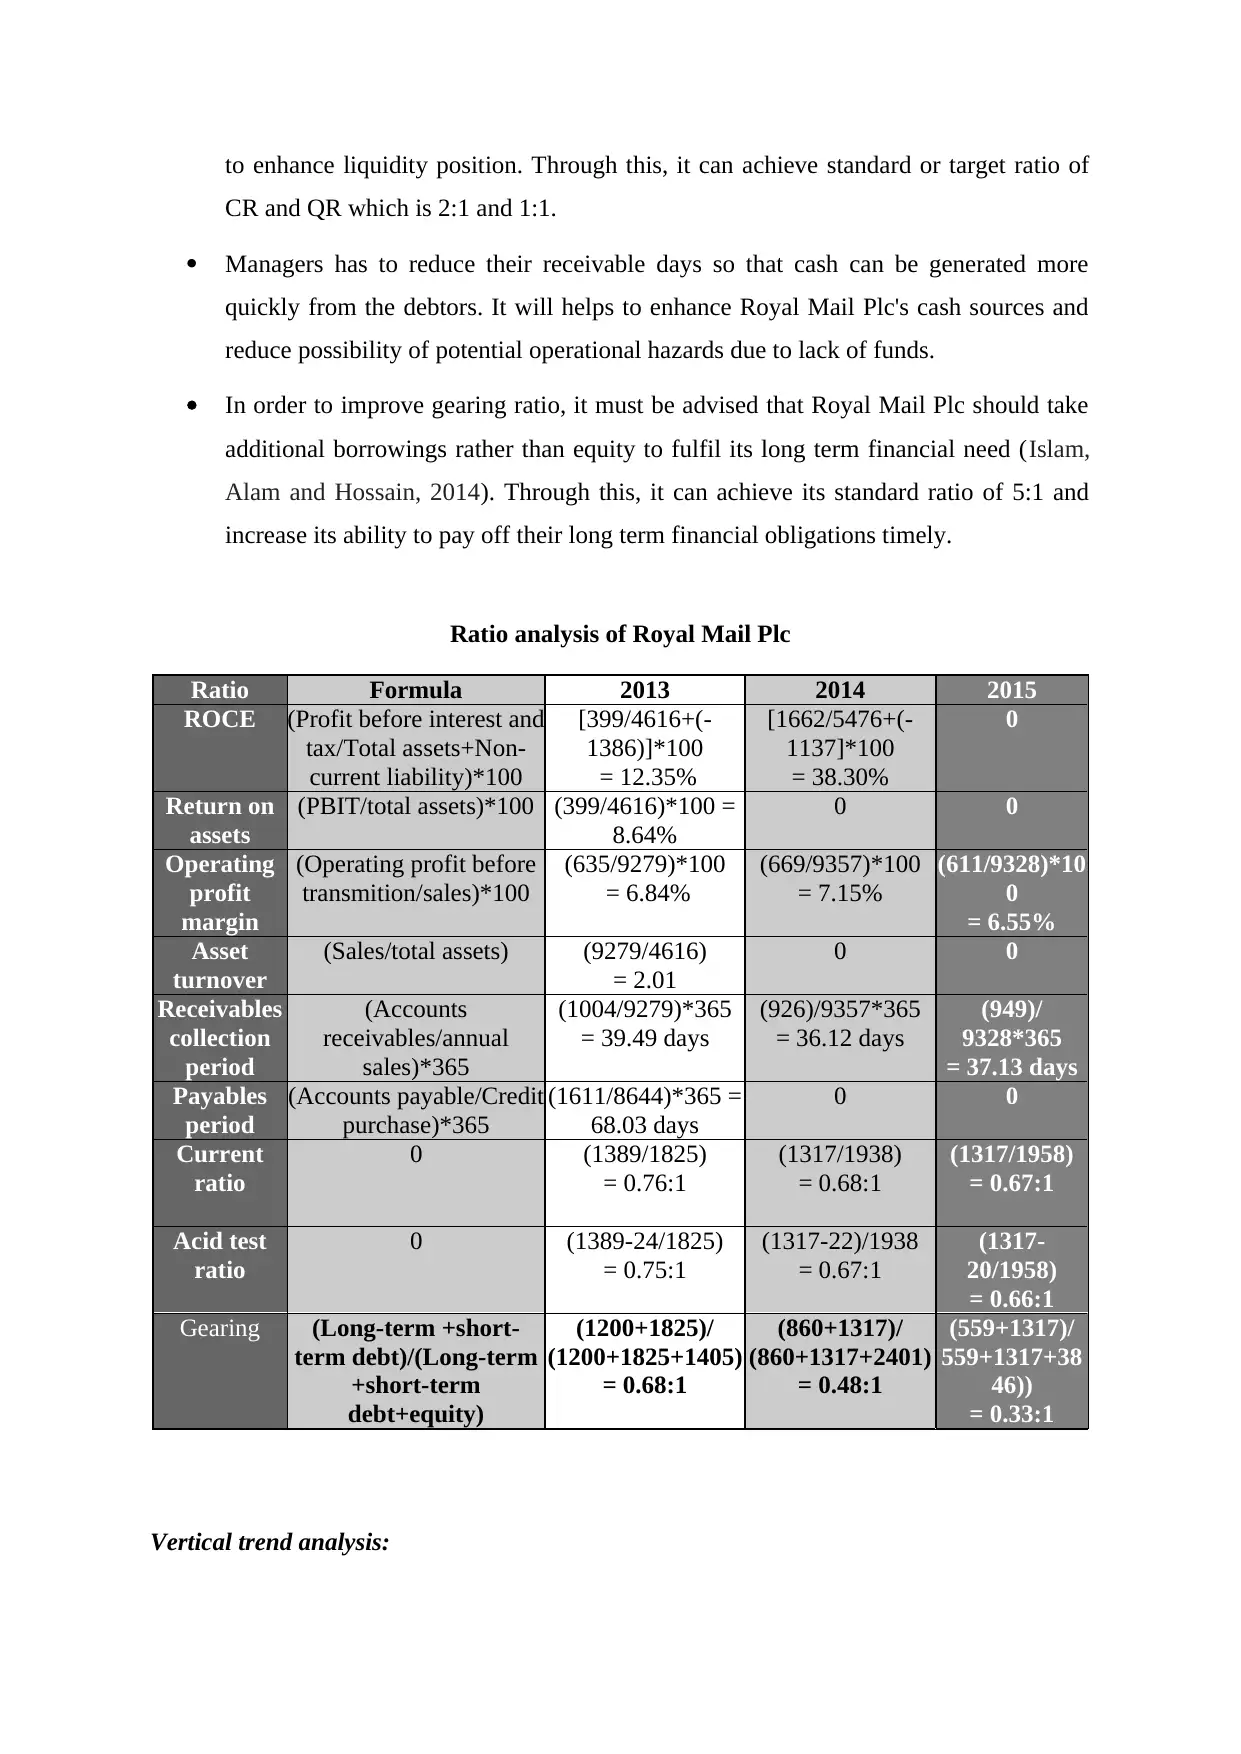
Ratio analysis of Royal Mail Plc
Ratio Formula 2013 2014 2015
ROCE (Profit before interest and
tax/Total assets+Non-
current liability)*100
[399/4616+(-
1386)]*100
= 12.35%
[1662/5476+(-
1137]*100
= 38.30%
0
Return on
assets
(PBIT/total assets)*100 (399/4616)*100 =
8.64%
0 0
Operating
profit
margin
(Operating profit before
transmition/sales)*100
(635/9279)*100
= 6.84%
(669/9357)*100
= 7.15%
(611/9328)*10
0
= 6.55%
Asset
turnover
(Sales/total assets) (9279/4616)
= 2.01
0 0
Receivables
collection
period
(Accounts
receivables/annual
sales)*365
(1004/9279)*365
= 39.49 days
(926)/9357*365
= 36.12 days
(949)/
9328*365
= 37.13 days
Payables
period
(Accounts payable/Credit
purchase)*365
(1611/8644)*365 =
68.03 days
0 0
Current
ratio
0 (1389/1825)
= 0.76:1
(1317/1938)
= 0.68:1
(1317/1958)
= 0.67:1
Acid test
ratio
0 (1389-24/1825)
= 0.75:1
(1317-22)/1938
= 0.67:1
(1317-
20/1958)
= 0.66:1
Gearing (Long-term +short-
term debt)/(Long-term
+short-term
debt+equity)
(1200+1825)/
(1200+1825+1405)
= 0.68:1
(860+1317)/
(860+1317+2401)
= 0.48:1
(559+1317)/
559+1317+38
46))
= 0.33:1
Vertical trend analysis:
CR and QR which is 2:1 and 1:1.
Managers has to reduce their receivable days so that cash can be generated more
quickly from the debtors. It will helps to enhance Royal Mail Plc's cash sources and
reduce possibility of potential operational hazards due to lack of funds.
In order to improve gearing ratio, it must be advised that Royal Mail Plc should take
additional borrowings rather than equity to fulfil its long term financial need (Islam,
Alam and Hossain, 2014). Through this, it can achieve its standard ratio of 5:1 and
increase its ability to pay off their long term financial obligations timely.
Ratio analysis of Royal Mail Plc
Ratio Formula 2013 2014 2015
ROCE (Profit before interest and
tax/Total assets+Non-
current liability)*100
[399/4616+(-
1386)]*100
= 12.35%
[1662/5476+(-
1137]*100
= 38.30%
0
Return on
assets
(PBIT/total assets)*100 (399/4616)*100 =
8.64%
0 0
Operating
profit
margin
(Operating profit before
transmition/sales)*100
(635/9279)*100
= 6.84%
(669/9357)*100
= 7.15%
(611/9328)*10
0
= 6.55%
Asset
turnover
(Sales/total assets) (9279/4616)
= 2.01
0 0
Receivables
collection
period
(Accounts
receivables/annual
sales)*365
(1004/9279)*365
= 39.49 days
(926)/9357*365
= 36.12 days
(949)/
9328*365
= 37.13 days
Payables
period
(Accounts payable/Credit
purchase)*365
(1611/8644)*365 =
68.03 days
0 0
Current
ratio
0 (1389/1825)
= 0.76:1
(1317/1938)
= 0.68:1
(1317/1958)
= 0.67:1
Acid test
ratio
0 (1389-24/1825)
= 0.75:1
(1317-22)/1938
= 0.67:1
(1317-
20/1958)
= 0.66:1
Gearing (Long-term +short-
term debt)/(Long-term
+short-term
debt+equity)
(1200+1825)/
(1200+1825+1405)
= 0.68:1
(860+1317)/
(860+1317+2401)
= 0.48:1
(559+1317)/
559+1317+38
46))
= 0.33:1
Vertical trend analysis:
⊘ This is a preview!⊘
Do you want full access?
Subscribe today to unlock all pages.
Trusted by 1+ million students worldwide
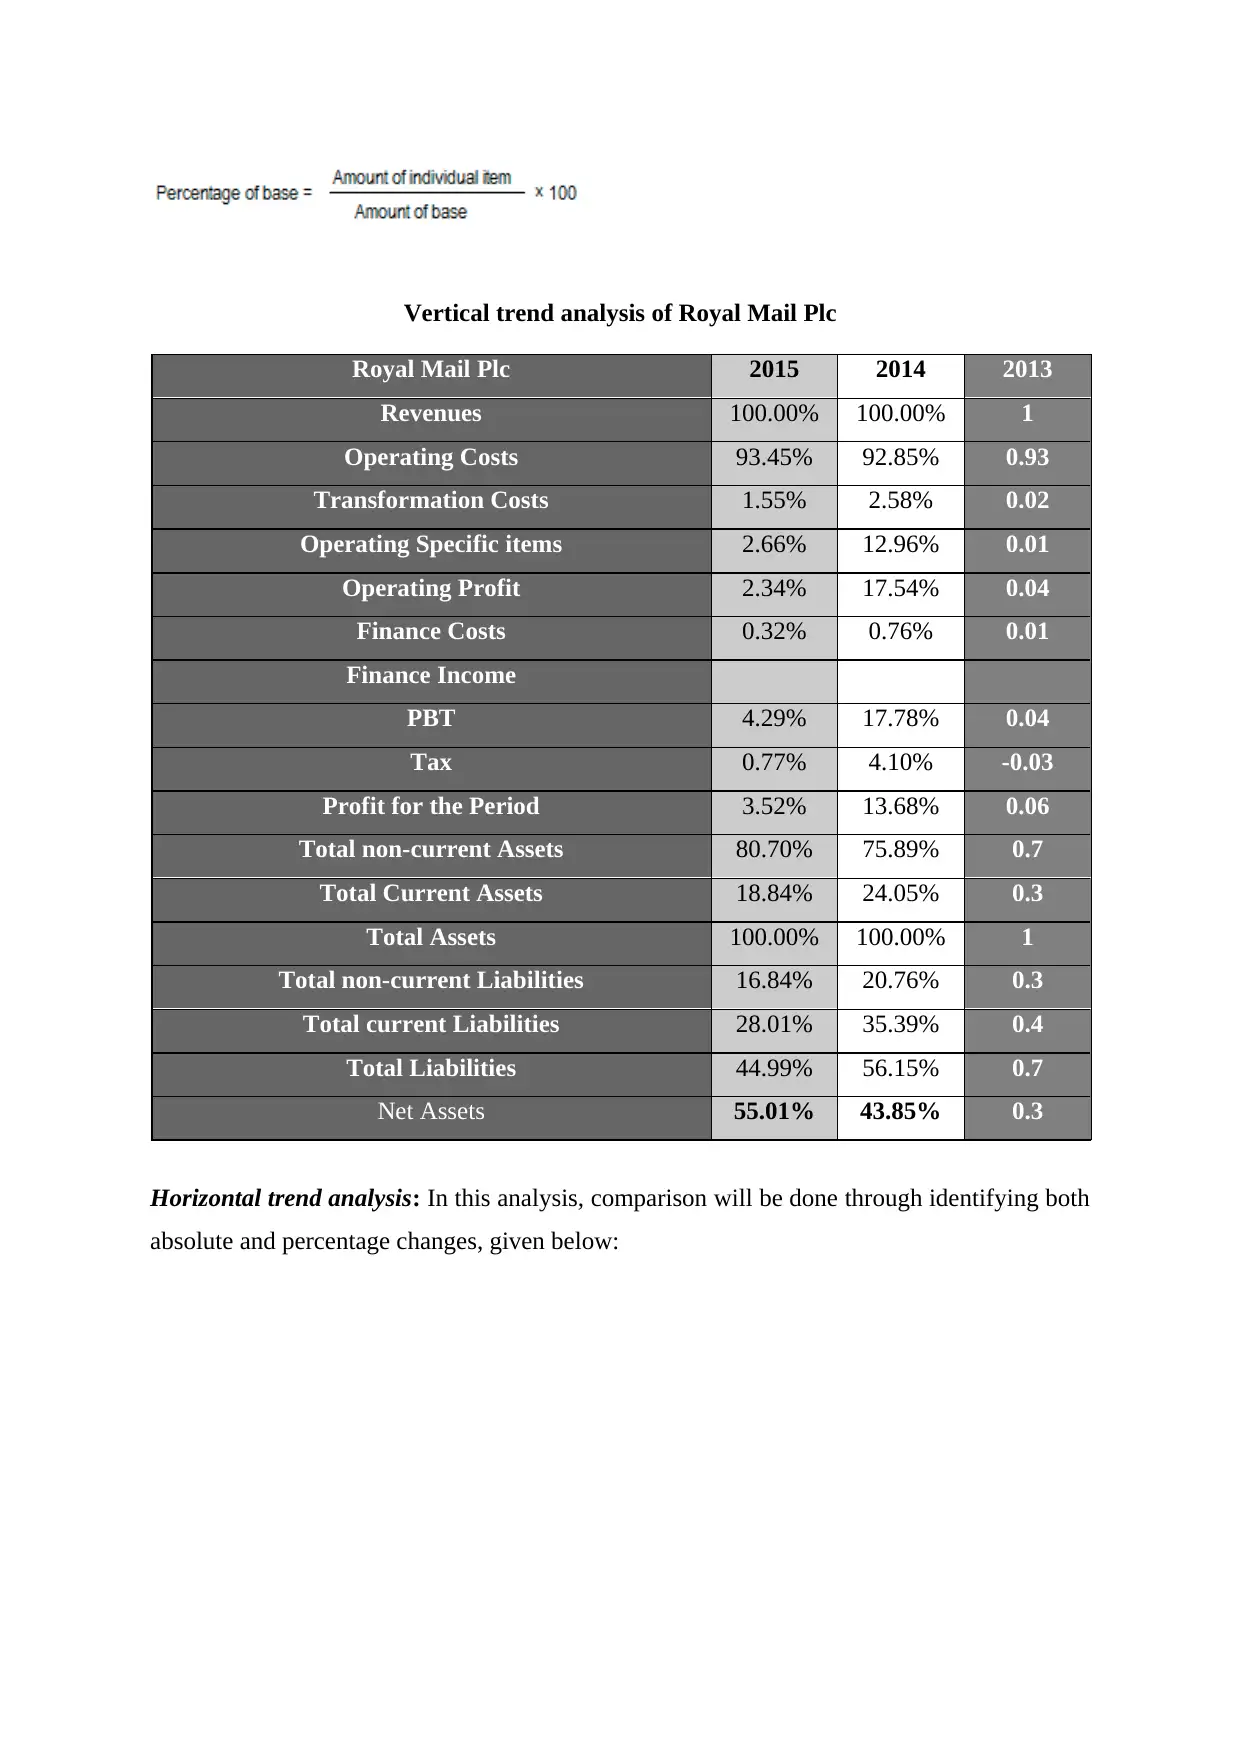
Vertical trend analysis of Royal Mail Plc
Royal Mail Plc 2015 2014 2013
Revenues 100.00% 100.00% 1
Operating Costs 93.45% 92.85% 0.93
Transformation Costs 1.55% 2.58% 0.02
Operating Specific items 2.66% 12.96% 0.01
Operating Profit 2.34% 17.54% 0.04
Finance Costs 0.32% 0.76% 0.01
Finance Income
PBT 4.29% 17.78% 0.04
Tax 0.77% 4.10% -0.03
Profit for the Period 3.52% 13.68% 0.06
Total non-current Assets 80.70% 75.89% 0.7
Total Current Assets 18.84% 24.05% 0.3
Total Assets 100.00% 100.00% 1
Total non-current Liabilities 16.84% 20.76% 0.3
Total current Liabilities 28.01% 35.39% 0.4
Total Liabilities 44.99% 56.15% 0.7
Net Assets 55.01% 43.85% 0.3
Horizontal trend analysis: In this analysis, comparison will be done through identifying both
absolute and percentage changes, given below:
Paraphrase This Document
Need a fresh take? Get an instant paraphrase of this document with our AI Paraphraser
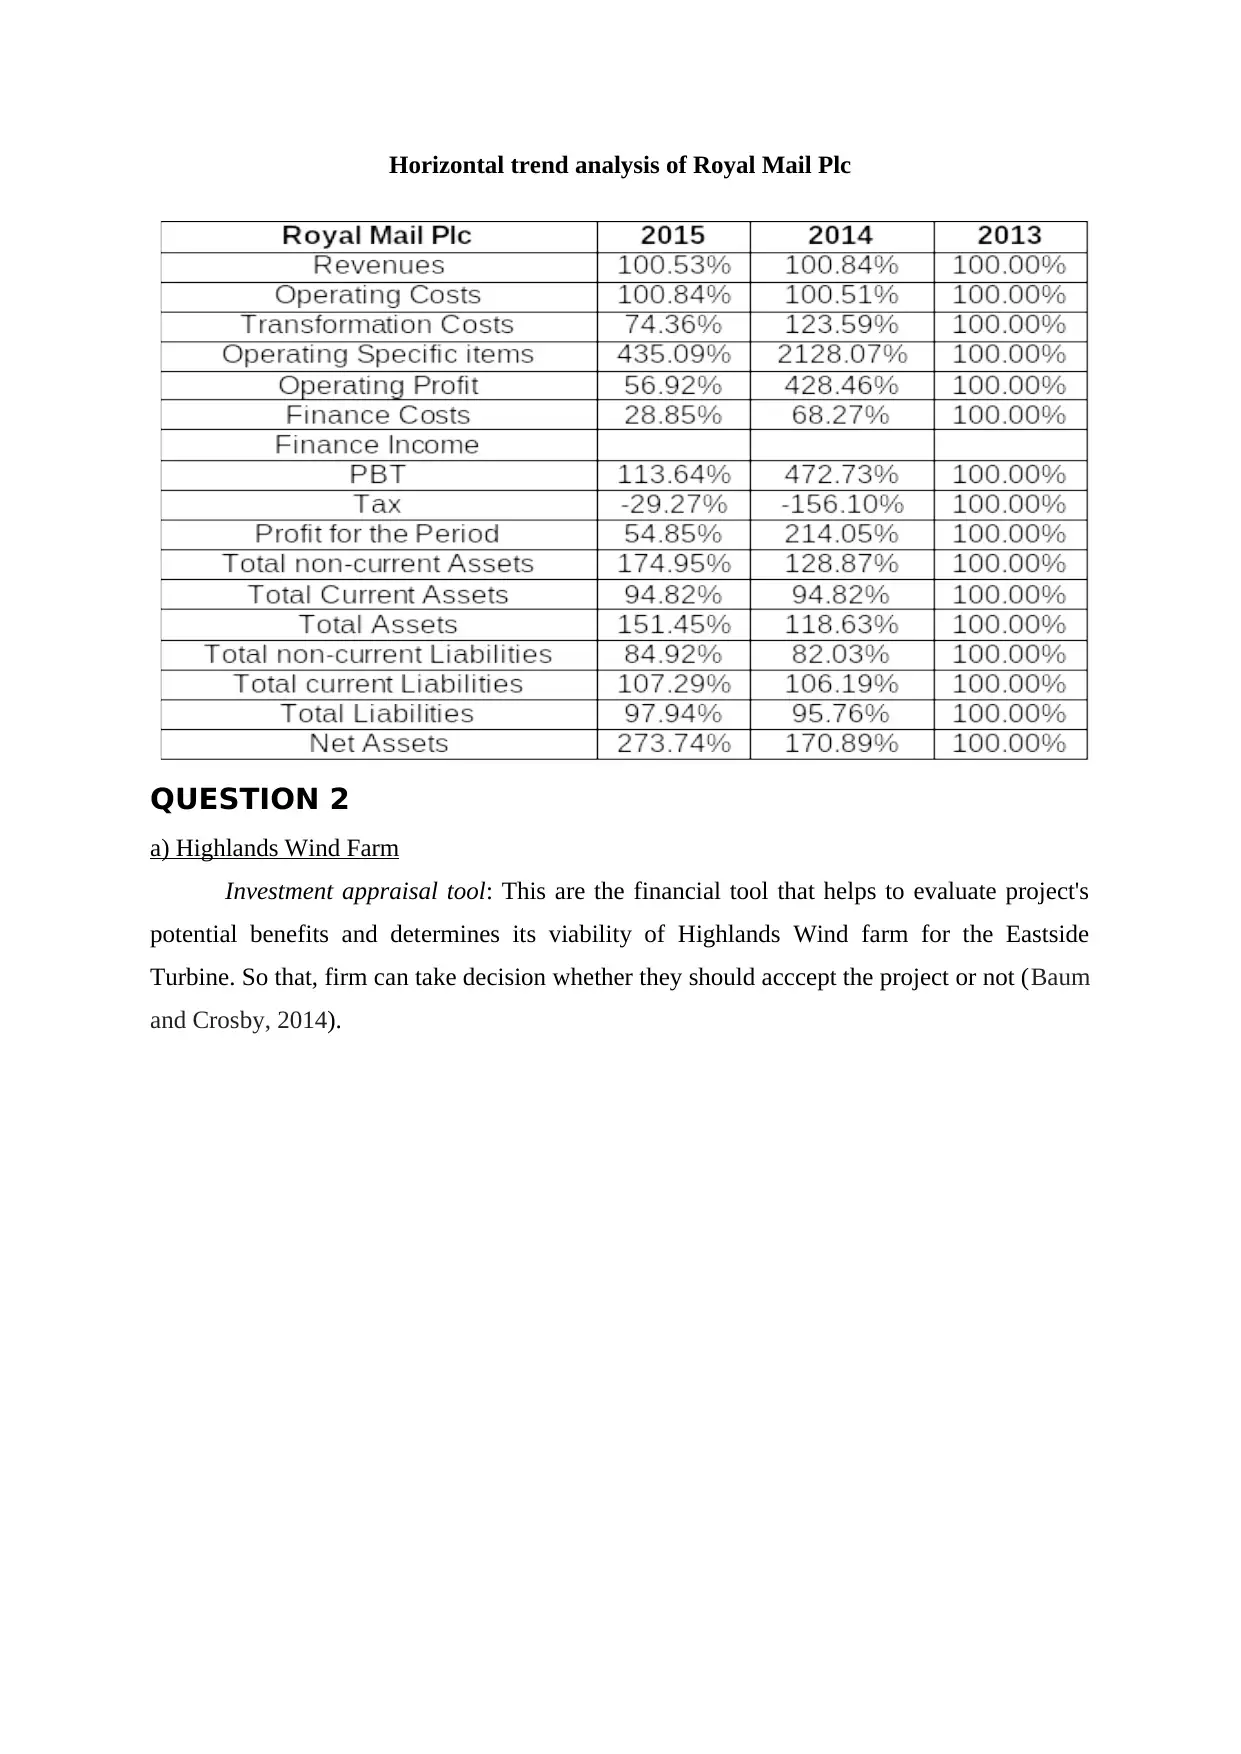
Horizontal trend analysis of Royal Mail Plc
QUESTION 2
a) Highlands Wind Farm
Investment appraisal tool: This are the financial tool that helps to evaluate project's
potential benefits and determines its viability of Highlands Wind farm for the Eastside
Turbine. So that, firm can take decision whether they should acccept the project or not (Baum
and Crosby, 2014).
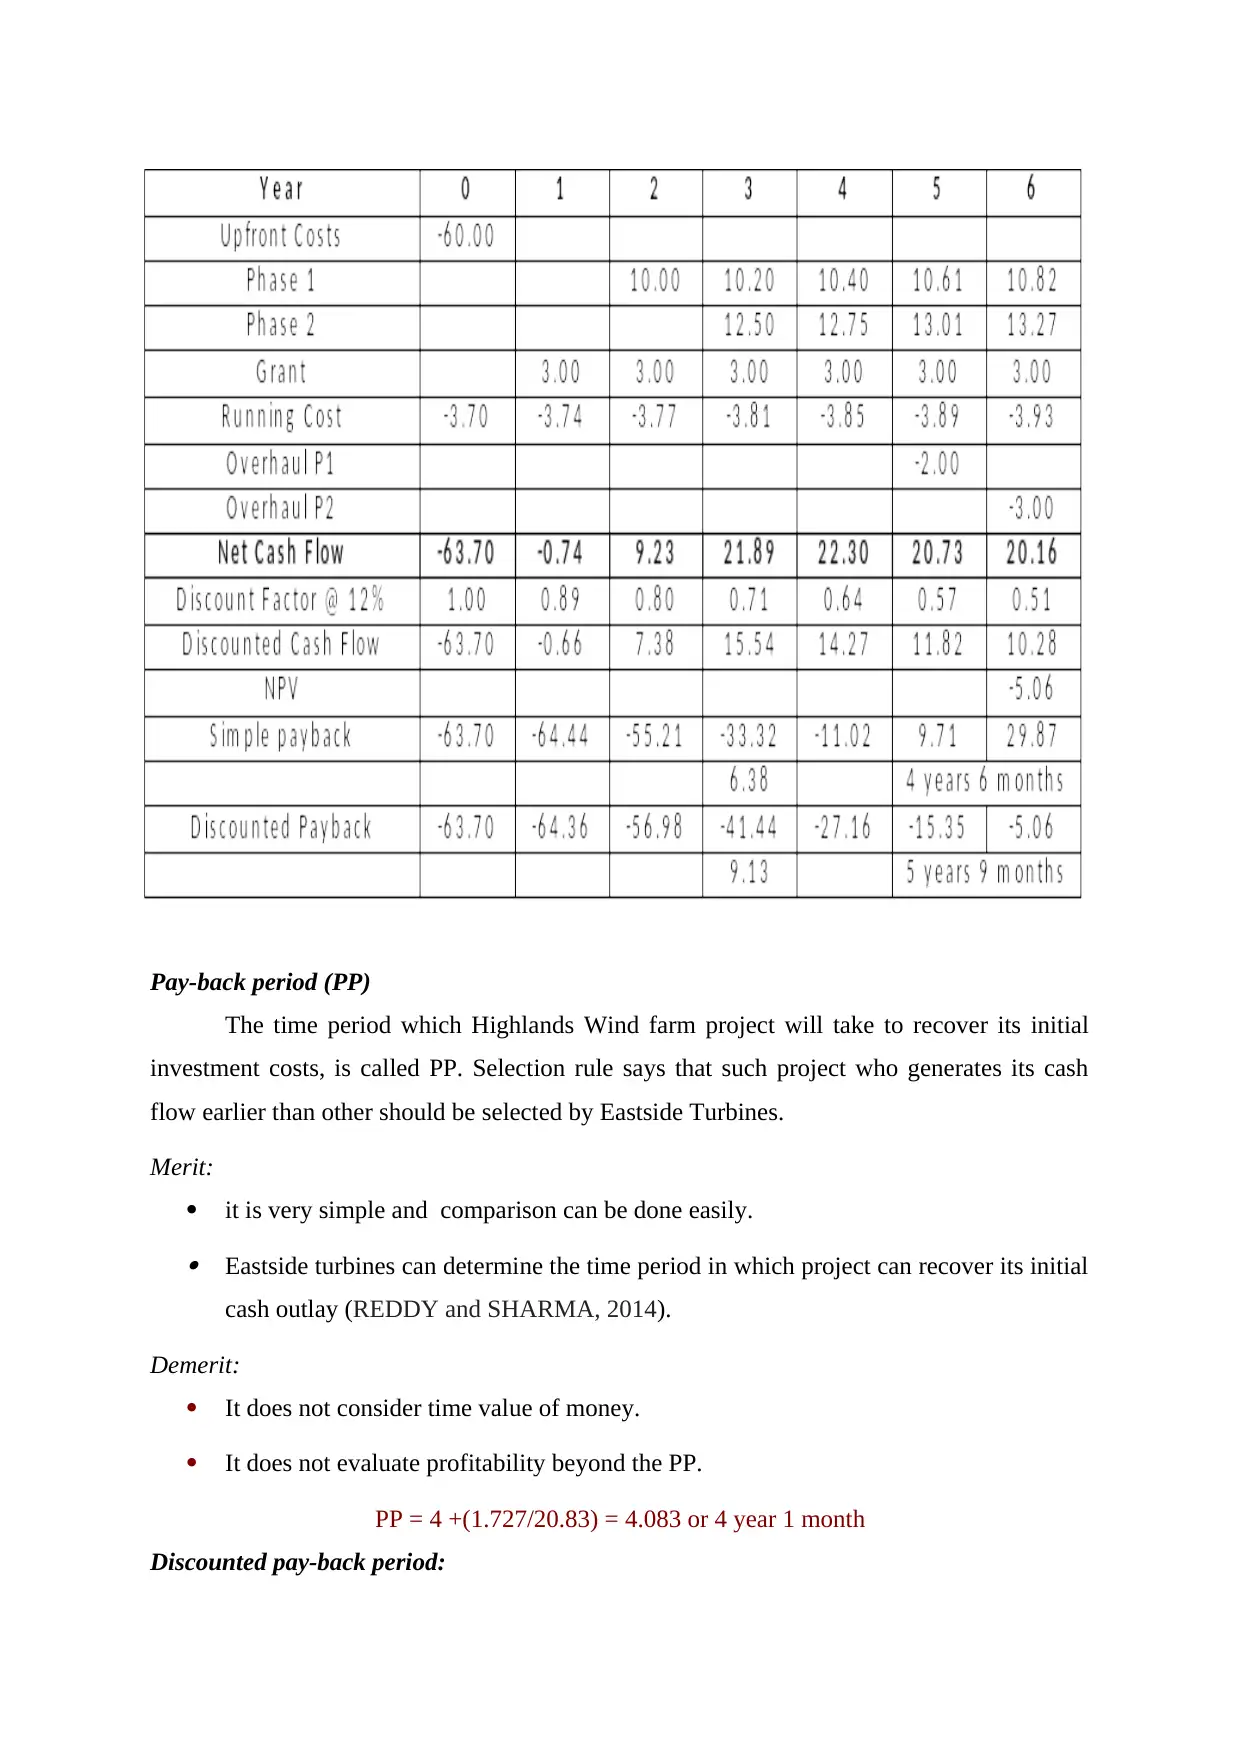
Pay-back period (PP)
The time period which Highlands Wind farm project will take to recover its initial
investment costs, is called PP. Selection rule says that such project who generates its cash
flow earlier than other should be selected by Eastside Turbines.
Merit:
it is very simple and comparison can be done easily. Eastside turbines can determine the time period in which project can recover its initial
cash outlay (REDDY and SHARMA, 2014).
Demerit:
It does not consider time value of money.
It does not evaluate profitability beyond the PP.
PP = 4 +(1.727/20.83) = 4.083 or 4 year 1 month
Discounted pay-back period:
⊘ This is a preview!⊘
Do you want full access?
Subscribe today to unlock all pages.
Trusted by 1+ million students worldwide
It overcome one limitation of PP through using discounted values of all the associated
cash inflows to estimate DPP (Sims, Powell and Vidgen, 2015). Eastside Turbines should
select project whose DPP is shorter than other.
Merit:
It take into consideration the time value concept of money. It provide more reliastic results as compare to PP.
Demerit:
It does not pay attention to the post pay back profitability.
DPP of Highland project = 5+(6.8/10.3) = 5.66 or 5 year 4 month
Net present value (NPV):
It is comparatively superior method than PP because it evaluate overall project return
through using an appropriate discount factor. It determine future values of all the cash
inflows and sum of future values will be compare to project cost so as to identify NPV
(Bagzibagli, Jenkins and Semwaga, 2015). Eastside Turbine should select such project
whose NPV is higher than other.
Merit: It uses discount factor to determine future values of the cash flows. Thus, time value
concept is consider by this method.
Demerit: It is very difficult to set an appropriate discount rate as market based factors such as
interst and inflation rate have an great impact on this. Thus, using a standard rate for
all the years is seems to be unfair.
Other non-financial factors
Several non-financial factors should also be analyse by Eastside Turbine before
accepting any new proposal. It should examine that efficient, talented and experienced man
power is available or not in the business to support its new project of Highland Wind.
Moreover, firm is strictly restricted to follow government legislation and rules. Therefore,
they should analyse potential threats that can be arisen due to changing regulations (Baum
and Crosby, 2014). Further, in the throat cut age of competition, competitor's actions should
also be analyse to determine future challenges or opportunities as well.
Recommendation
Paraphrase This Document
Need a fresh take? Get an instant paraphrase of this document with our AI Paraphraser
On the basis of above information, it can be said that Eastside turbine should invest
initial investment worth £60m in Highland wind farms because it will generate positive NPV
worth £3.5 at discount rate of 12%. Moreover, its PP indicates that firm will recover its initial
investment within 4 year 1 month while, DPP at 12% is 5 year 4 month. Thus, it can be
recommended that at 12% discount factor, company should invest funds in this project
because it will provide favourable return.
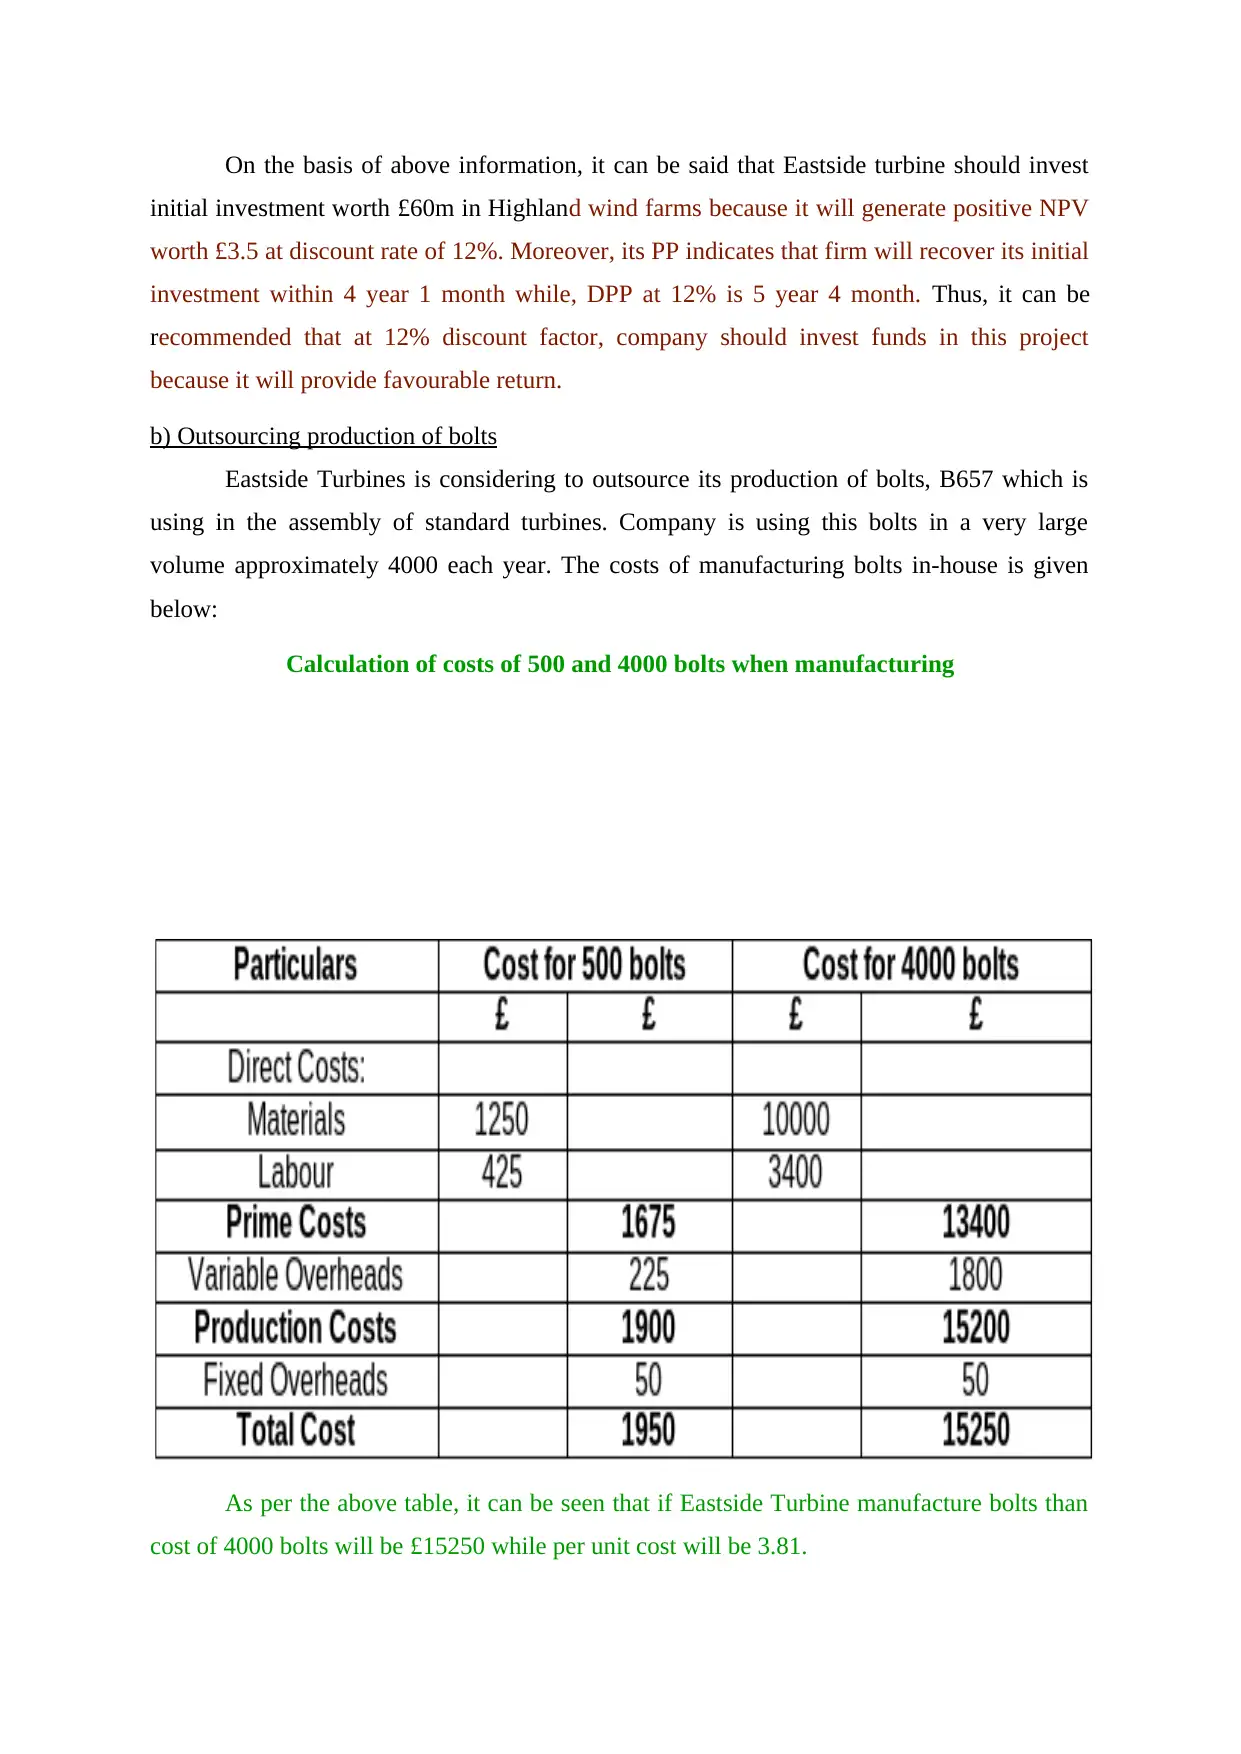
b) Outsourcing production of bolts
Eastside Turbines is considering to outsource its production of bolts, B657 which is
using in the assembly of standard turbines. Company is using this bolts in a very large
volume approximately 4000 each year. The costs of manufacturing bolts in-house is given
below:
Calculation of costs of 500 and 4000 bolts when manufacturing
As per the above table, it can be seen that if Eastside Turbine manufacture bolts than
cost of 4000 bolts will be £15250 while per unit cost will be 3.81.
initial investment worth £60m in Highland wind farms because it will generate positive NPV
worth £3.5 at discount rate of 12%. Moreover, its PP indicates that firm will recover its initial
investment within 4 year 1 month while, DPP at 12% is 5 year 4 month. Thus, it can be
recommended that at 12% discount factor, company should invest funds in this project
because it will provide favourable return.
b) Outsourcing production of bolts
Eastside Turbines is considering to outsource its production of bolts, B657 which is
using in the assembly of standard turbines. Company is using this bolts in a very large
volume approximately 4000 each year. The costs of manufacturing bolts in-house is given
below:
Calculation of costs of 500 and 4000 bolts when manufacturing
As per the above table, it can be seen that if Eastside Turbine manufacture bolts than
cost of 4000 bolts will be £15250 while per unit cost will be 3.81.
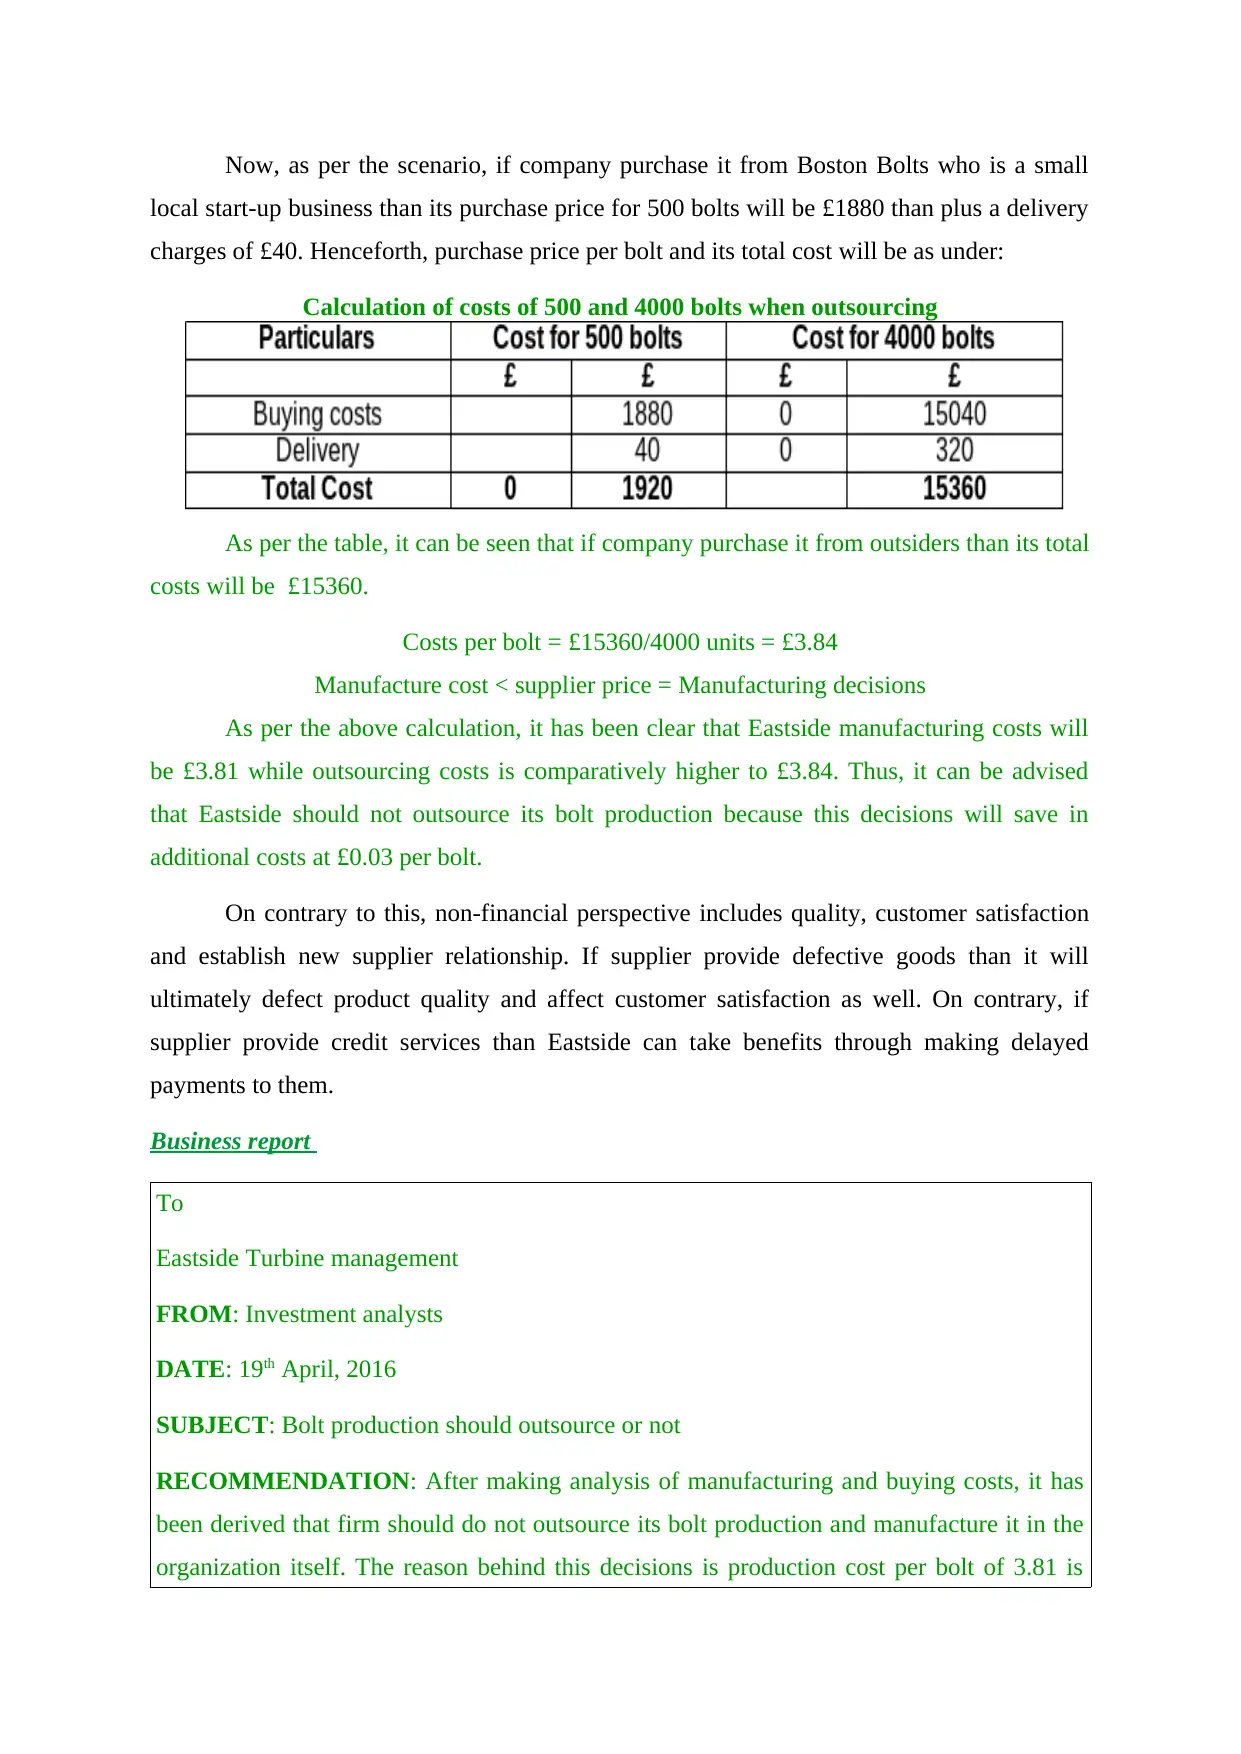
Now, as per the scenario, if company purchase it from Boston Bolts who is a small
local start-up business than its purchase price for 500 bolts will be £1880 than plus a delivery
charges of £40. Henceforth, purchase price per bolt and its total cost will be as under:
Calculation of costs of 500 and 4000 bolts when outsourcing
As per the table, it can be seen that if company purchase it from outsiders than its total
costs will be £15360.
Costs per bolt = £15360/4000 units = £3.84
Manufacture cost < supplier price = Manufacturing decisions
As per the above calculation, it has been clear that Eastside manufacturing costs will
be £3.81 while outsourcing costs is comparatively higher to £3.84. Thus, it can be advised
that Eastside should not outsource its bolt production because this decisions will save in
additional costs at £0.03 per bolt.
On contrary to this, non-financial perspective includes quality, customer satisfaction
and establish new supplier relationship. If supplier provide defective goods than it will
ultimately defect product quality and affect customer satisfaction as well. On contrary, if
supplier provide credit services than Eastside can take benefits through making delayed
payments to them.
Business report
To
Eastside Turbine management
FROM: Investment analysts
DATE: 19th April, 2016
SUBJECT: Bolt production should outsource or not
RECOMMENDATION: After making analysis of manufacturing and buying costs, it has
been derived that firm should do not outsource its bolt production and manufacture it in the
organization itself. The reason behind this decisions is production cost per bolt of 3.81 is
⊘ This is a preview!⊘
Do you want full access?
Subscribe today to unlock all pages.
Trusted by 1+ million students worldwide
1 out of 19
Related Documents


Your All-in-One AI-Powered Toolkit for Academic Success.
+13062052269
info@desklib.com
Available 24*7 on WhatsApp / Email
![[object Object]](/_next/static/media/star-bottom.7253800d.svg)
Unlock your academic potential
Copyright © 2020–2026 A2Z Services. All Rights Reserved. Developed and managed by ZUCOL.