Financial Statement Analysis Report: UK Retail Sector Comparison
VerifiedAdded on 2020/01/07
|22
|3661
|415
Report
AI Summary
This report presents a financial statement analysis of two prominent UK retailers, Sainsbury and Marks & Spencer. The analysis focuses on key financial statements and utilizes ratio analysis to assess the companies' performance across various metrics, including profitability, liquidity, efficiency, solvency, and investment ratios. The report begins with brief introductions of both companies, highlighting their market positions and business models. It then delves into the methodology of ratio analysis, explaining its importance in evaluating financial performance. The core of the report presents and interprets various financial ratios for both companies over a period of time, enabling a comparative assessment of their financial health and operational efficiency. The analysis includes both internal and external ratios, providing a comprehensive view of each company's financial standing. Finally, the report concludes with a share price evaluation and recommendations based on the financial analysis, offering insights into the companies' strengths, weaknesses, and potential investment opportunities.
Financial Statement Analysis
Paraphrase This Document
Need a fresh take? Get an instant paraphrase of this document with our AI Paraphraser
Table of Contents
INTRODUCTION...........................................................................................................................3
PART 1............................................................................................................................................3
Brief Introduction of companies..................................................................................................3
Ratio analysis...............................................................................................................................3
PART 2............................................................................................................................................7
Background..................................................................................................................................7
Financial statement's analysis......................................................................................................7
Internal and external ratios..........................................................................................................8
Ratios interpretation.....................................................................................................................9
Share price evaluation................................................................................................................17
Recommendation.......................................................................................................................20
CONCLUSION..............................................................................................................................20
REFERENCES..............................................................................................................................21
2
INTRODUCTION
Financial statement are one of the important statement prepared in the business which
reflects the financial performance of the firm. Sainsbury and marks and Spencer has been
selected for this project report in analyzing their internal capabilities. Ratio analysis is the major
tool used in assessing the financial capabilities and skills earned by these entities.
PART 1
Brief Introduction of companies
Marks and Spencer
This firm counts among the leading retailer of the UK who provides variety of services in
order to please their buyers (Marks&Spencer, 2016). The current business is listed in the London
stock exchange with a constituent of FTSE 100 indexes which signifies its legal identity. This
firm specializes in the selling of clothing, home products and luxury food products. This gain
competitive advantage over Primark by offering food products other than just providing clothing
services. The current firm has chosen for this analysis on the basis of its one of the segment that
is supermarket sector.
Sainsbury
It is famous for offering variety of grocery products which increases the importance and
status of this entity in the external market. This is regarded as the second largest supermarket
chain in the whole UK. The current market position of this entity is not good as the biggest
global competitor Tesco has overtaken this firm (Sainsbury, 2016). The Tesco being a global
competitor affect the performance of this firm by reducing its market share with a remaining
share of 16.9%. The selection of this entity for the analysis in the current report in assessing the
supermarket sector. The efficiency of the supermarket sector in relation with the food and other
kinds of grocery products offered by the Marks and Spencer.
Ratio analysis
This is regarded as one of the important tool used in the comparison of the previous year
figures of the firm with its actual results (Clark, 2016). The ratio analysis is important tool used
by the management of both the firm in order to assess the financial statements. The financial
3
⊘ This is a preview!⊘
Do you want full access?
Subscribe today to unlock all pages.
Trusted by 1+ million students worldwide
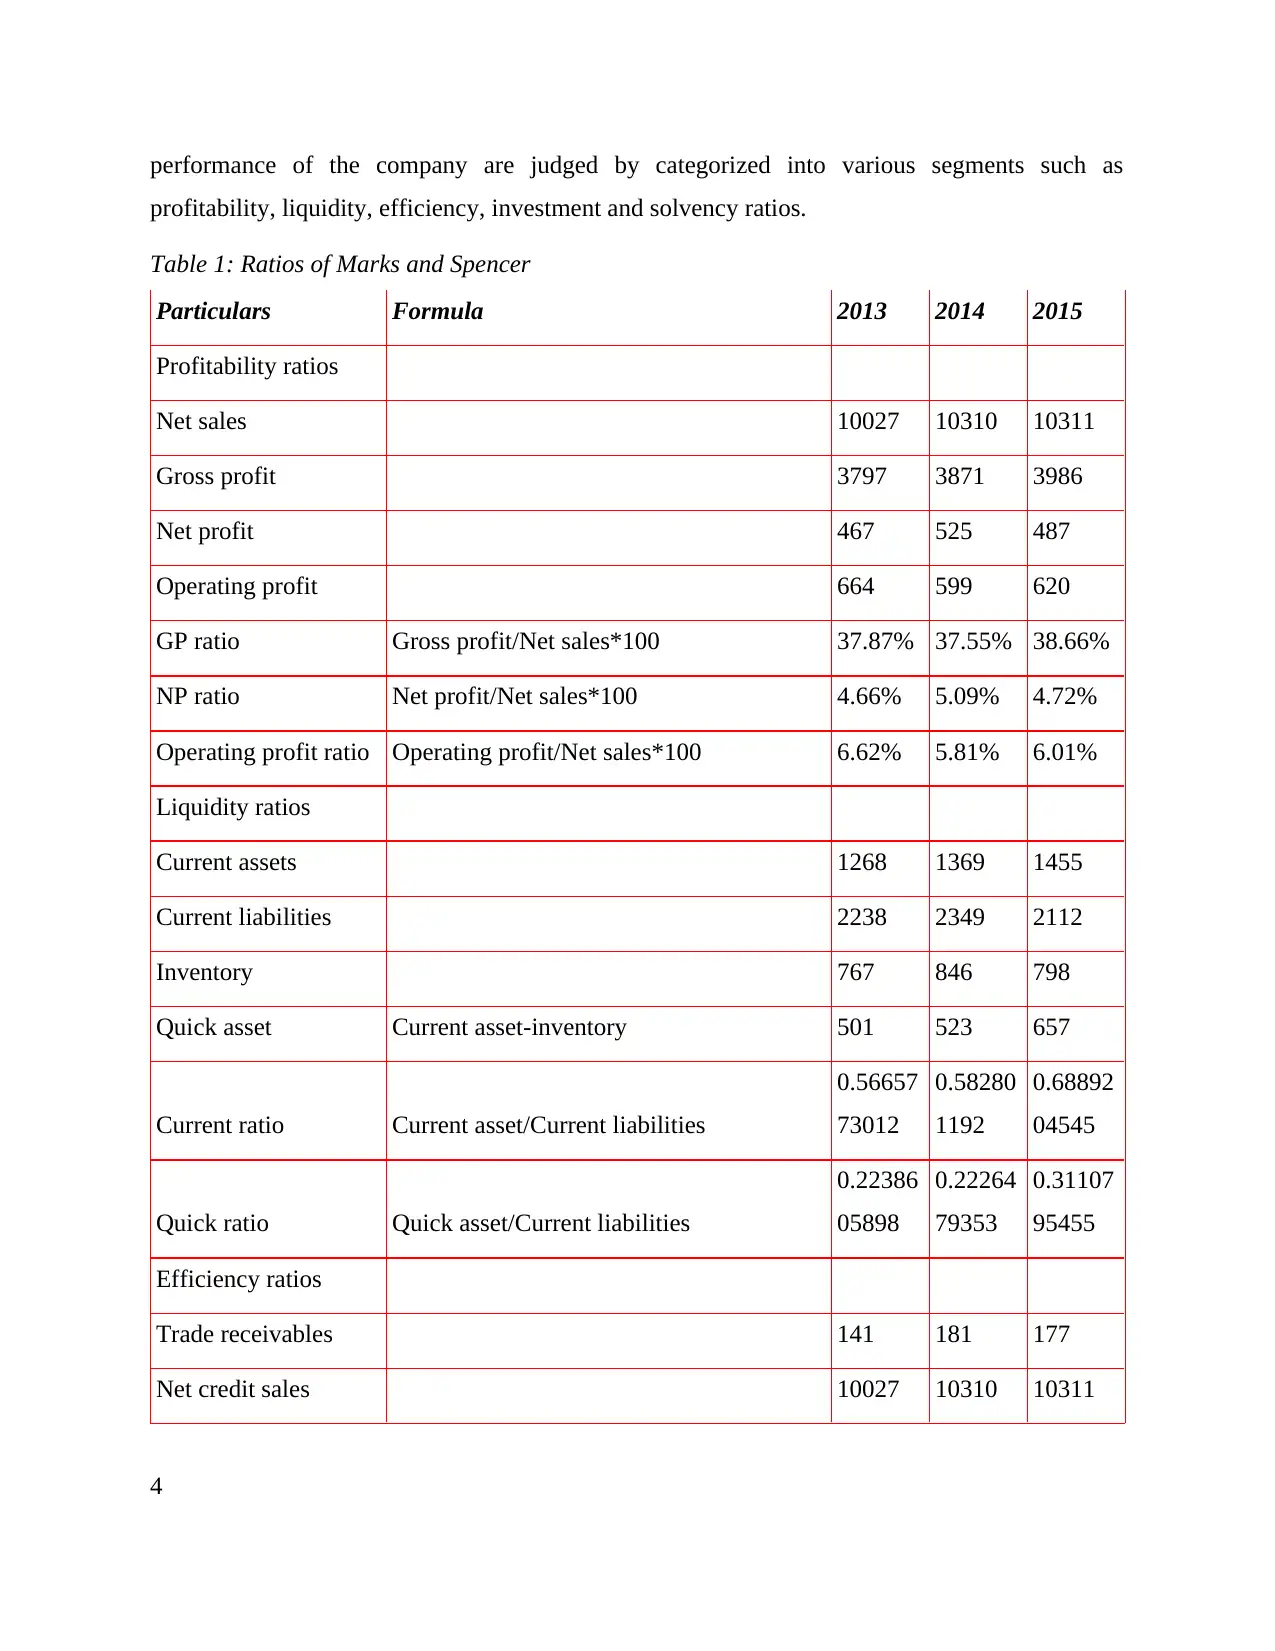
performance of the company are judged by categorized into various segments such as
profitability, liquidity, efficiency, investment and solvency ratios.
Table 1: Ratios of Marks and Spencer
Particulars Formula 2013 2014 2015
Profitability ratios
Net sales 10027 10310 10311
Gross profit 3797 3871 3986
Net profit 467 525 487
Operating profit 664 599 620
GP ratio Gross profit/Net sales*100 37.87% 37.55% 38.66%
NP ratio Net profit/Net sales*100 4.66% 5.09% 4.72%
Operating profit ratio Operating profit/Net sales*100 6.62% 5.81% 6.01%
Liquidity ratios
Current assets 1268 1369 1455
Current liabilities 2238 2349 2112
Inventory 767 846 798
Quick asset Current asset-inventory 501 523 657
Current ratio Current asset/Current liabilities
0.56657
73012
0.58280
1192
0.68892
04545
Quick ratio Quick asset/Current liabilities
0.22386
05898
0.22264
79353
0.31107
95455
Efficiency ratios
Trade receivables 141 181 177
Net credit sales 10027 10310 10311
4
Paraphrase This Document
Need a fresh take? Get an instant paraphrase of this document with our AI Paraphraser
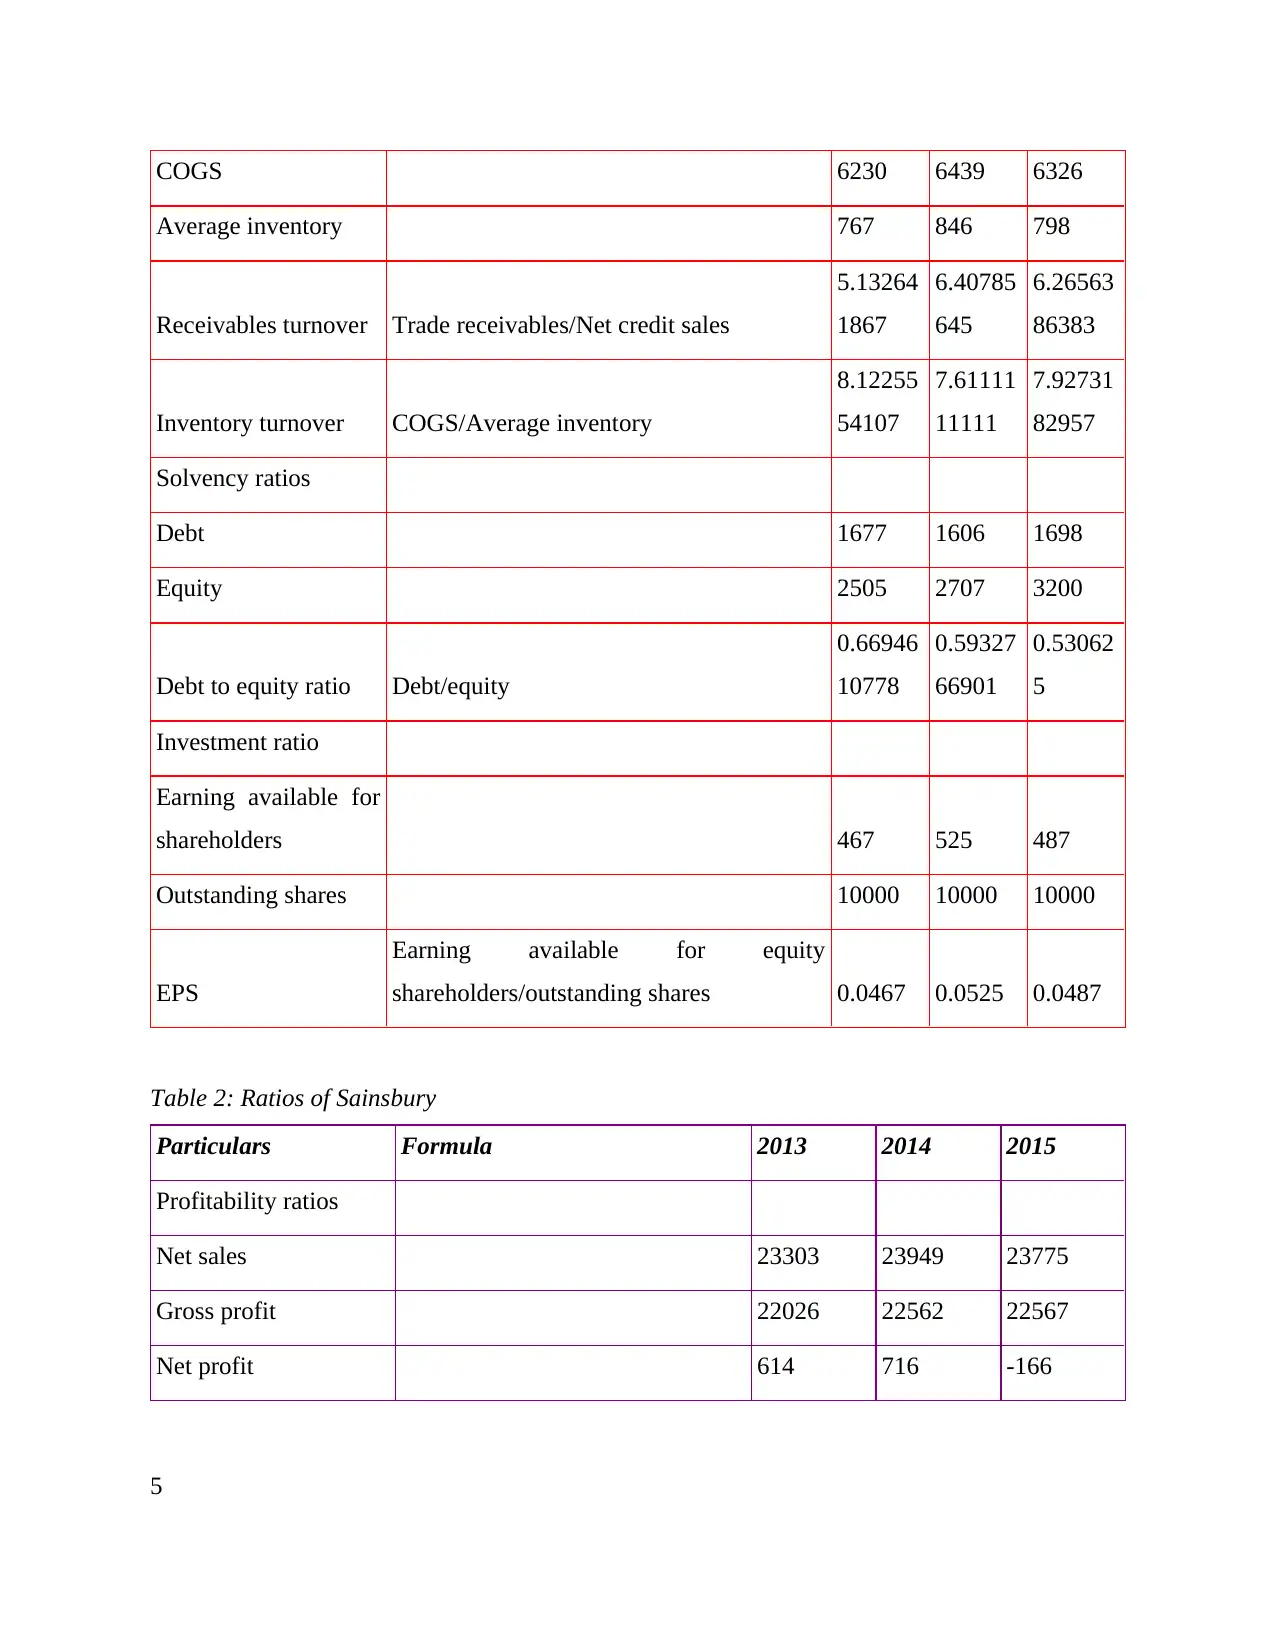
COGS 6230 6439 6326
Average inventory 767 846 798
Receivables turnover Trade receivables/Net credit sales
5.13264
1867
6.40785
645
6.26563
86383
Inventory turnover COGS/Average inventory
8.12255
54107
7.61111
11111
7.92731
82957
Solvency ratios
Debt 1677 1606 1698
Equity 2505 2707 3200
Debt to equity ratio Debt/equity
0.66946
10778
0.59327
66901
0.53062
5
Investment ratio
Earning available for
shareholders 467 525 487
Outstanding shares 10000 10000 10000
EPS
Earning available for equity
shareholders/outstanding shares 0.0467 0.0525 0.0487
Table 2: Ratios of Sainsbury
Particulars Formula 2013 2014 2015
Profitability ratios
Net sales 23303 23949 23775
Gross profit 22026 22562 22567
Net profit 614 716 -166
5
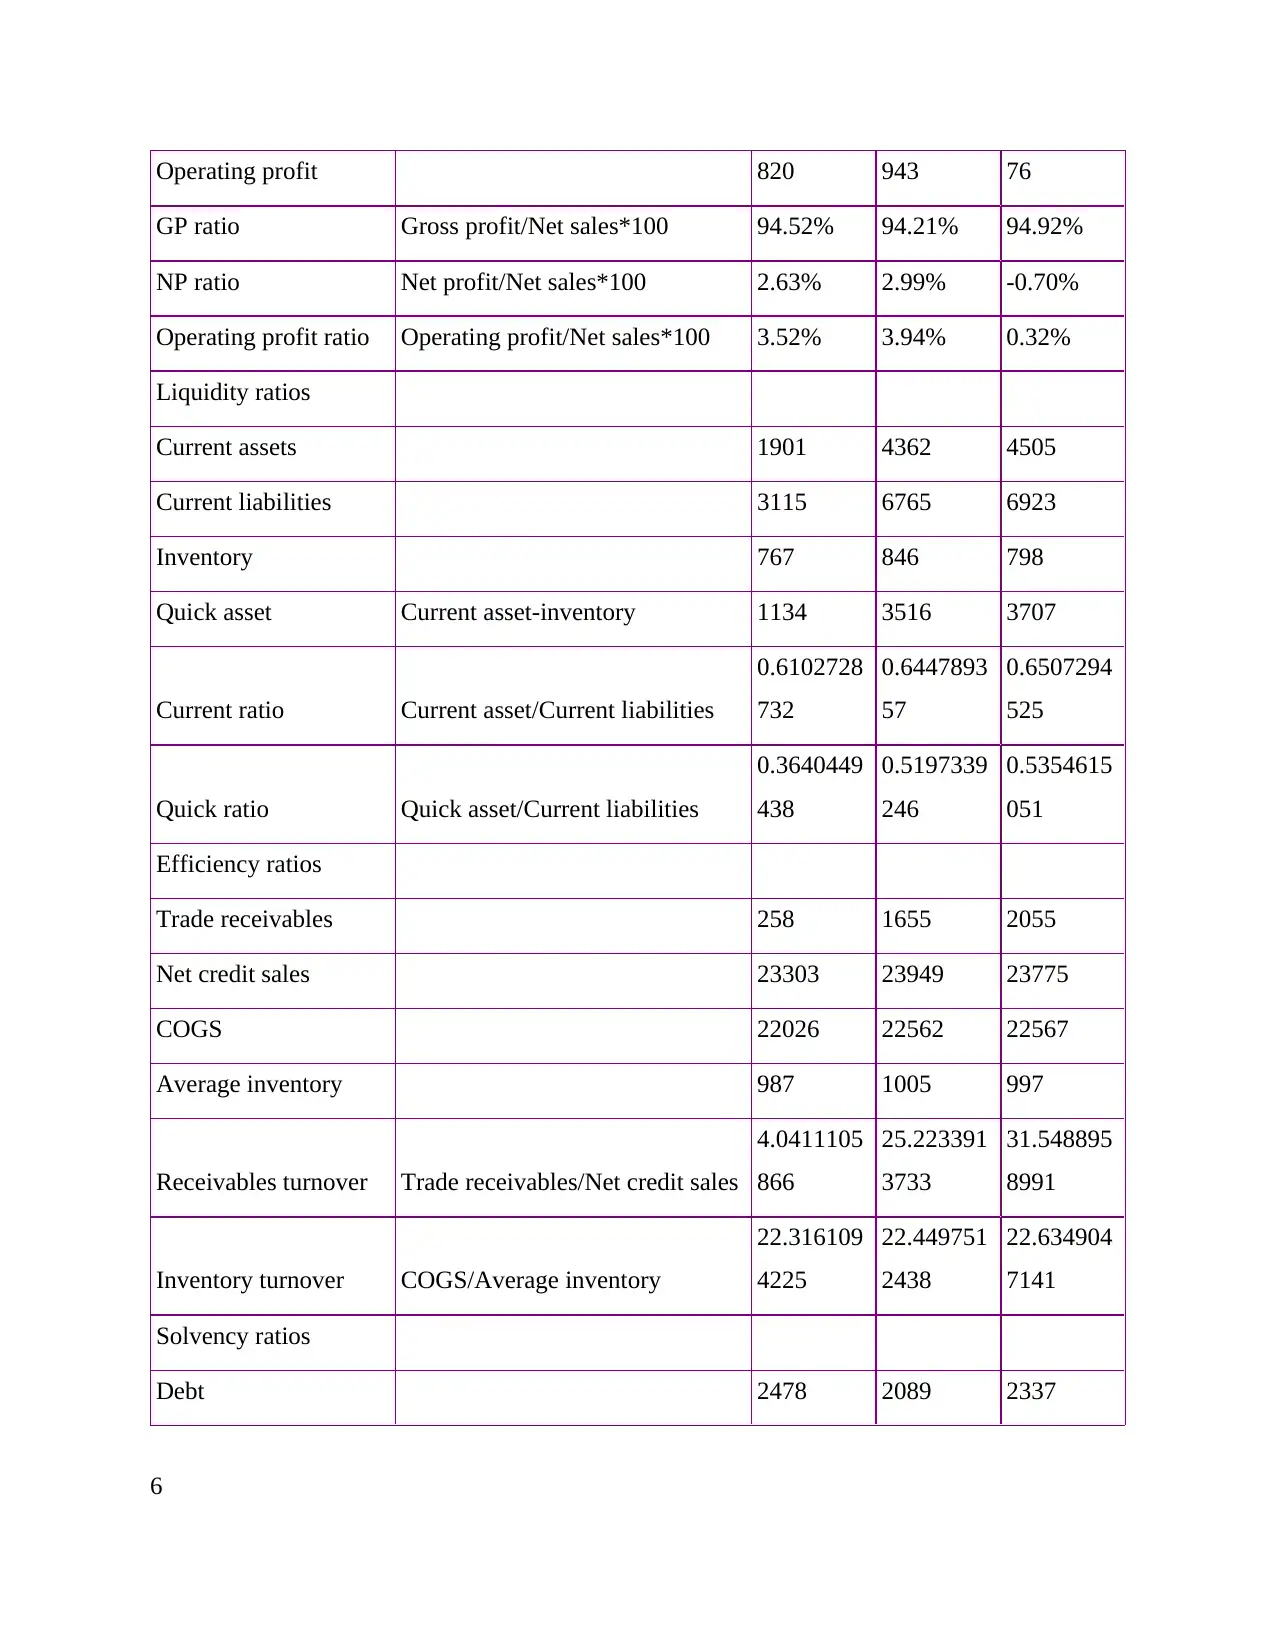
Operating profit 820 943 76
GP ratio Gross profit/Net sales*100 94.52% 94.21% 94.92%
NP ratio Net profit/Net sales*100 2.63% 2.99% -0.70%
Operating profit ratio Operating profit/Net sales*100 3.52% 3.94% 0.32%
Liquidity ratios
Current assets 1901 4362 4505
Current liabilities 3115 6765 6923
Inventory 767 846 798
Quick asset Current asset-inventory 1134 3516 3707
Current ratio Current asset/Current liabilities
0.6102728
732
0.6447893
57
0.6507294
525
Quick ratio Quick asset/Current liabilities
0.3640449
438
0.5197339
246
0.5354615
051
Efficiency ratios
Trade receivables 258 1655 2055
Net credit sales 23303 23949 23775
COGS 22026 22562 22567
Average inventory 987 1005 997
Receivables turnover Trade receivables/Net credit sales
4.0411105
866
25.223391
3733
31.548895
8991
Inventory turnover COGS/Average inventory
22.316109
4225
22.449751
2438
22.634904
7141
Solvency ratios
Debt 2478 2089 2337
6
⊘ This is a preview!⊘
Do you want full access?
Subscribe today to unlock all pages.
Trusted by 1+ million students worldwide
Equity 5733 6003 5539
Debt to equity ratio Debt/equity
0.4322344
322
0.3479926
703
0.4219173
136
Investment ratio
Earning available for
shareholders 614 716 -166
Outstanding shares 10000 10000 10000
EPS
Earning available for equity
shareholders/outstanding shares 0.0614 0.0716 -0.0166
PART 2
Background
The current project report is all about defining various financial statement's in order to
assess its efficiency over the years (Grimm and Blazovich, 2016). Both the companies operating
in the same industry of supermarket sector are taken into consideration for the purpose of
analysis. The marks and Spencer leads all other competitors in the same market by diversifying
its existing business into other sectors (Grant, 2016). On the other hand, the Sainsbury operated
in the supermarket sector has limited market share than compared to the biggest competitor
Tesco. The marks and Spencer have stronger position in relation to the Sainsbury who exists in
the same market and supermarket industry. The aim of the current report is to analyses the
existing performance of an entity by dividing its financial performance into various segments.
Ratio analysis is regarded as one of the important technique used in analyzing the previous year
facts and figures as a standard measure. The budgeted figures are used in order to compare the
actual figures with the standard performance of the business enterprise (Black and Maggina,
2016). The current project report aims for analyzing the existing performance of the business in
relation with the external market benchmarks. The focus of an entity throughout the project
report is to analyze the relationship between internal and external performance of the business.
7
Paraphrase This Document
Need a fresh take? Get an instant paraphrase of this document with our AI Paraphraser
The efficiency of both the companies taken into account in order to form good decisions in the
business to take the investment opportunities.
Financial statement's analysis
The analyzing the current financial statements prepared by an entity owner in order to
remain in the existing market along with all the rivals. It is regarded as one of the process of
assessing and analyzing the existing performance in relation with the financial statement's
prepared by an entity. The standard forms of financial statement's includes income statement,
balance sheet and cash flow statement (Aggarwal and Gupta, 2016). The particular techniques
are applied by the business entity in order to evaluates various things such as risks, financial
performance and future scope of an organization. The perspectives of different stakeholders are
taken into consideration such as employees, owner, management, creditors, investors and the
customers. The opinion and consent of all the stakeholders are taken into account in order to
form the best appropriate decisions related to the business.
Financial statement analysis will consider two approaches used by the business owner of
Sainsbury and Marks and Spencer includes horizontal and vertical analysis. The horizontal
analysis will show the previous year increase or decrease in form of percentages from the
previous years (Grimm and Blazovich, 2016). On the other hand, vertical analysis will assess the
single component of the financial statement on the basis of total of financial statement in a
vertical format.
Fundamental analysis is another important tool used in assessing the financial
performance of an entity. It is that process which is based on two different streams such as
accounting and finance which is used to assess the financial statement of the firm. This particular
analysis will assess various components such as assets and liabilities. This analysis will be
performed on past and facts and figures in order to ensure the current efficiency of the financial
resources held by an entity. The stock opening and closing prices are evaluated which, in turn,
increases the chances of the business to invest in a particular company.
Internal and external ratios
The ratio analysis conducted by an organization are further segmented into two different
factors such as internal and external ratios (Grant, 2016). The internal environment refers to all
the factors and events takes places in an entity are under the control of the business entity. There
8
are various factors which can affect an entity's existing business performance in relation with
both the point of view such as internal and external ratios which is given below:
The liquidity ratios will identify the internal ability or deficiency in not paying their bills
and short-term market obligations. The inability of the firm will reveal the inherent risks
involved in the business related to the setting of collection and receivables policy. The invoice
policies set by an entity need to be rectified in order to support an organization in achieving their
project aim.
Other ratios that is the leverage ratios which helps in improving the existing base of
financial resources held by an entity in order to meet its existing market obligations (Arif, Noor-
E-Jannat and Anwar, 2016). The stability in this kind of ratios will be beneficial for the business
entity. The biggest risks faced by an entity is the failure of the business due to deflated results
produce by an entity during a financial year.
Profitability ratios which shows the profit earned by an entity in a year after meeting
various kinds of expenses. The risks faced by the corporation due to decreasing profitability is
lower customer satisfaction which reduces the sales and profit earned by the business entity. The
management problems occurred in a business related with the management of overall inventory
create further business problems. The problems or issue faced by an entity in relation with these
ratios is the risk of market failure by contracting the total market share. The other risks faced by
these individuals involves compliance risks, training needs and various maintenance
requirements to be fulfilled by an entity in relation with external market.
9
⊘ This is a preview!⊘
Do you want full access?
Subscribe today to unlock all pages.
Trusted by 1+ million students worldwide
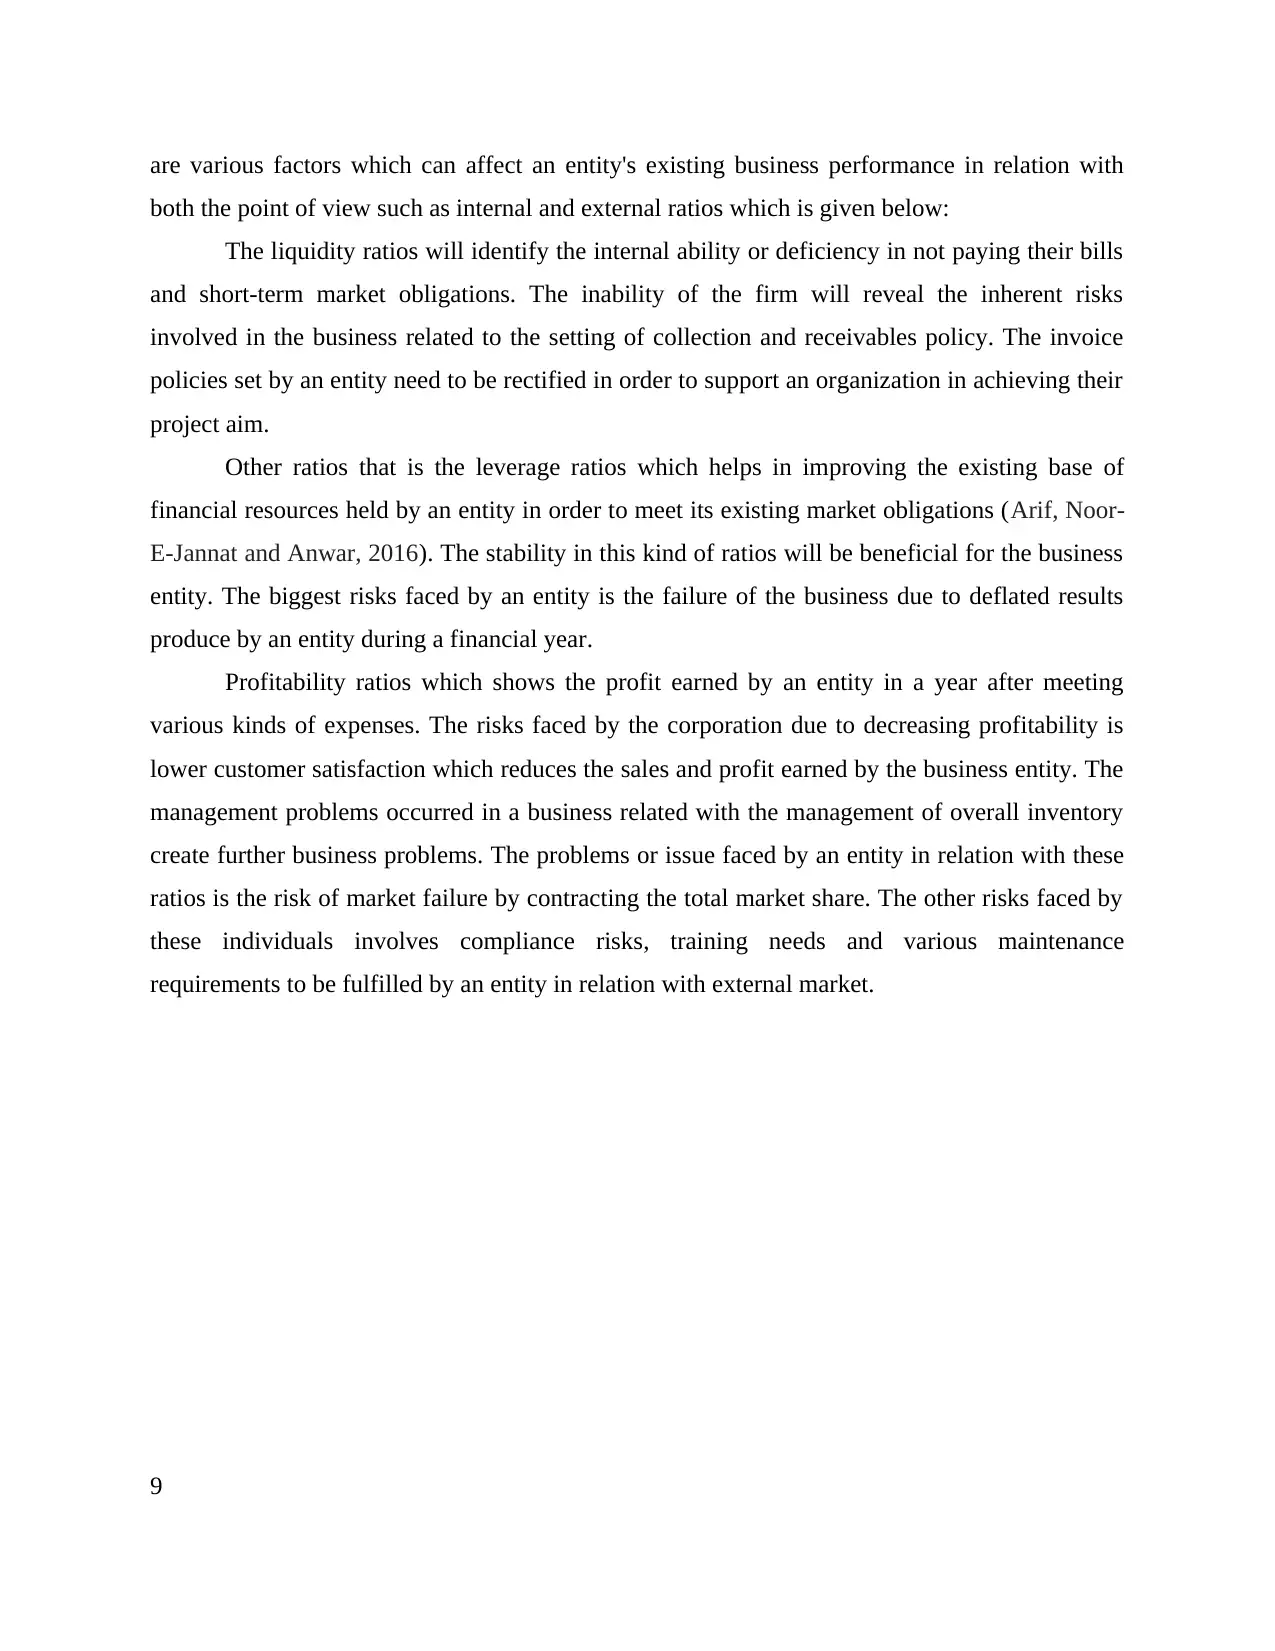
Ratios interpretation
M&S Sainsbury
0
0.1
0.2
0.3
0.4
0.5
0.6
0.7
0.8
0.9
1
37.87%
94.52%
37.55%
94.21%
38.66%
94.92%
GP ratios
2013
2014
2015
Interpretation
The gross profit is regarded as the raw amount of profit generated by an enterprise by
deducting cost of sales from the sales figure (Grant, 2016). The Sainsbury has gradually
increases its ratio over the year by showing significant increase than M&S. On the other hand,
M&S is showing its deficiencies by generating decreasing ratios due to the burden of cost of
sales.
10
Paraphrase This Document
Need a fresh take? Get an instant paraphrase of this document with our AI Paraphraser
M&S Sainsbury
-0.01
0
0.01
0.02
0.03
0.04
0.05
0.06
4.66%
2.63%
5.09%
2.99%
4.72%
-0.70%
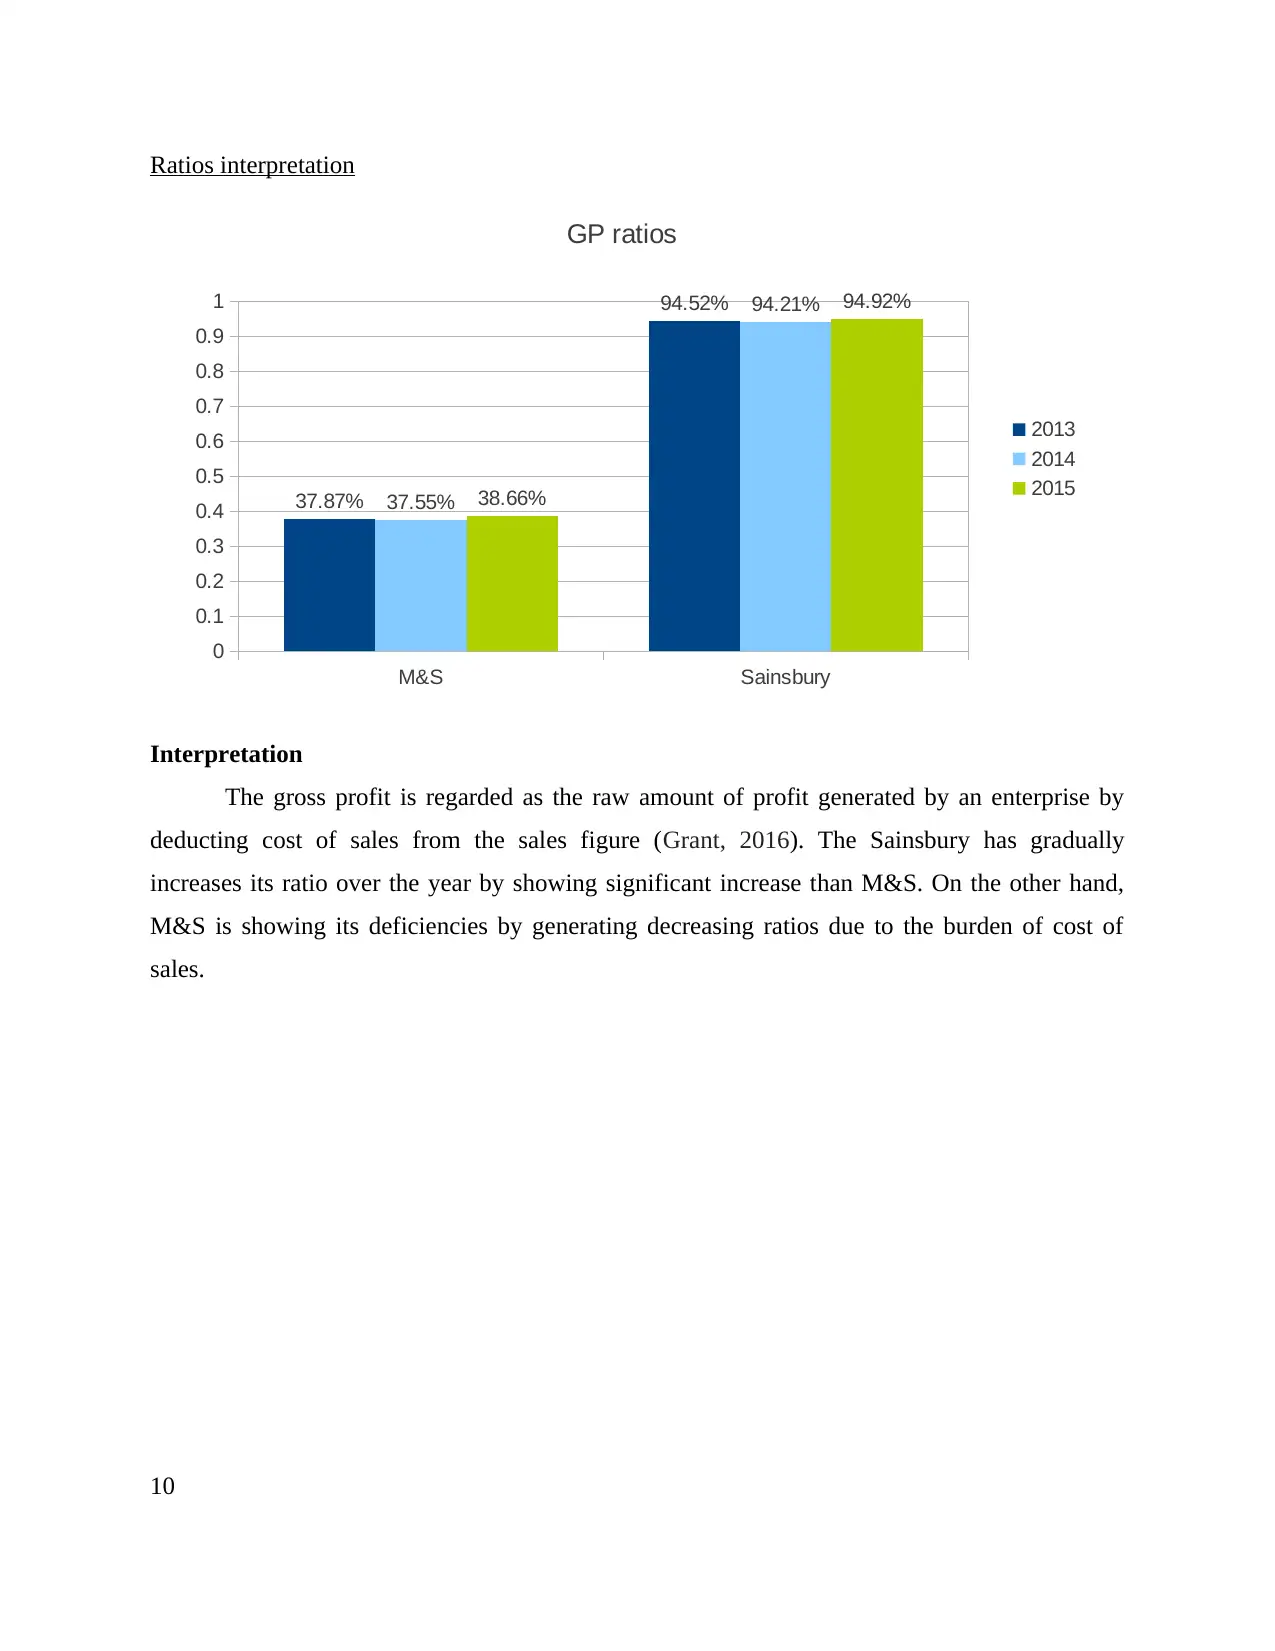
NP Ratio
2013
2014
2015
Interpretation
This is regarded as the complete profit by deducting all kinds of expenses from the figure
of sales and the taxation amount. The M&S has generated deflating results by increasing or
decreasing but stable position in the external market. On the other side, Sainsbury falls
downward by showing negative figure.
11
-0.01
0
0.01
0.02
0.03
0.04
0.05
0.06
4.66%
2.63%
5.09%
2.99%
4.72%
-0.70%
NP Ratio
2013
2014
2015
Interpretation
This is regarded as the complete profit by deducting all kinds of expenses from the figure
of sales and the taxation amount. The M&S has generated deflating results by increasing or
decreasing but stable position in the external market. On the other side, Sainsbury falls
downward by showing negative figure.
11
M&S Sainsbury
0
0.01
0.02
0.03
0.04
0.05
0.06
0.07 6.62%
3.52%
5.81%
3.94%
6.01%
0.32%
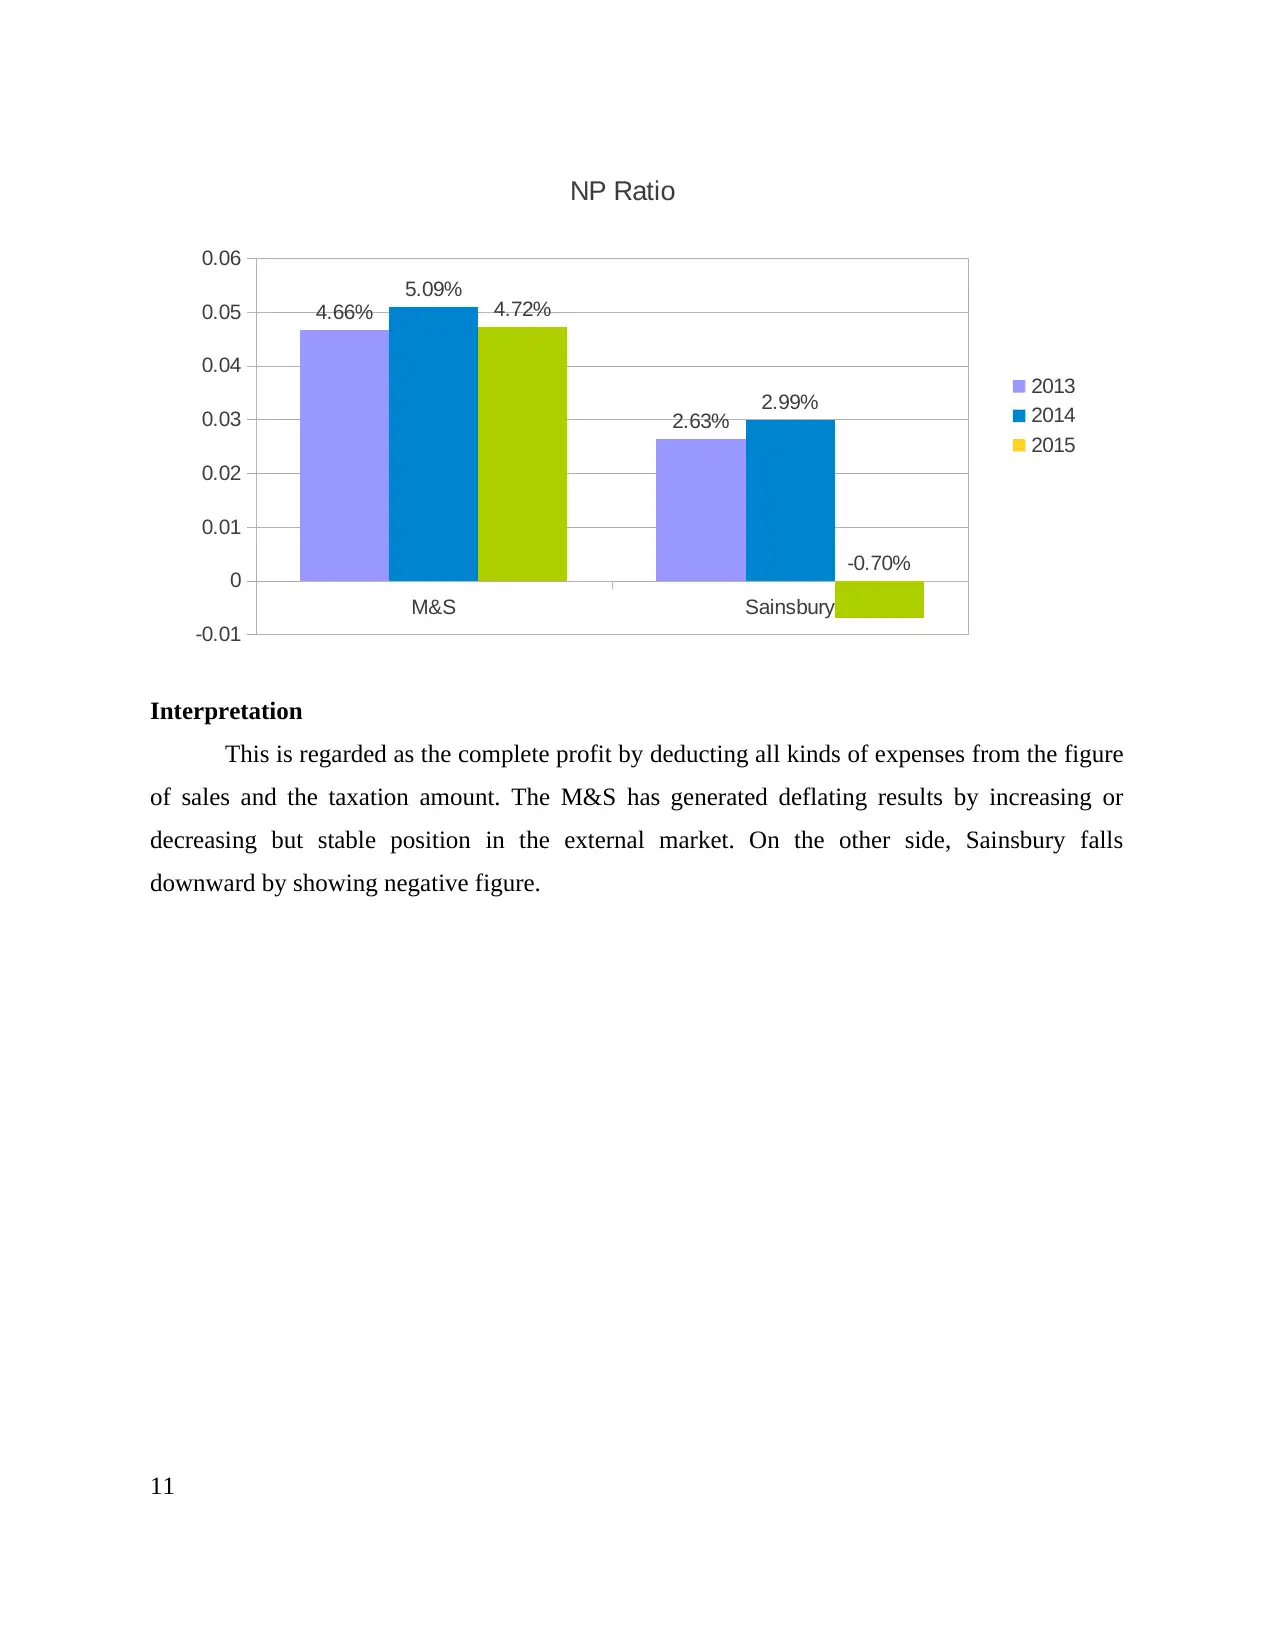
OP Ratio
2013
2014
2015
Interpretation
The operating profit is obtained after meeting all operating expenses incurred by the
business entity (Kim, Li, Lu and Yu, 2016). The results of M&S are declining towards the
bottom position by showing higher chances of improving their existing performance. On the
other side, the operating profit of Sainsbury is declining by incurring higher operating expenses.
12
0
0.01
0.02
0.03
0.04
0.05
0.06
0.07 6.62%
3.52%
5.81%
3.94%
6.01%
0.32%
OP Ratio
2013
2014
2015
Interpretation
The operating profit is obtained after meeting all operating expenses incurred by the
business entity (Kim, Li, Lu and Yu, 2016). The results of M&S are declining towards the
bottom position by showing higher chances of improving their existing performance. On the
other side, the operating profit of Sainsbury is declining by incurring higher operating expenses.
12
⊘ This is a preview!⊘
Do you want full access?
Subscribe today to unlock all pages.
Trusted by 1+ million students worldwide
1 out of 22
Related Documents


Your All-in-One AI-Powered Toolkit for Academic Success.
+13062052269
info@desklib.com
Available 24*7 on WhatsApp / Email
![[object Object]](/_next/static/media/star-bottom.7253800d.svg)
Unlock your academic potential
Copyright © 2020–2026 A2Z Services. All Rights Reserved. Developed and managed by ZUCOL.