Comprehensive Financial Analysis Report: SPECIALITY FASHION GROUP
VerifiedAdded on 2020/05/11
|21
|5933
|297
Report
AI Summary
This report presents a comprehensive financial analysis of SPECIALITY FASHION GROUP Limited, evaluating its financial performance, profitability, and stability for the years 2014, 2015, and 2016. The analysis employs various methods, including horizontal analysis, vertical analysis, and ratio analysis, to assess changes in financial figures, trends, and key performance indicators. The report examines the company's income statement, balance sheet, and cash flow statement, highlighting significant alterations in revenue, costs, assets, liabilities, and cash management activities. Furthermore, it delves into liquidity, profitability, and gearing ratios to provide a holistic understanding of the company's financial position and offer recommendations for improvement. The conclusion emphasizes the need for strategic adjustments to enhance the company's financial health and sustainability, supported by references to relevant sources.
RUNNING HEAD: Financial analysis report
1
Accounting financial analysis Report
1
Accounting financial analysis Report
Paraphrase This Document
Need a fresh take? Get an instant paraphrase of this document with our AI Paraphraser
Financial analysis report 2
Executive summary
It has been emphasised in this report that how the financial statement of a company
could be analyzed. For preparing this report, SPECIALITY FASHION GROUP LIMITED
has been analyzed. For analyzing the final financial statement of the company, various
methods have been used in this report. Annual reports, notes, director’s report, changes in the
internal and external factors etc have been analyzed for this report. SPECIALITY FASHION
GROUP LIMITED’s financial statement has been analyzed through conducting this study
over horizontal analysis, vertical analysis, ratio analysis etc. These tools assist the user in
identifying the changes from last year in this year and the changes into other expenses in
comparison of one expense.
Financial analysis report 3
Contents
Introduction.......................................................................................................................4
Financial Analysis............................................................................................................4
Horizontal analysis.......................................................................................................4
Vertical analysis............................................................................................................6
Financial ratio analysis.................................................................................................6
Conclusion........................................................................................................................8
References.........................................................................................................................9
Appendix.........................................................................................................................10
⊘ This is a preview!⊘
Do you want full access?
Subscribe today to unlock all pages.
Trusted by 1+ million students worldwide
Financial analysis report 4
Introduction:
This study has been emphasized on various financial information of the company in
terms of performance, profitability; stability etc. for this report, SPECIALITY FASHION
GROUP LIMITED has been taken into the context. It has been explained in this report that
how this company is managing and performing its financial activities and functions in year
2016 in comparison with 2015 and 2014 (Home, 2017). Analysis of Financial statement is a
study that is used to analyze the various statements, activities etc of the company. For this
study, various methods, tools and techniques have been used to identify the stability and
performance of the firm so that a quick and better conclusion could be prepared by the firm
as well as the shareholders and other stakeholders to direct the decisions. Normally, for this
examination, balance sheet, profit and loss account and cash flow statements has been taken
into the context.
Financial Analysis:
Financial analysis is a study which is used by the analyst and the shareholders of the
company to manage the financial activity of the company. Mainly, accounting and financial
analysis study has been performed in the financial analysis. It explains about various position
of the company such as stability, viability, profitability of a firm of a firm. This report is
investigated by the analysts. Mainly, ratio analysis, horizontal analysis and Vertical analysis
have been done in this study (Romney, Steinbart, Zhang and Xu, 2006). This examination is
mainly done by the financial analyst and these reports are presented to the directors and the
management of the company to make a decision about performance, viability and financial
stability of the firm. Below techniques and methods have been taken into the context to
analyze the performance, stability and viability of the SPECIALITY FASHION GROUP
LIMITED:
Horizontal analysis:
Horizontal analysis is a method of analyzing the financial statement. This study of
horizontal analysis express about various changes into the financial statement especially in a
period. This investigation is useful for the company and the analyst to evaluate the trend
condition and situation of SPECIALITY FAHSION GROUP LIMITED. In this analysis,
normally 2 years or more than that are taken into context. For this analysis, earliest year is
taken as a base year; further years data are analyzed according to the base year. Changes are
Paraphrase This Document
Need a fresh take? Get an instant paraphrase of this document with our AI Paraphraser
Financial analysis report 5
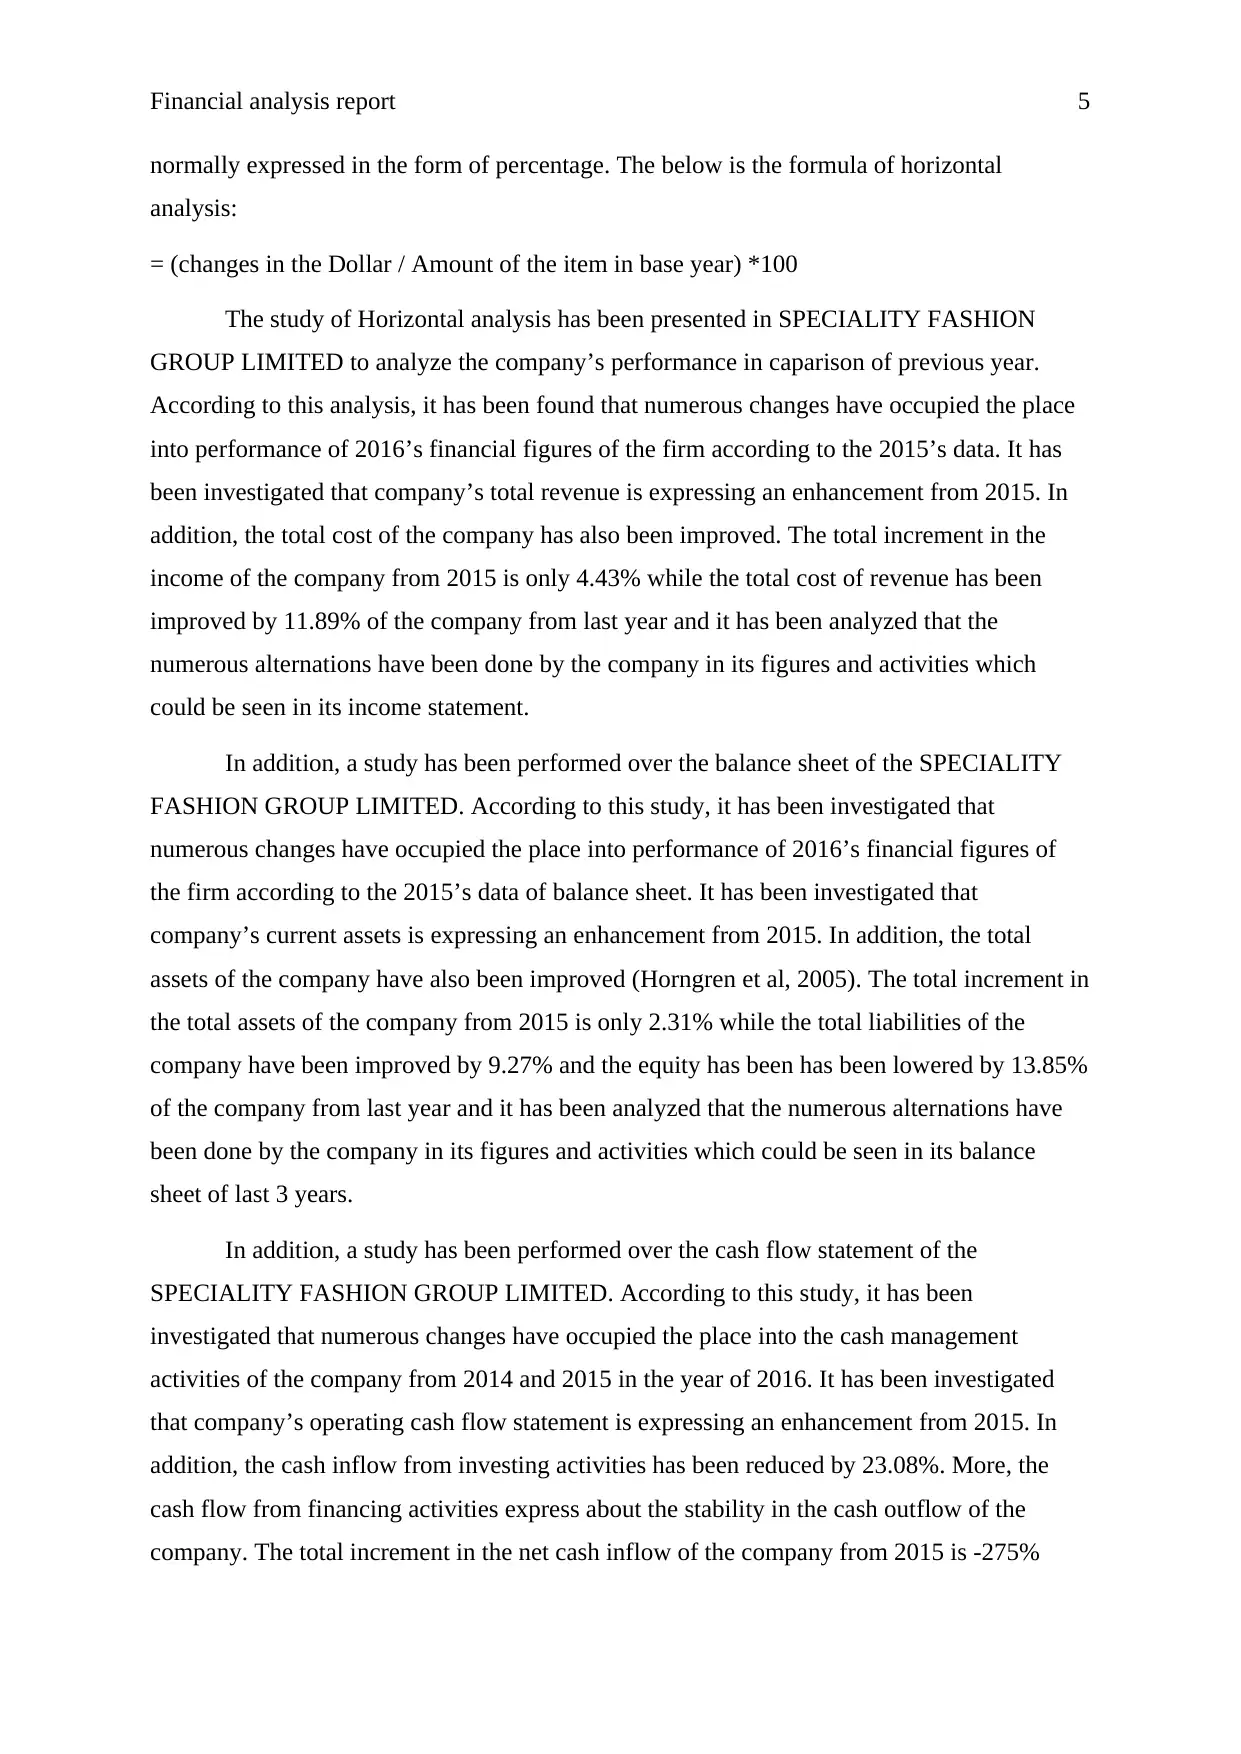
normally expressed in the form of percentage. The below is the formula of horizontal
analysis:
= (changes in the Dollar / Amount of the item in base year) *100
The study of Horizontal analysis has been presented in SPECIALITY FASHION
GROUP LIMITED to analyze the company’s performance in caparison of previous year.
According to this analysis, it has been found that numerous changes have occupied the place
into performance of 2016’s financial figures of the firm according to the 2015’s data. It has
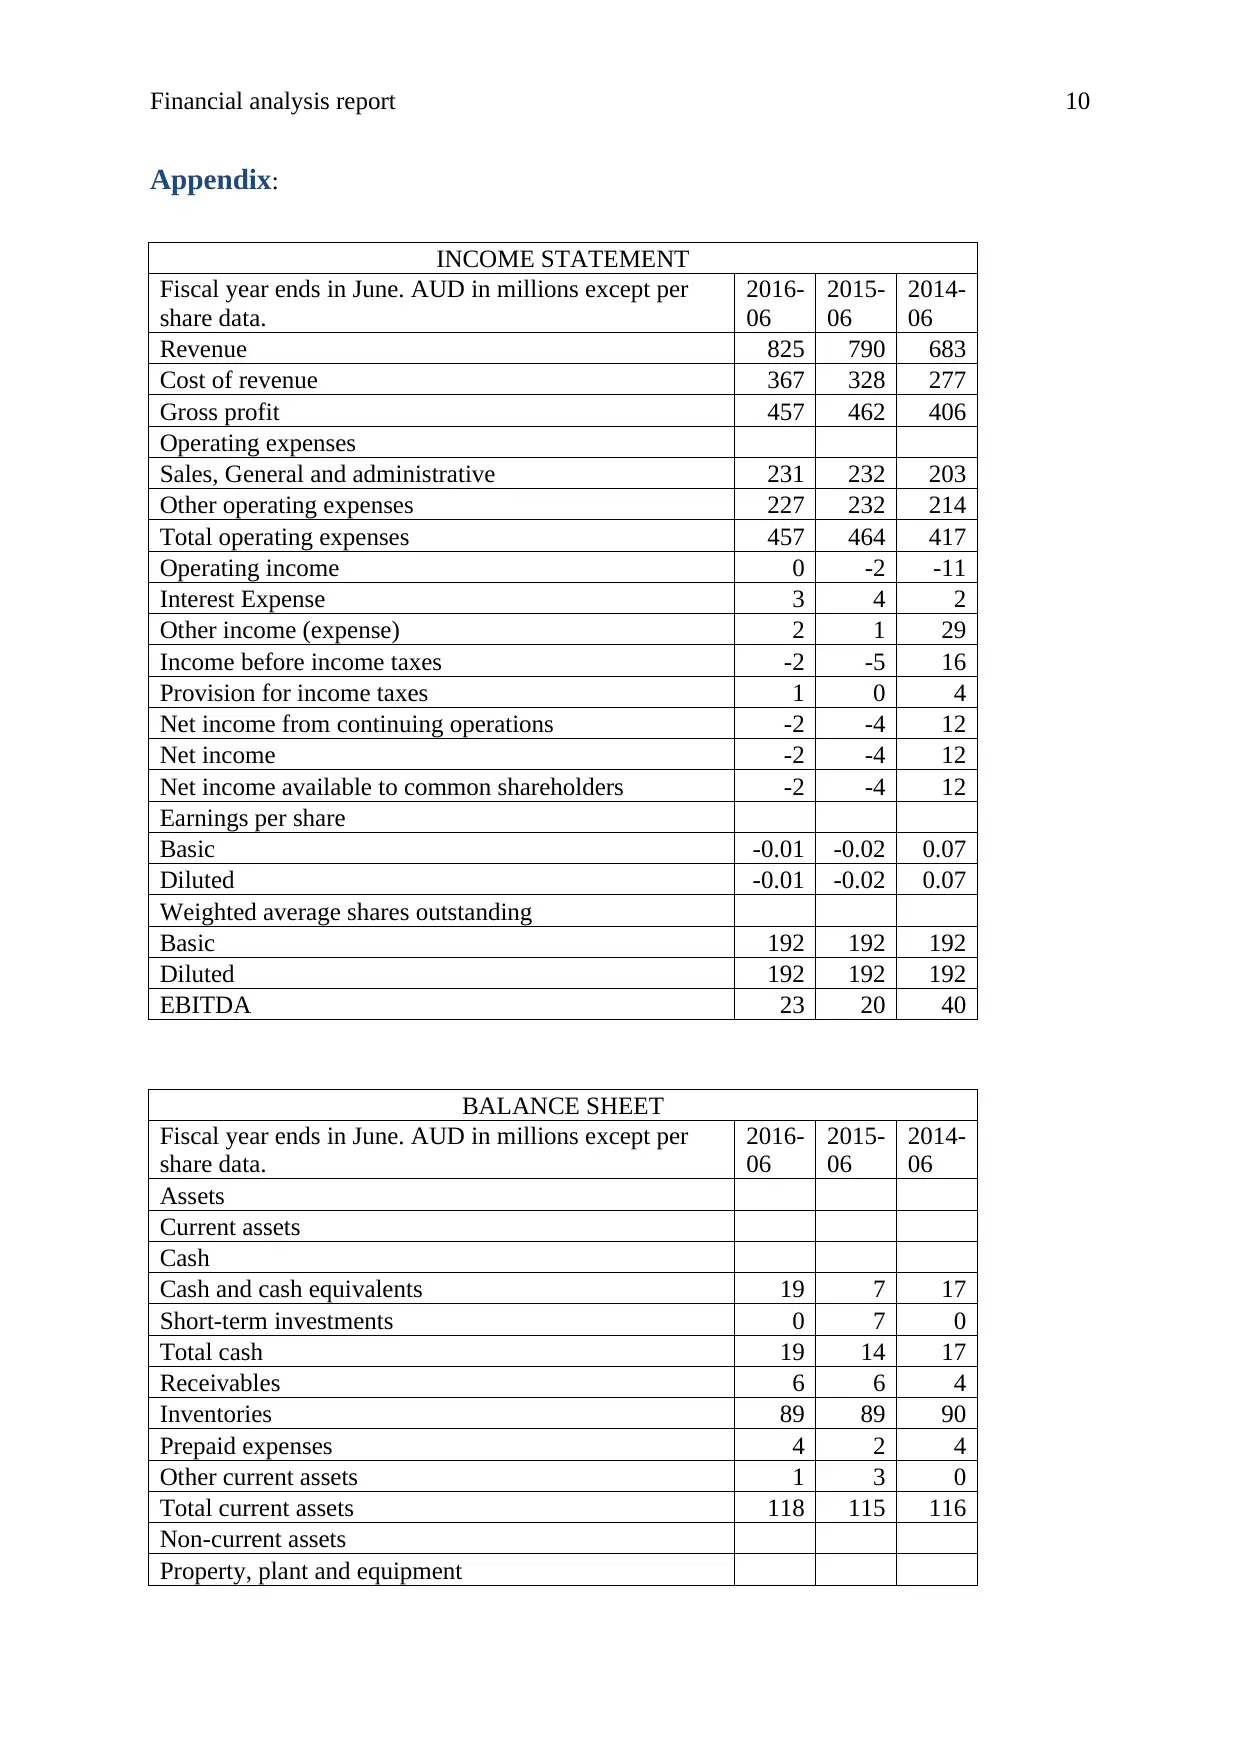
been investigated that company’s total revenue is expressing an enhancement from 2015. In
addition, the total cost of the company has also been improved. The total increment in the
income of the company from 2015 is only 4.43% while the total cost of revenue has been
improved by 11.89% of the company from last year and it has been analyzed that the
numerous alternations have been done by the company in its figures and activities which
could be seen in its income statement.
In addition, a study has been performed over the balance sheet of the SPECIALITY
FASHION GROUP LIMITED. According to this study, it has been investigated that
numerous changes have occupied the place into performance of 2016’s financial figures of
the firm according to the 2015’s data of balance sheet. It has been investigated that
company’s current assets is expressing an enhancement from 2015. In addition, the total
assets of the company have also been improved (Horngren et al, 2005). The total increment in
the total assets of the company from 2015 is only 2.31% while the total liabilities of the
company have been improved by 9.27% and the equity has been has been lowered by 13.85%
of the company from last year and it has been analyzed that the numerous alternations have
been done by the company in its figures and activities which could be seen in its balance
sheet of last 3 years.
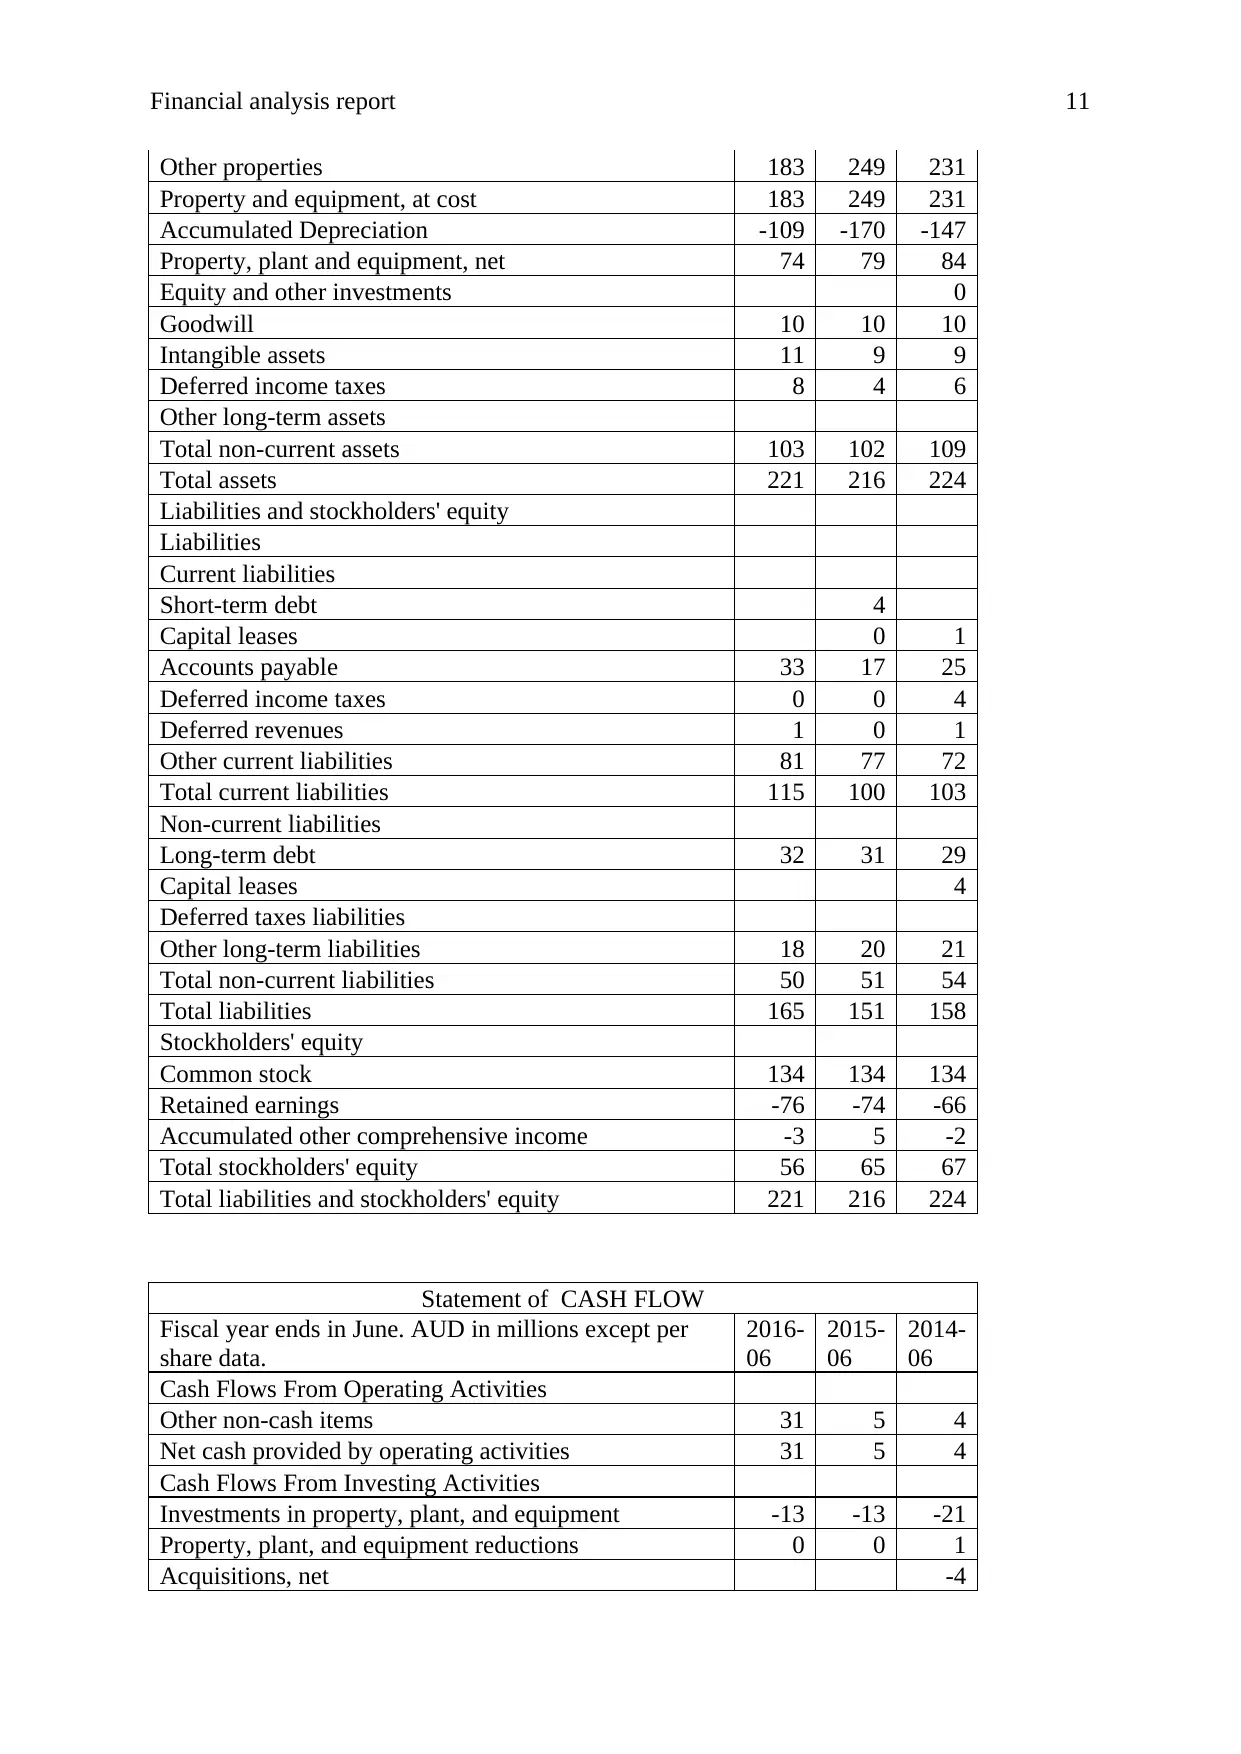
In addition, a study has been performed over the cash flow statement of the
SPECIALITY FASHION GROUP LIMITED. According to this study, it has been
investigated that numerous changes have occupied the place into the cash management
activities of the company from 2014 and 2015 in the year of 2016. It has been investigated
that company’s operating cash flow statement is expressing an enhancement from 2015. In
addition, the cash inflow from investing activities has been reduced by 23.08%. More, the
cash flow from financing activities express about the stability in the cash outflow of the
company. The total increment in the net cash inflow of the company from 2015 is -275%
normally expressed in the form of percentage. The below is the formula of horizontal
analysis:
= (changes in the Dollar / Amount of the item in base year) *100
The study of Horizontal analysis has been presented in SPECIALITY FASHION
GROUP LIMITED to analyze the company’s performance in caparison of previous year.
According to this analysis, it has been found that numerous changes have occupied the place
into performance of 2016’s financial figures of the firm according to the 2015’s data. It has
been investigated that company’s total revenue is expressing an enhancement from 2015. In
addition, the total cost of the company has also been improved. The total increment in the
income of the company from 2015 is only 4.43% while the total cost of revenue has been
improved by 11.89% of the company from last year and it has been analyzed that the
numerous alternations have been done by the company in its figures and activities which
could be seen in its income statement.
In addition, a study has been performed over the balance sheet of the SPECIALITY
FASHION GROUP LIMITED. According to this study, it has been investigated that
numerous changes have occupied the place into performance of 2016’s financial figures of
the firm according to the 2015’s data of balance sheet. It has been investigated that
company’s current assets is expressing an enhancement from 2015. In addition, the total
assets of the company have also been improved (Horngren et al, 2005). The total increment in
the total assets of the company from 2015 is only 2.31% while the total liabilities of the
company have been improved by 9.27% and the equity has been has been lowered by 13.85%
of the company from last year and it has been analyzed that the numerous alternations have
been done by the company in its figures and activities which could be seen in its balance
sheet of last 3 years.
In addition, a study has been performed over the cash flow statement of the
SPECIALITY FASHION GROUP LIMITED. According to this study, it has been
investigated that numerous changes have occupied the place into the cash management
activities of the company from 2014 and 2015 in the year of 2016. It has been investigated
that company’s operating cash flow statement is expressing an enhancement from 2015. In
addition, the cash inflow from investing activities has been reduced by 23.08%. More, the
cash flow from financing activities express about the stability in the cash outflow of the
company. The total increment in the net cash inflow of the company from 2015 is -275%
Financial analysis report 6
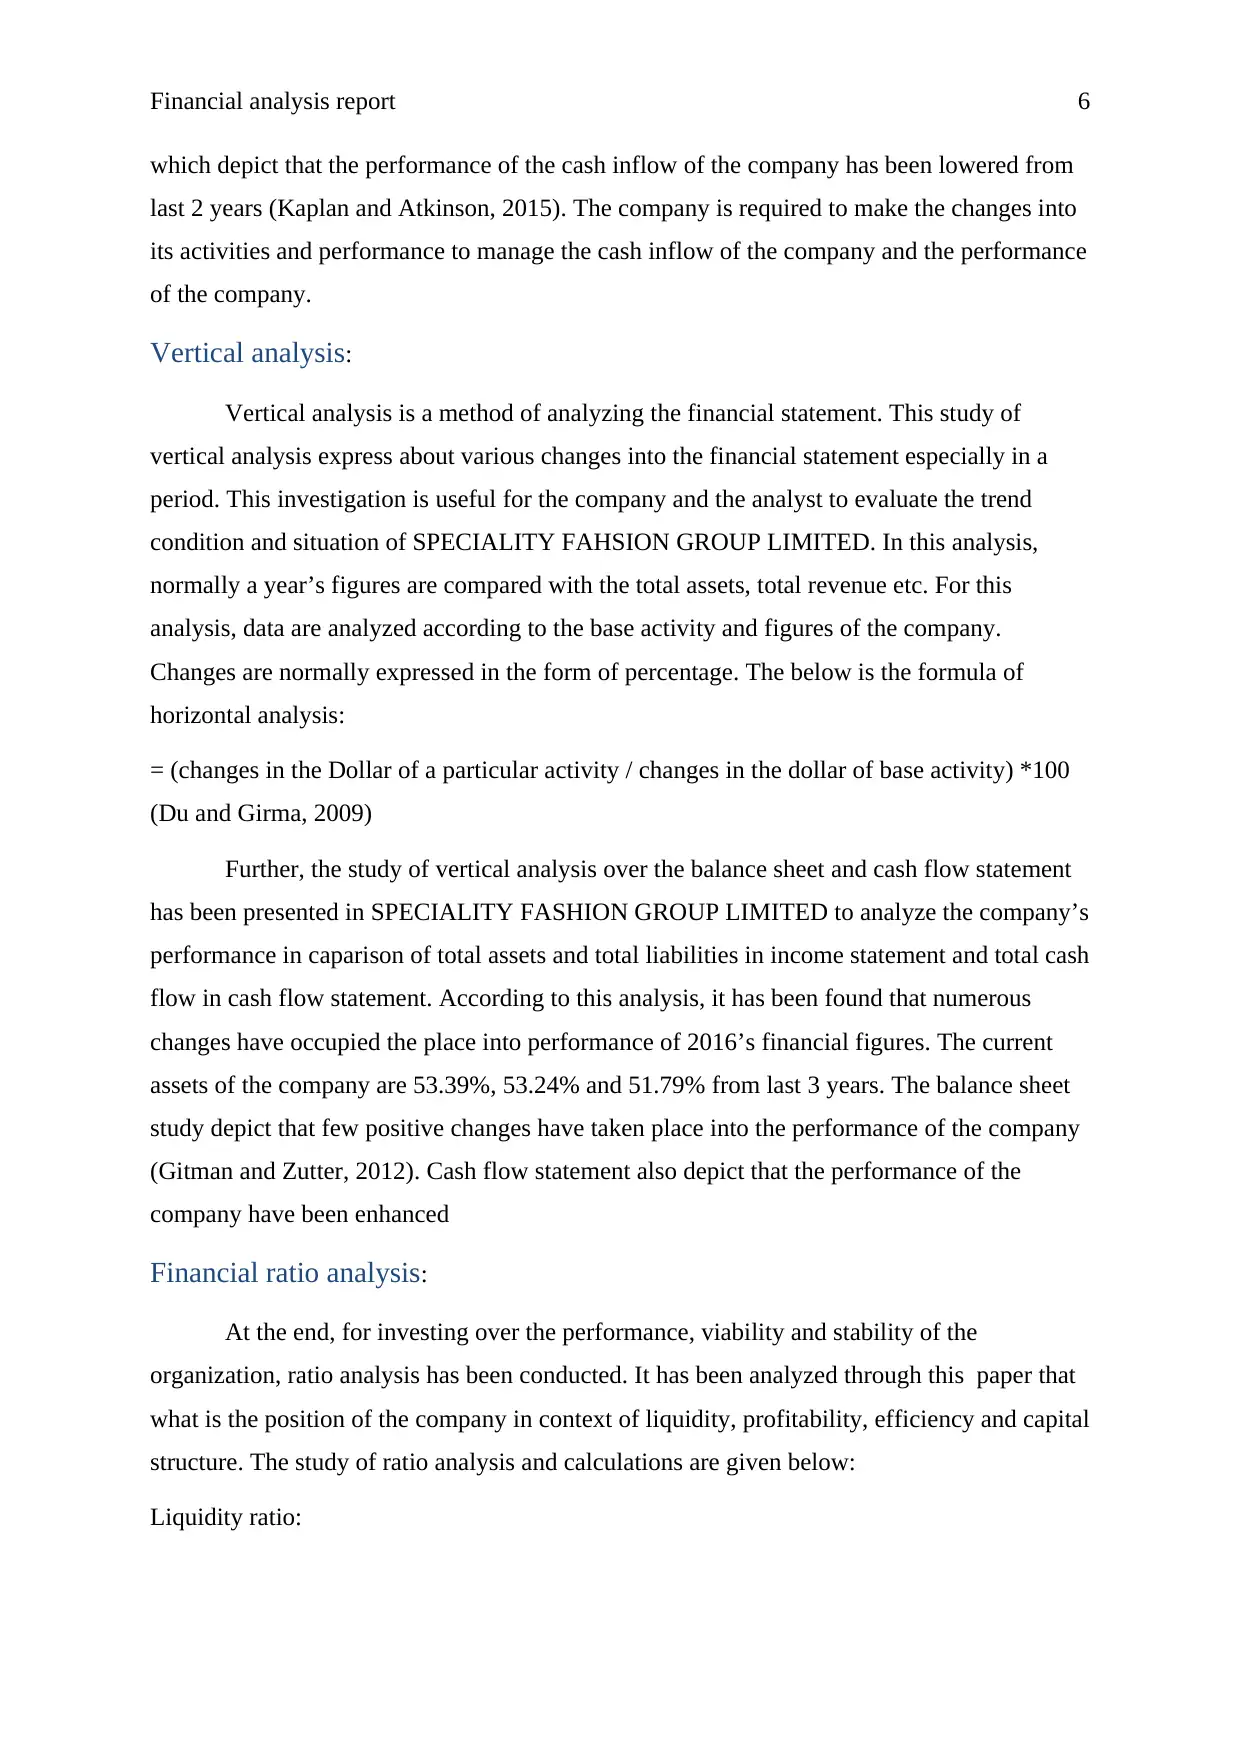
which depict that the performance of the cash inflow of the company has been lowered from
last 2 years (Kaplan and Atkinson, 2015). The company is required to make the changes into
its activities and performance to manage the cash inflow of the company and the performance
of the company.
Vertical analysis:
Vertical analysis is a method of analyzing the financial statement. This study of
vertical analysis express about various changes into the financial statement especially in a
period. This investigation is useful for the company and the analyst to evaluate the trend
condition and situation of SPECIALITY FAHSION GROUP LIMITED. In this analysis,
normally a year’s figures are compared with the total assets, total revenue etc. For this
analysis, data are analyzed according to the base activity and figures of the company.
Changes are normally expressed in the form of percentage. The below is the formula of
horizontal analysis:
= (changes in the Dollar of a particular activity / changes in the dollar of base activity) *100
(Du and Girma, 2009)
Further, the study of vertical analysis over the balance sheet and cash flow statement
has been presented in SPECIALITY FASHION GROUP LIMITED to analyze the company’s
performance in caparison of total assets and total liabilities in income statement and total cash
flow in cash flow statement. According to this analysis, it has been found that numerous
changes have occupied the place into performance of 2016’s financial figures. The current
assets of the company are 53.39%, 53.24% and 51.79% from last 3 years. The balance sheet
study depict that few positive changes have taken place into the performance of the company
(Gitman and Zutter, 2012). Cash flow statement also depict that the performance of the
company have been enhanced
Financial ratio analysis:
At the end, for investing over the performance, viability and stability of the
organization, ratio analysis has been conducted. It has been analyzed through this paper that
what is the position of the company in context of liquidity, profitability, efficiency and capital
structure. The study of ratio analysis and calculations are given below:
Liquidity ratio:
⊘ This is a preview!⊘
Do you want full access?
Subscribe today to unlock all pages.
Trusted by 1+ million students worldwide
Financial analysis report 7
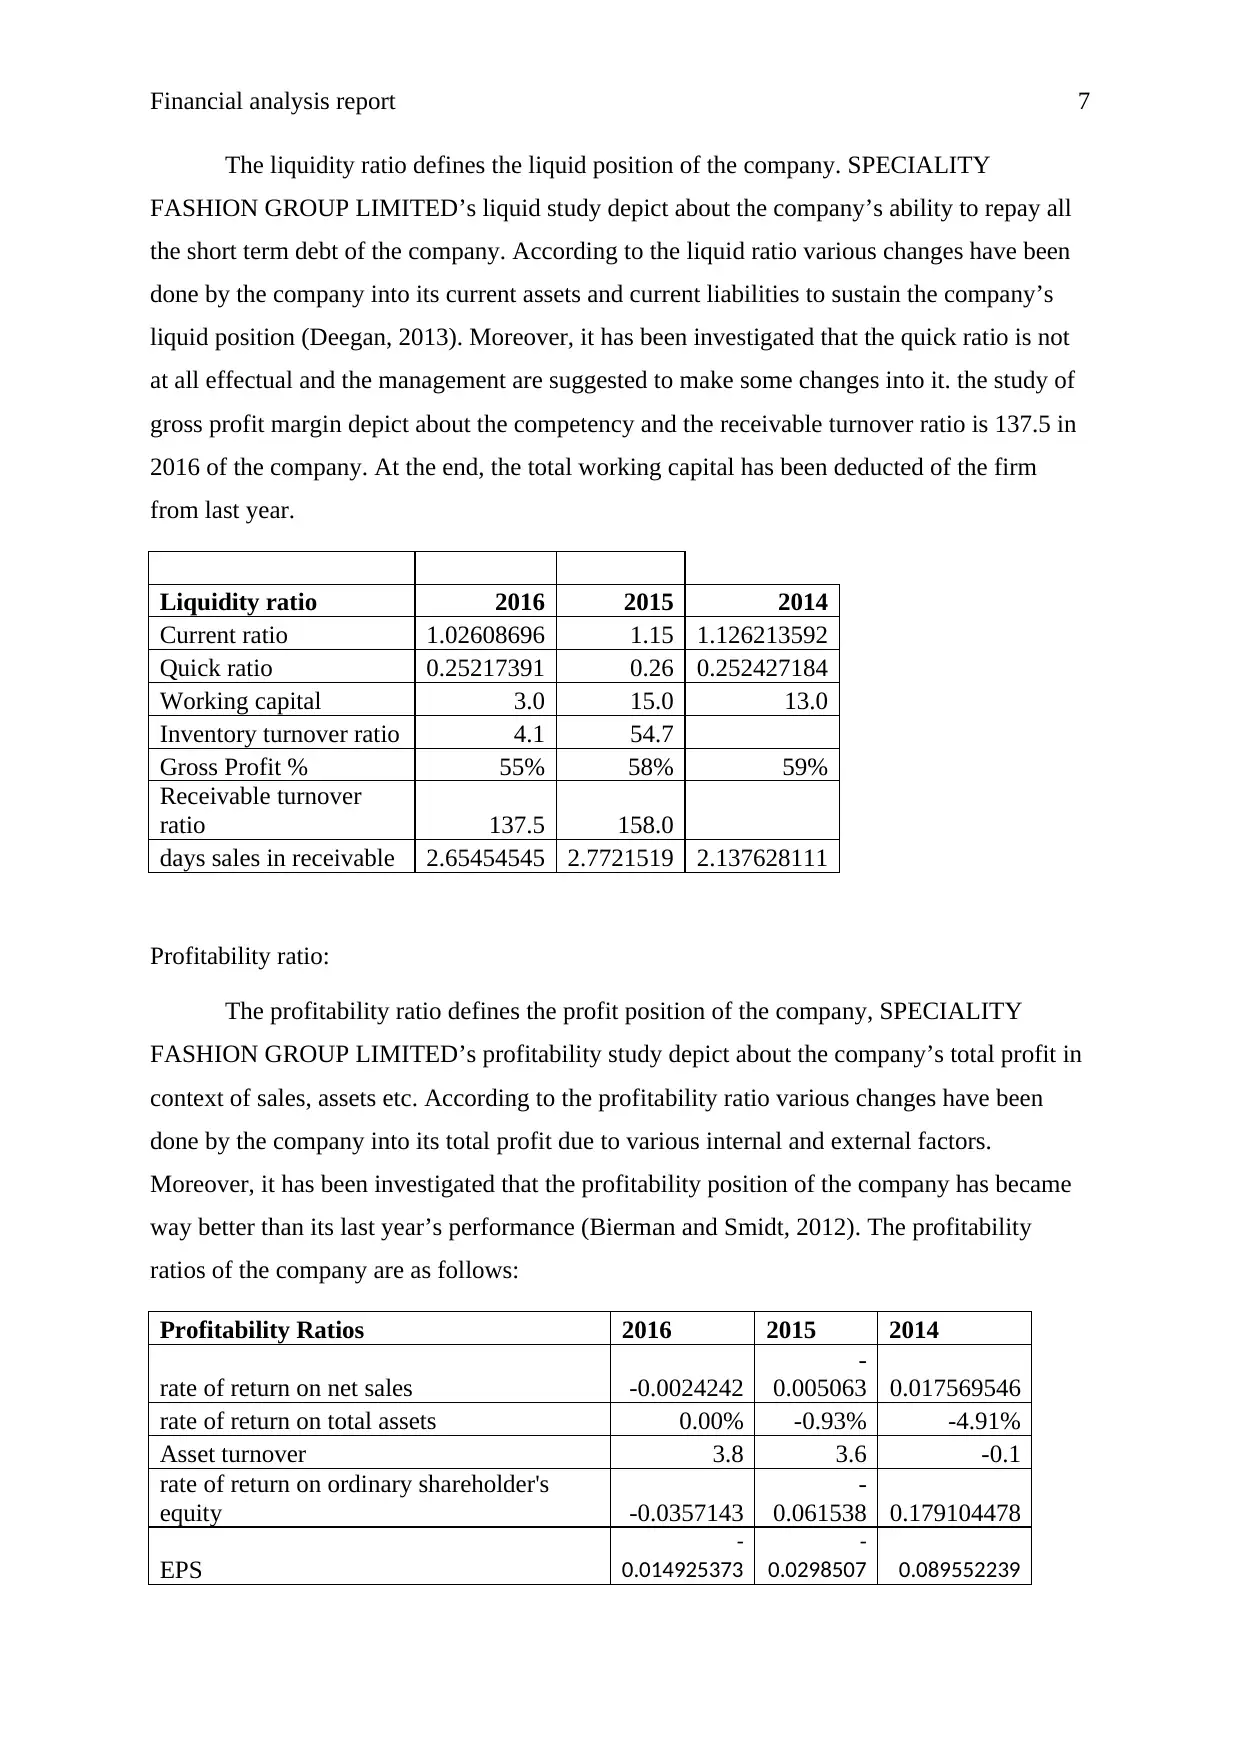
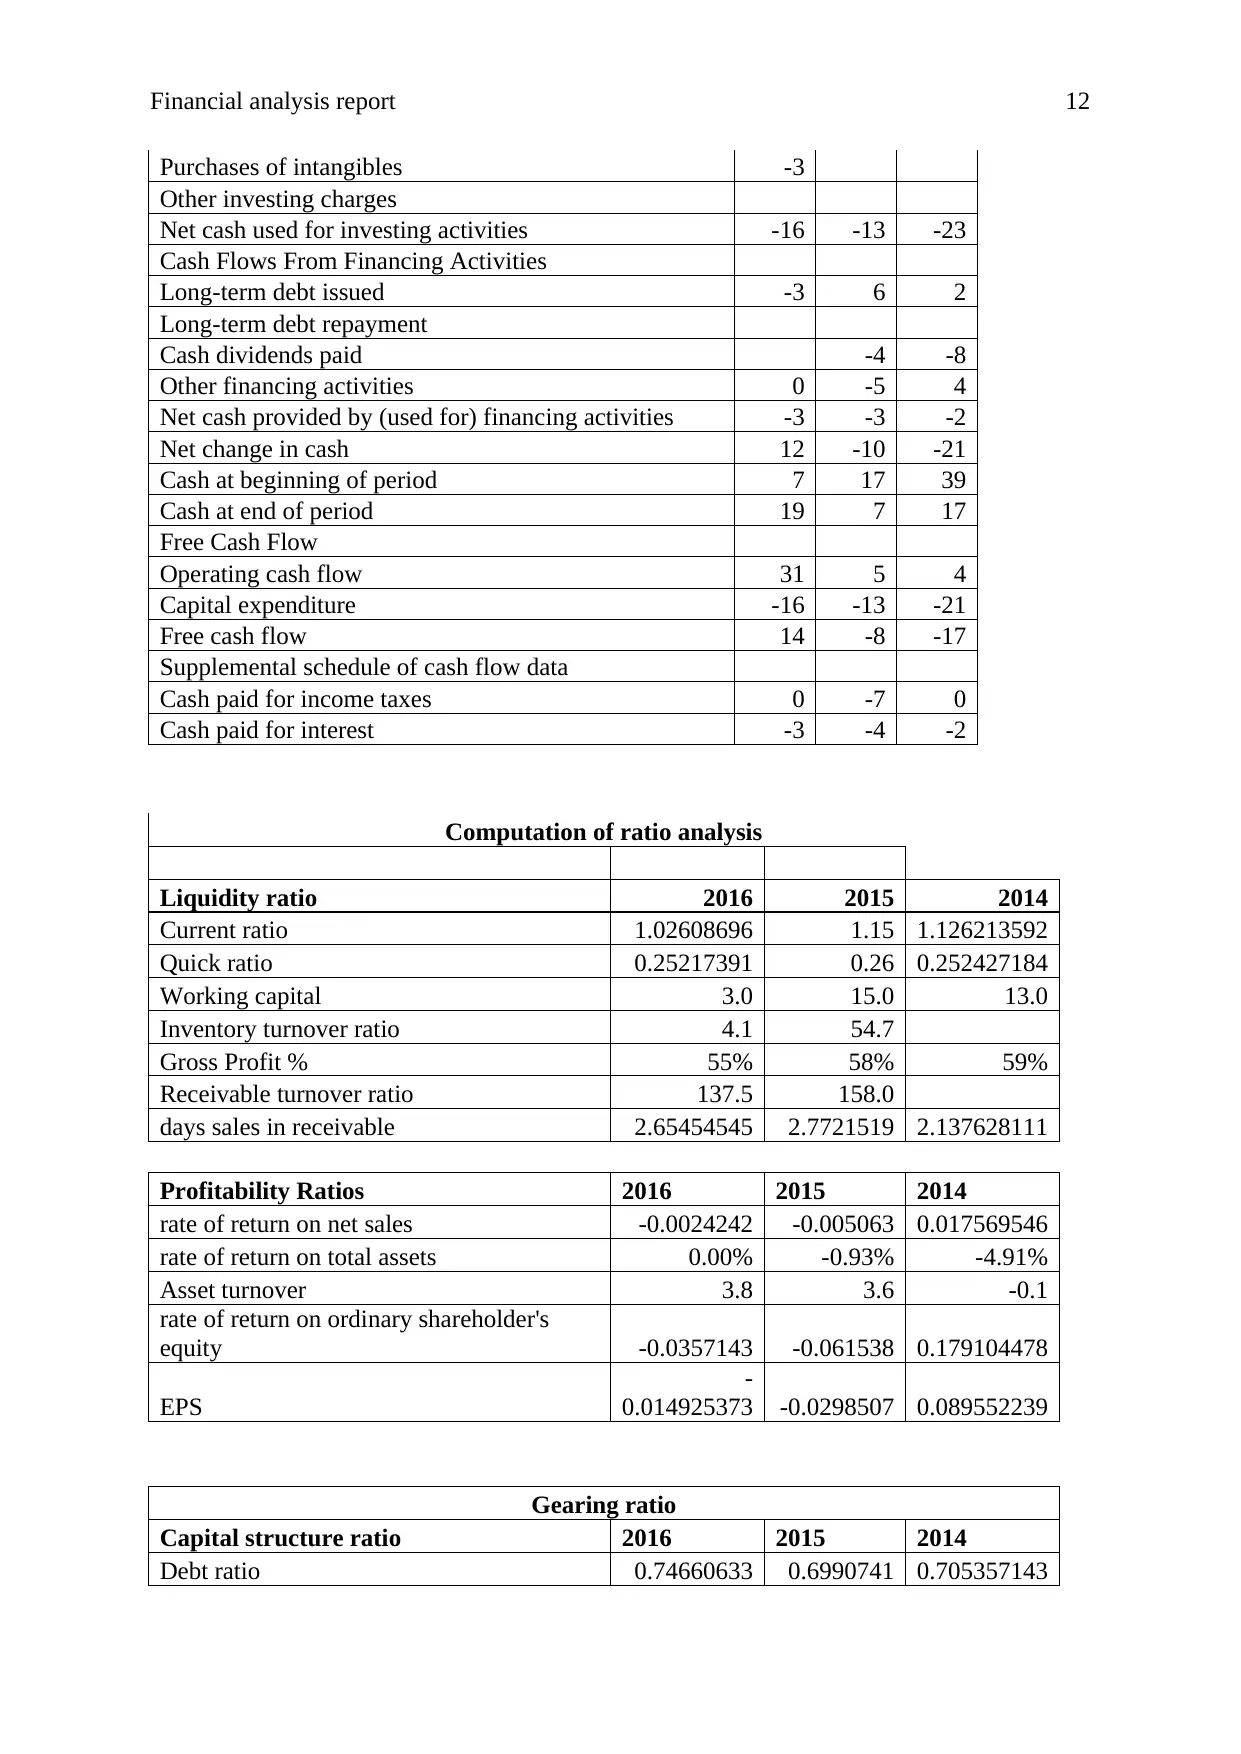
The liquidity ratio defines the liquid position of the company. SPECIALITY
FASHION GROUP LIMITED’s liquid study depict about the company’s ability to repay all
the short term debt of the company. According to the liquid ratio various changes have been
done by the company into its current assets and current liabilities to sustain the company’s
liquid position (Deegan, 2013). Moreover, it has been investigated that the quick ratio is not
at all effectual and the management are suggested to make some changes into it. the study of
gross profit margin depict about the competency and the receivable turnover ratio is 137.5 in
2016 of the company. At the end, the total working capital has been deducted of the firm
from last year.
Liquidity ratio 2016 2015 2014
Current ratio 1.02608696 1.15 1.126213592
Quick ratio 0.25217391 0.26 0.252427184
Working capital 3.0 15.0 13.0
Inventory turnover ratio 4.1 54.7
Gross Profit % 55% 58% 59%
Receivable turnover
ratio 137.5 158.0
days sales in receivable 2.65454545 2.7721519 2.137628111
Profitability ratio:
The profitability ratio defines the profit position of the company, SPECIALITY
FASHION GROUP LIMITED’s profitability study depict about the company’s total profit in
context of sales, assets etc. According to the profitability ratio various changes have been
done by the company into its total profit due to various internal and external factors.
Moreover, it has been investigated that the profitability position of the company has became
way better than its last year’s performance (Bierman and Smidt, 2012). The profitability
ratios of the company are as follows:
Profitability Ratios 2016 2015 2014
rate of return on net sales -0.0024242
-
0.005063 0.017569546
rate of return on total assets 0.00% -0.93% -4.91%
Asset turnover 3.8 3.6 -0.1
rate of return on ordinary shareholder's
equity -0.0357143
-
0.061538 0.179104478
EPS
-
0.014925373
-
0.0298507 0.089552239
Paraphrase This Document
Need a fresh take? Get an instant paraphrase of this document with our AI Paraphraser
Financial analysis report 8
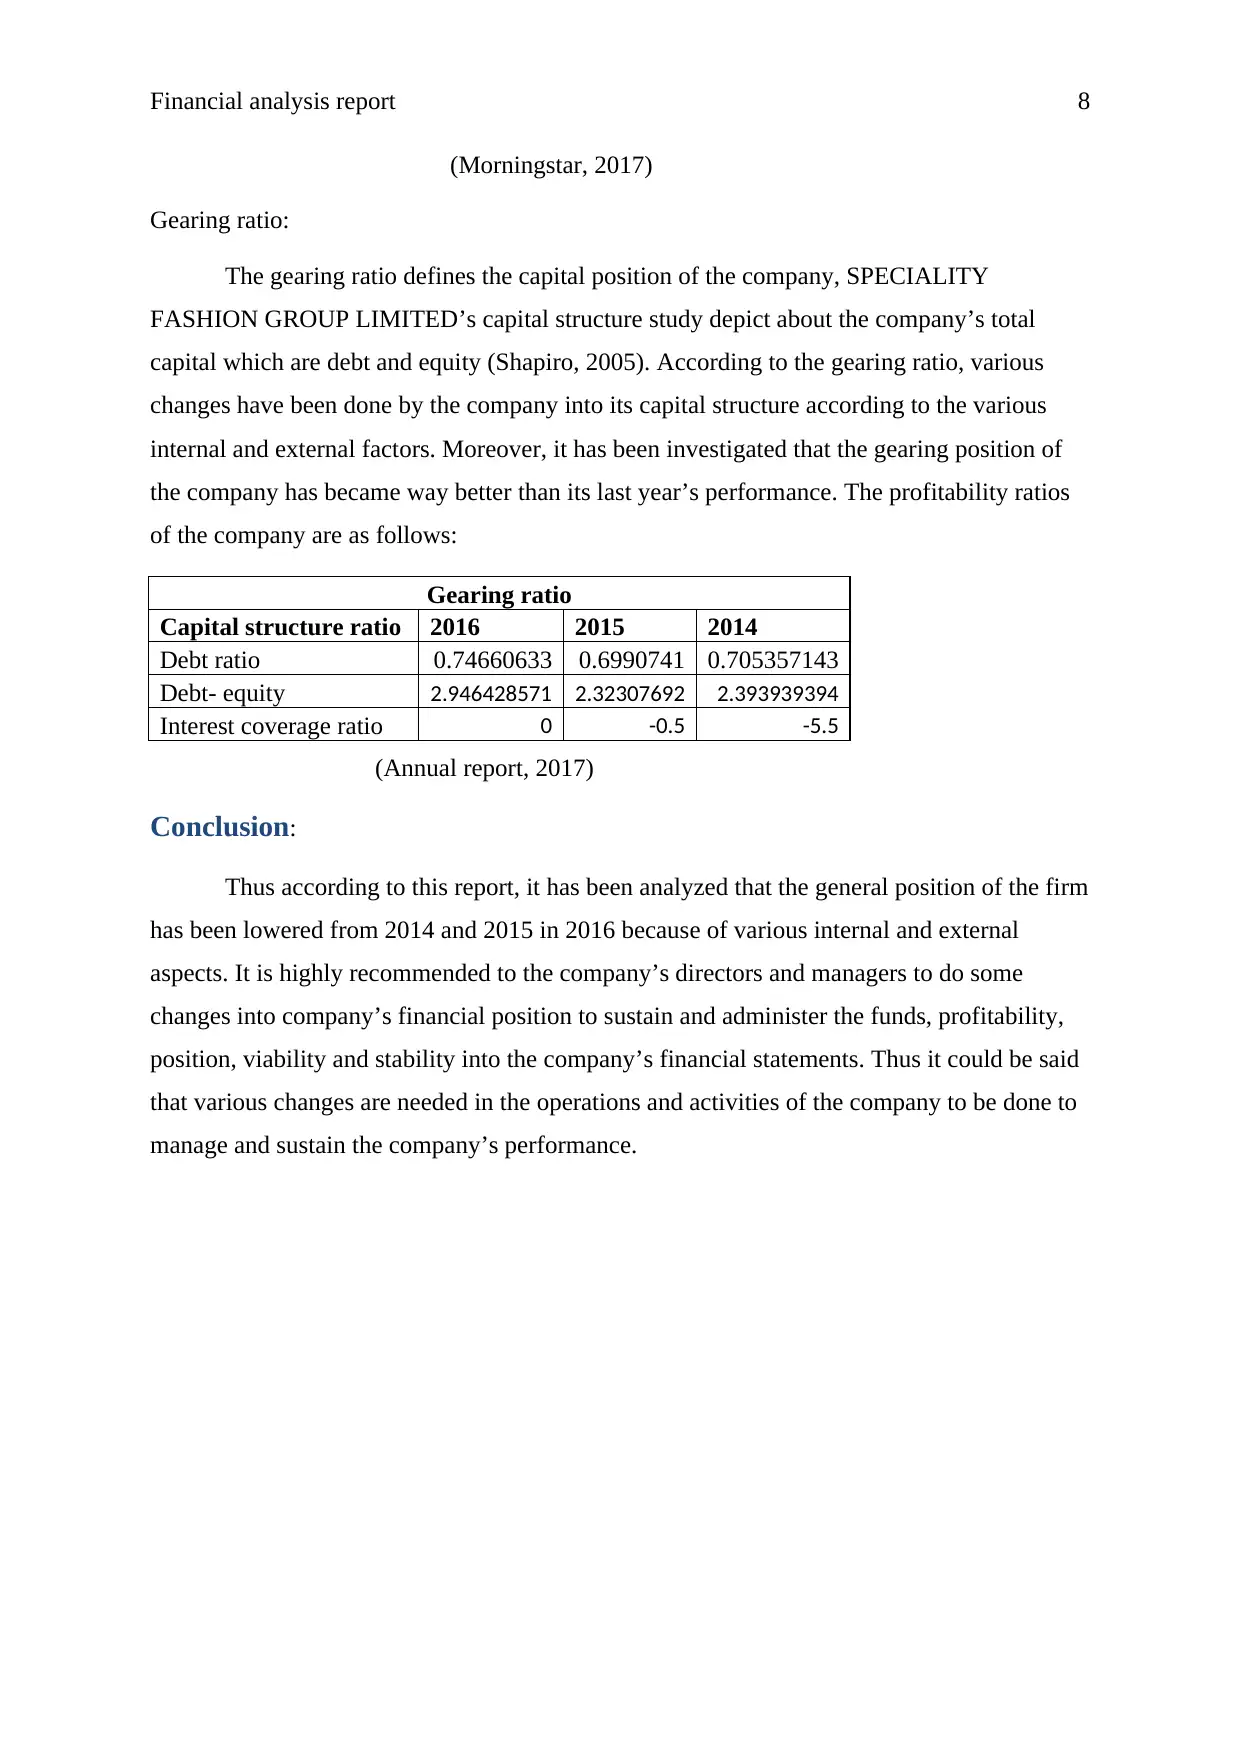
(Morningstar, 2017)
Gearing ratio:
The gearing ratio defines the capital position of the company, SPECIALITY
FASHION GROUP LIMITED’s capital structure study depict about the company’s total
capital which are debt and equity (Shapiro, 2005). According to the gearing ratio, various
changes have been done by the company into its capital structure according to the various
internal and external factors. Moreover, it has been investigated that the gearing position of
the company has became way better than its last year’s performance. The profitability ratios
of the company are as follows:
Gearing ratio
Capital structure ratio 2016 2015 2014
Debt ratio 0.74660633 0.6990741 0.705357143
Debt- equity 2.946428571 2.32307692 2.393939394
Interest coverage ratio 0 -0.5 -5.5
(Annual report, 2017)
Conclusion:
Thus according to this report, it has been analyzed that the general position of the firm
has been lowered from 2014 and 2015 in 2016 because of various internal and external
aspects. It is highly recommended to the company’s directors and managers to do some
changes into company’s financial position to sustain and administer the funds, profitability,
position, viability and stability into the company’s financial statements. Thus it could be said
that various changes are needed in the operations and activities of the company to be done to
manage and sustain the company’s performance.
Financial analysis report 9
References:
Annual report. 2017. Speciality fashion group limited. Retrieved from
http://www.specialtyfashiongroup.com.au/index.php/investor-centre/annual-reports as on 9th
Oct.
Bierman Jr, H. and Smidt, S., 2012. The capital budgeting decision: economic analysis of
investment projects. Routledge.
Deegan, C., 2013. Financial accounting theory. McGraw-Hill Education Australia.
Du, J. and Girma, S., 2009. Source of finance, growth and firm size: evidence from
China (No. 2009.03). Research paper/UNU-WIDER.
Gitman, L.J. and Zutter, C.J., 2012. Principles of managerial finance. Prentice Hall.
Home. 2017. Speciality fashion group limited. Retrieved from
http://www.specialtyfashiongroup.com.au/ as on 9th Oct.
Horngren, C.T., Sundem, G.L., Stratton, W.O., Burgstahler, D. and Schatzberg, J.,
2005. Introduction to management accounting. Upper Saddle River, New Jersey: Prentice
Hall.
Kaplan, R.S. and Atkinson, A.A., 2015. Advanced management accounting. PHI Learning.
Morningstar, 2017. Speciality fashion group limited. Retrieved from
http://financials.morningstar.com/income- statement/is.html?
t=SFH®ion=AUS&culture=en_US as on 9th Oct
Romney, M.B., Steinbart, P.J., Zhang, R. and Xu, G., 2006. Accounting information systems.
Pearson Education.
Shapiro, A.C., 2005. Capital budgeting and investment analysis. Prentice Hall.
⊘ This is a preview!⊘
Do you want full access?
Subscribe today to unlock all pages.
Trusted by 1+ million students worldwide
Financial analysis report 10
Appendix:
INCOME STATEMENT
Fiscal year ends in June. AUD in millions except per
share data.
2016-
06
2015-
06
2014-
06
Revenue 825 790 683
Cost of revenue 367 328 277
Gross profit 457 462 406
Operating expenses
Sales, General and administrative 231 232 203
Other operating expenses 227 232 214
Total operating expenses 457 464 417
Operating income 0 -2 -11
Interest Expense 3 4 2
Other income (expense) 2 1 29
Income before income taxes -2 -5 16
Provision for income taxes 1 0 4
Net income from continuing operations -2 -4 12
Net income -2 -4 12
Net income available to common shareholders -2 -4 12
Earnings per share
Basic -0.01 -0.02 0.07
Diluted -0.01 -0.02 0.07
Weighted average shares outstanding
Basic 192 192 192
Diluted 192 192 192
EBITDA 23 20 40
BALANCE SHEET
Fiscal year ends in June. AUD in millions except per
share data.
2016-
06
2015-
06
2014-
06
Assets
Current assets
Cash
Cash and cash equivalents 19 7 17
Short-term investments 0 7 0
Total cash 19 14 17
Receivables 6 6 4
Inventories 89 89 90
Prepaid expenses 4 2 4
Other current assets 1 3 0
Total current assets 118 115 116
Non-current assets
Property, plant and equipment
Paraphrase This Document
Need a fresh take? Get an instant paraphrase of this document with our AI Paraphraser
Financial analysis report 11
Other properties 183 249 231
Property and equipment, at cost 183 249 231
Accumulated Depreciation -109 -170 -147
Property, plant and equipment, net 74 79 84
Equity and other investments 0
Goodwill 10 10 10
Intangible assets 11 9 9
Deferred income taxes 8 4 6
Other long-term assets
Total non-current assets 103 102 109
Total assets 221 216 224
Liabilities and stockholders' equity
Liabilities
Current liabilities
Short-term debt 4
Capital leases 0 1
Accounts payable 33 17 25
Deferred income taxes 0 0 4
Deferred revenues 1 0 1
Other current liabilities 81 77 72
Total current liabilities 115 100 103
Non-current liabilities
Long-term debt 32 31 29
Capital leases 4
Deferred taxes liabilities
Other long-term liabilities 18 20 21
Total non-current liabilities 50 51 54
Total liabilities 165 151 158
Stockholders' equity
Common stock 134 134 134
Retained earnings -76 -74 -66
Accumulated other comprehensive income -3 5 -2
Total stockholders' equity 56 65 67
Total liabilities and stockholders' equity 221 216 224
Statement of CASH FLOW
Fiscal year ends in June. AUD in millions except per
share data.
2016-
06
2015-
06
2014-
06
Cash Flows From Operating Activities
Other non-cash items 31 5 4
Net cash provided by operating activities 31 5 4
Cash Flows From Investing Activities
Investments in property, plant, and equipment -13 -13 -21
Property, plant, and equipment reductions 0 0 1
Acquisitions, net -4
Financial analysis report 12
Purchases of intangibles -3
Other investing charges
Net cash used for investing activities -16 -13 -23
Cash Flows From Financing Activities
Long-term debt issued -3 6 2
Long-term debt repayment
Cash dividends paid -4 -8
Other financing activities 0 -5 4
Net cash provided by (used for) financing activities -3 -3 -2
Net change in cash 12 -10 -21
Cash at beginning of period 7 17 39
Cash at end of period 19 7 17
Free Cash Flow
Operating cash flow 31 5 4
Capital expenditure -16 -13 -21
Free cash flow 14 -8 -17
Supplemental schedule of cash flow data
Cash paid for income taxes 0 -7 0
Cash paid for interest -3 -4 -2
Computation of ratio analysis
Liquidity ratio 2016 2015 2014
Current ratio 1.02608696 1.15 1.126213592
Quick ratio 0.25217391 0.26 0.252427184
Working capital 3.0 15.0 13.0
Inventory turnover ratio 4.1 54.7
Gross Profit % 55% 58% 59%
Receivable turnover ratio 137.5 158.0
days sales in receivable 2.65454545 2.7721519 2.137628111
Profitability Ratios 2016 2015 2014
rate of return on net sales -0.0024242 -0.005063 0.017569546
rate of return on total assets 0.00% -0.93% -4.91%
Asset turnover 3.8 3.6 -0.1
rate of return on ordinary shareholder's
equity -0.0357143 -0.061538 0.179104478
EPS
-
0.014925373 -0.0298507 0.089552239
Gearing ratio
Capital structure ratio 2016 2015 2014
Debt ratio 0.74660633 0.6990741 0.705357143
⊘ This is a preview!⊘
Do you want full access?
Subscribe today to unlock all pages.
Trusted by 1+ million students worldwide
1 out of 21
Related Documents


Your All-in-One AI-Powered Toolkit for Academic Success.
+13062052269
info@desklib.com
Available 24*7 on WhatsApp / Email
![[object Object]](/_next/static/media/star-bottom.7253800d.svg)
Unlock your academic potential
Copyright © 2020–2026 A2Z Services. All Rights Reserved. Developed and managed by ZUCOL.