Financial Analysis and Investment Appraisal of Zurich Plc
VerifiedAdded on 2020/03/15
|17
|3958
|93
Project
AI Summary
This project report provides a comprehensive financial analysis of Zurich Plc, examining its performance through various financial ratios, including profitability, liquidity, gearing, asset utilization, and investment ratios for the years 2015 and 2016. The report assesses the company's financial health and identifies trends. Furthermore, the project applies investment appraisal techniques such as Net Present Value (NPV), Payback Period, Discounted Payback Period, Internal Rate of Return (IRR), and Accounting Rate of Return (ARR) to evaluate potential investment opportunities. The analysis includes detailed calculations and interpretations of each method, offering insights into the viability of investments and providing a basis for informed financial decisions. The report also discusses the limitations of each financial ratio and investment appraisal technique, ensuring a balanced understanding of the company's financial position and investment prospects. The report also mentions internal and external sources of the company.
RUNNUNG HEAD: Financial management and control 1
Project Report: Financial management and control
Project Report: Financial management and control
Paraphrase This Document
Need a fresh take? Get an instant paraphrase of this document with our AI Paraphraser
Financial management and control 2
Contents
Part A.....................................................................................................................................................3
A report on the performance of Zurich Plc Ltd......................................................................................3
Ratios:....................................................................................................................................................3
Profitability ratios:.............................................................................................................................3
Limitations:........................................................................................................................................4
Liquidity ratios:..................................................................................................................................4
Limitations.........................................................................................................................................4
Gearing Ratios:..................................................................................................................................4
Limitations.........................................................................................................................................5
Asset Utilization ratio:.......................................................................................................................5
Limitations.........................................................................................................................................6
Investment ratio:...............................................................................................................................6
Limitations.........................................................................................................................................6
Task 2:...................................................................................................................................................8
Que a.................................................................................................................................................8
Calculation of Net Present Value.......................................................................................................8
Calculation of Payback period...........................................................................................................8
Calculation of Discounted Payback period........................................................................................9
Calculation of IRR.............................................................................................................................10
Calculation of ARR...........................................................................................................................11
Que b)..............................................................................................................................................12
The Payback Period:........................................................................................................................12
Key Benefits.................................................................................................................................12
Limitations...................................................................................................................................12
The discounted Payback Period.......................................................................................................12
Key Benefits.................................................................................................................................12
Limitations:..................................................................................................................................13
The Accounting Rate of Return........................................................................................................13
Key Benefits.................................................................................................................................13
Limitations...................................................................................................................................13
The Net Present Value.....................................................................................................................14

Financial management and control 3
Key Benefits.................................................................................................................................14
Limitations...................................................................................................................................14
The Internal Rate of Return.............................................................................................................15
Key Benefits.................................................................................................................................15
Limitations...................................................................................................................................15
Que c)..............................................................................................................................................15
Internal and external sources of the company................................................................................15
References:..........................................................................................................................................17
⊘ This is a preview!⊘
Do you want full access?
Subscribe today to unlock all pages.
Trusted by 1+ million students worldwide
Financial management and control 4
Part A:
A report on the performance of Zurich Plc Ltd:
For analyzing the performance and position of Zurich Plc, financial position trends e
been analyzed and the ratio analysis study has been conducted on 2015 and 2016 year’s data
(Shapiro, 2005). In the study off ratio analysis, various ratios have been calculated which are
as follows:
Ratios:
Profitability ratios:
Profitability ratios of a company expresses about the company’s ability to create the
revenue in comparison of various expenses and the cost of the company. Profitability ratios
of Zurich Plc Ltd are as follows:
1. Gross profit margin – Gross profit/revenue x 100
2. Net profit margin – Retained earnings/revenue x 100
3. Return on assets – Retained earnings/total assets x 100
4. Return on shareholder’s equity – Retained earnings/shareholder’s equity x100
5. Return on capital employed – Retained earnings/capital employed x 100
(Romney, Steinbart, Zhang and Xu, 2006)
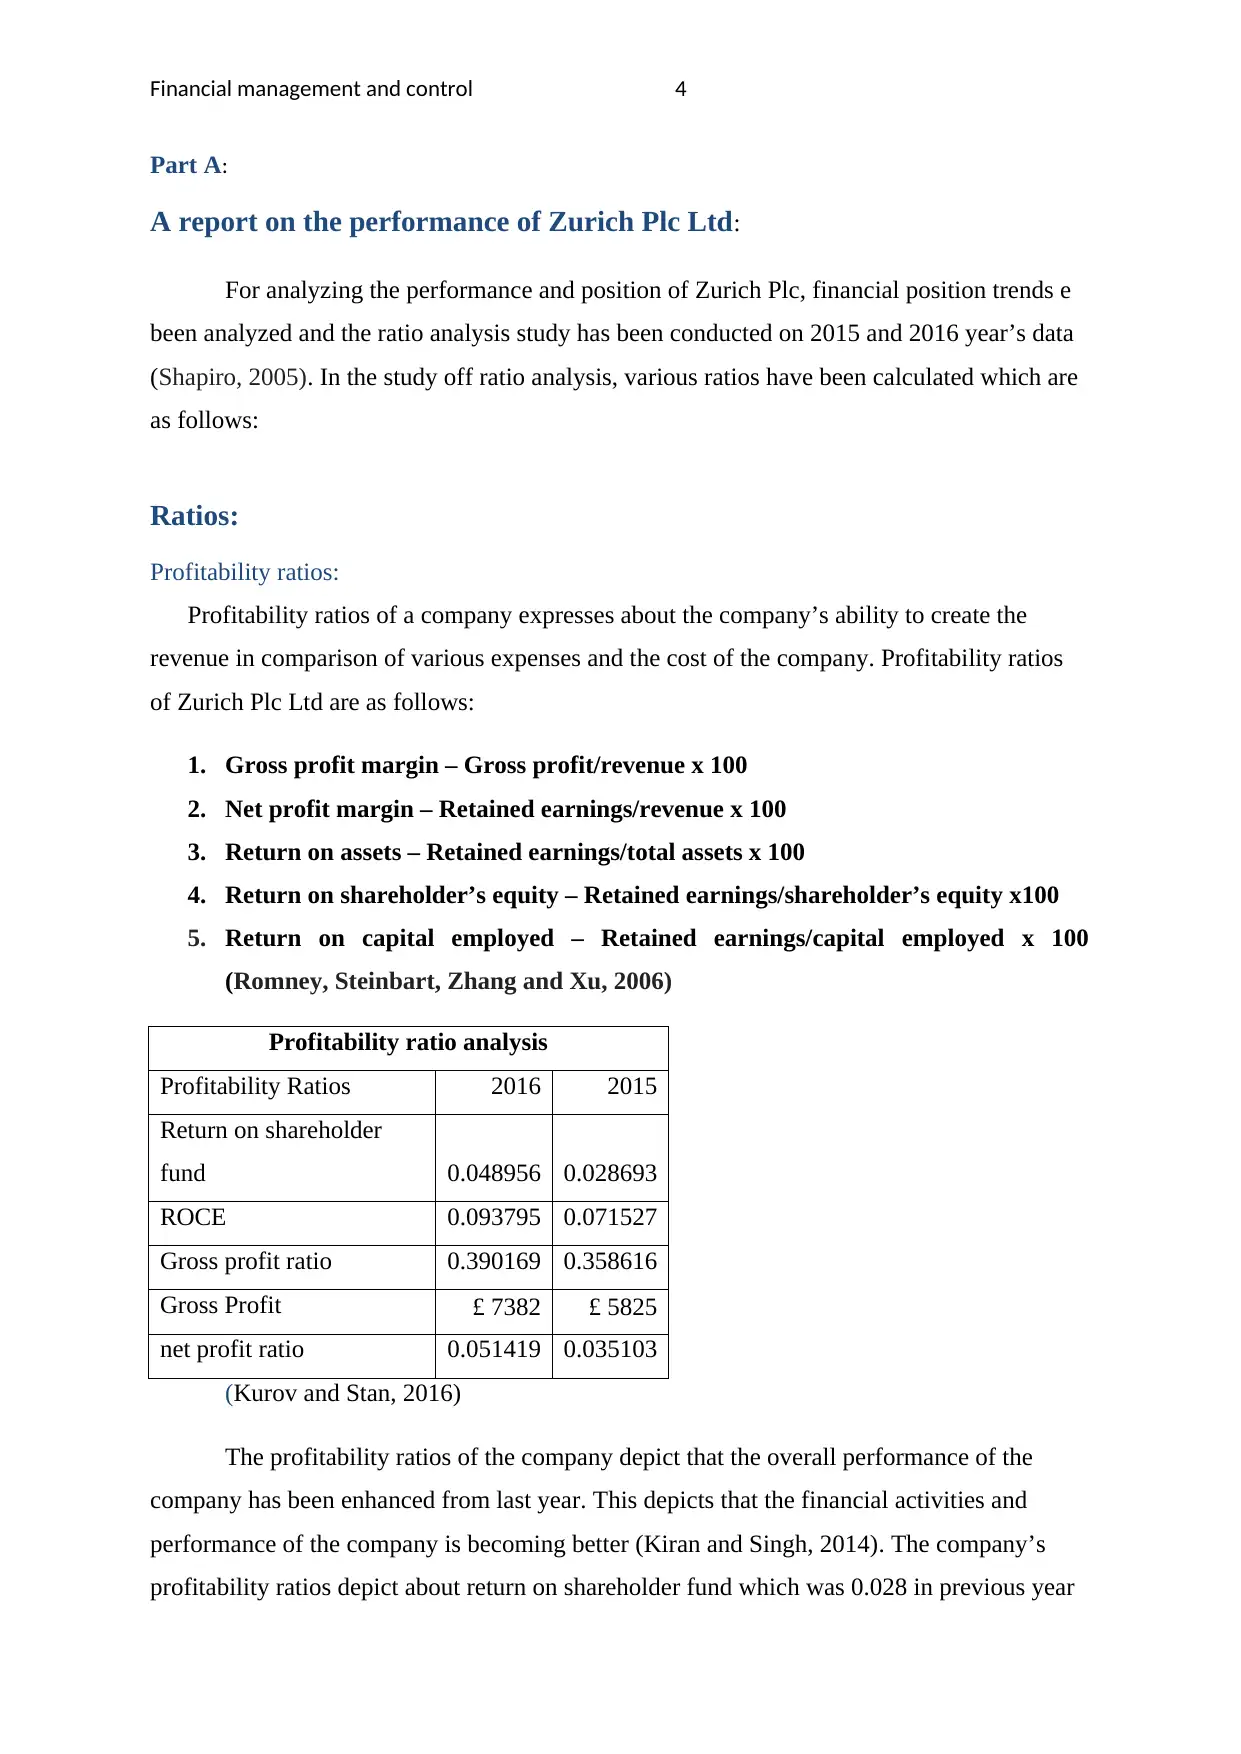
Profitability ratio analysis
Profitability Ratios 2016 2015
Return on shareholder
fund 0.048956 0.028693
ROCE 0.093795 0.071527
Gross profit ratio 0.390169 0.358616
Gross Profit £ 7382 £ 5825
net profit ratio 0.051419 0.035103
(Kurov and Stan, 2016)
The profitability ratios of the company depict that the overall performance of the
company has been enhanced from last year. This depicts that the financial activities and
performance of the company is becoming better (Kiran and Singh, 2014). The company’s
profitability ratios depict about return on shareholder fund which was 0.028 in previous year
Part A:
A report on the performance of Zurich Plc Ltd:
For analyzing the performance and position of Zurich Plc, financial position trends e
been analyzed and the ratio analysis study has been conducted on 2015 and 2016 year’s data
(Shapiro, 2005). In the study off ratio analysis, various ratios have been calculated which are
as follows:
Ratios:
Profitability ratios:
Profitability ratios of a company expresses about the company’s ability to create the
revenue in comparison of various expenses and the cost of the company. Profitability ratios
of Zurich Plc Ltd are as follows:
1. Gross profit margin – Gross profit/revenue x 100
2. Net profit margin – Retained earnings/revenue x 100
3. Return on assets – Retained earnings/total assets x 100
4. Return on shareholder’s equity – Retained earnings/shareholder’s equity x100
5. Return on capital employed – Retained earnings/capital employed x 100
(Romney, Steinbart, Zhang and Xu, 2006)
Profitability ratio analysis
Profitability Ratios 2016 2015
Return on shareholder
fund 0.048956 0.028693
ROCE 0.093795 0.071527
Gross profit ratio 0.390169 0.358616
Gross Profit £ 7382 £ 5825
net profit ratio 0.051419 0.035103
(Kurov and Stan, 2016)
The profitability ratios of the company depict that the overall performance of the
company has been enhanced from last year. This depicts that the financial activities and
performance of the company is becoming better (Kiran and Singh, 2014). The company’s
profitability ratios depict about return on shareholder fund which was 0.028 in previous year
Paraphrase This Document
Need a fresh take? Get an instant paraphrase of this document with our AI Paraphraser
Financial management and control 5
and has been increased in current year to 0.049 (Deegan, 2013). The ROCE, Gross profit
ratio, Gross profit and Net profit ratio of the company has been improved from last year.
Limitations:
Profitability ratio of the company could be influenced due to the source which is
earnings and investments. There are various dissimilar ways for evaluating the profits and
investment. This study only emphasizes upon the short term profits. It is exaggerated by
various extraneous and non-controllable factors (Kaplan and Atkinson, 2015). It is excessive
implication over the capital resources of the company. Thus it has been analyzed that it is not
a good option for the company to make a decision on the basis of profitability ratio only.
Liquidity ratios:
Liquidity ratio of a company assesses the capability of a firm to disburse the short term
debt of the company. Calculation of liquidity ratios have been given below:
1. Current ratio – Current Assets/Current Liabilities
2. Quick ratio – (Current Assets-Inventory)/Current liabilities
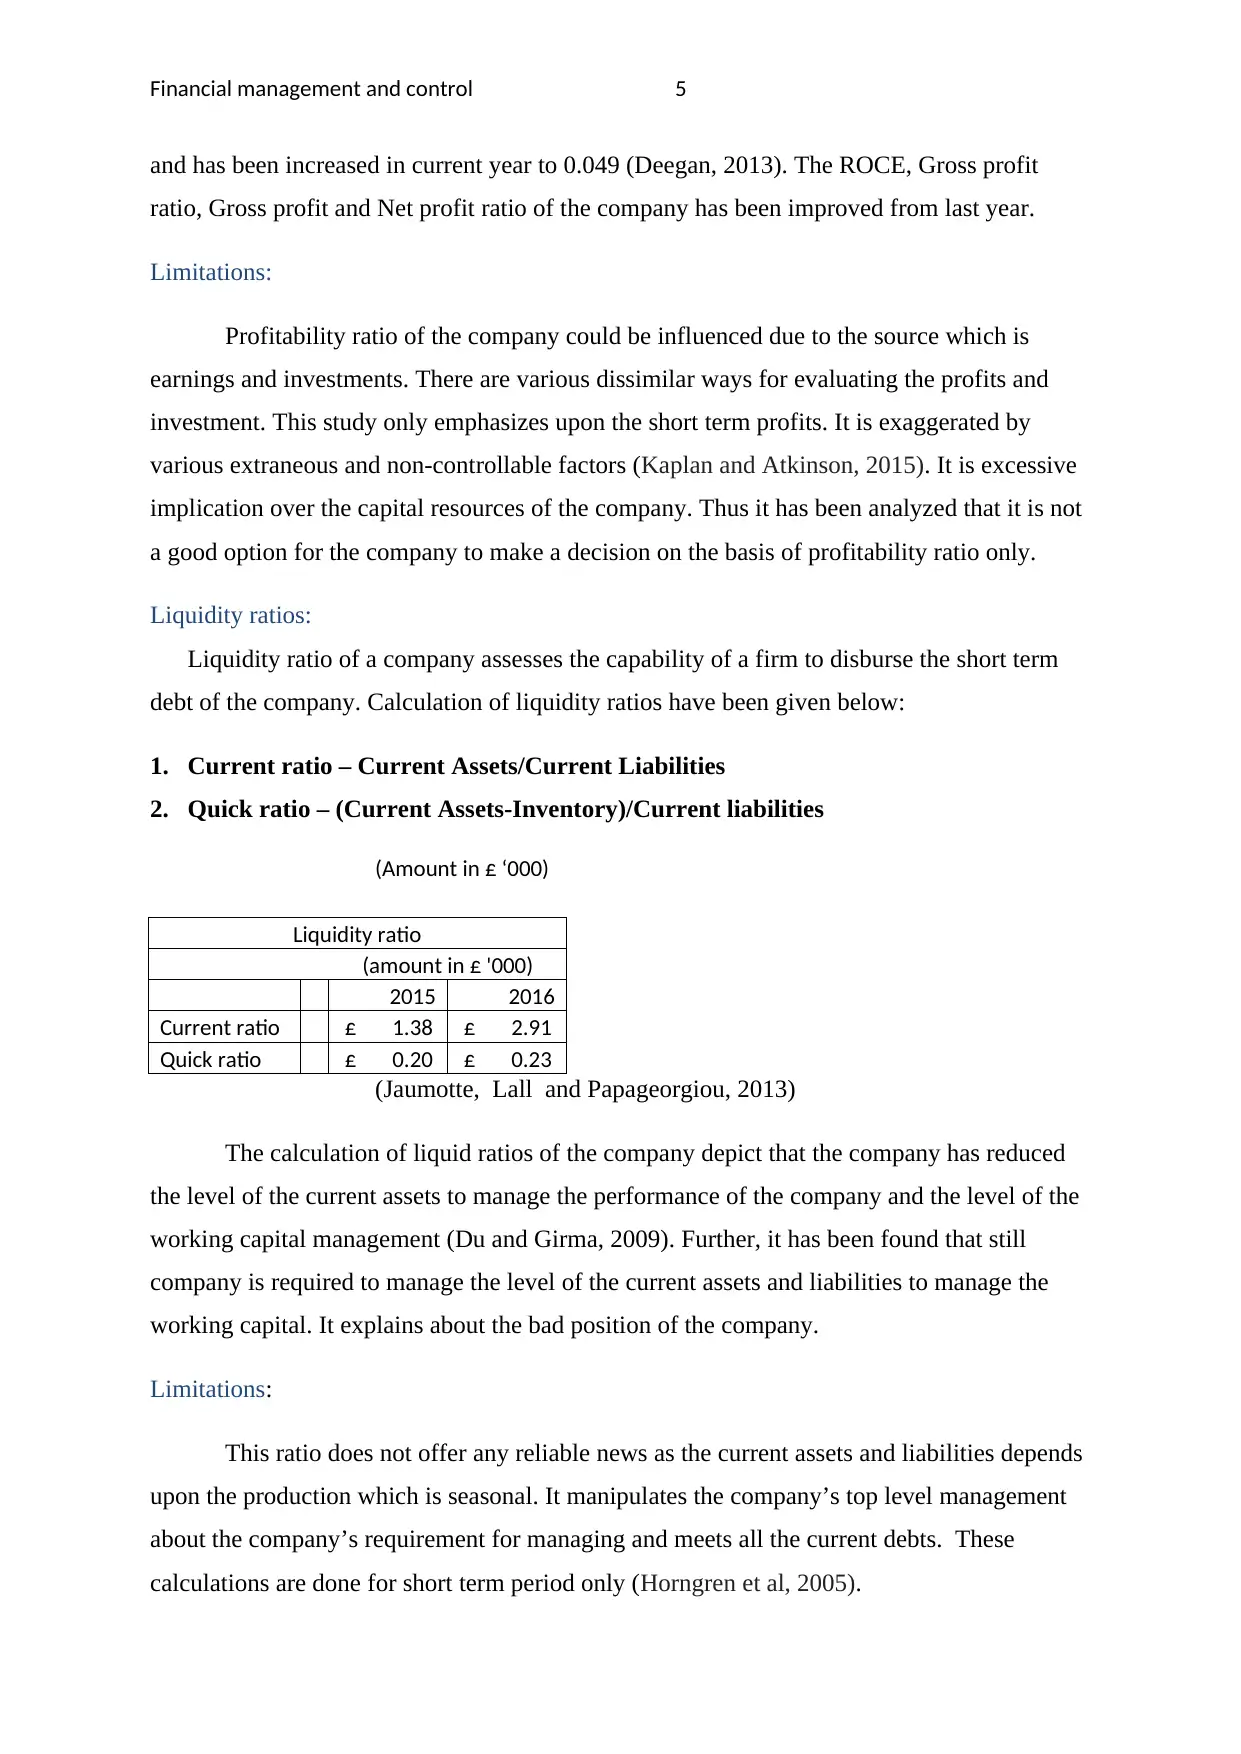
(Amount in £ ‘000)
Liquidity ratio
(amount in £ '000)
2015 2016
Current ratio £ 1.38 £ 2.91
Quick ratio £ 0.20 £ 0.23
(Jaumotte, Lall and Papageorgiou, 2013)
The calculation of liquid ratios of the company depict that the company has reduced
the level of the current assets to manage the performance of the company and the level of the
working capital management (Du and Girma, 2009). Further, it has been found that still
company is required to manage the level of the current assets and liabilities to manage the
working capital. It explains about the bad position of the company.
Limitations:
This ratio does not offer any reliable news as the current assets and liabilities depends
upon the production which is seasonal. It manipulates the company’s top level management
about the company’s requirement for managing and meets all the current debts. These
calculations are done for short term period only (Horngren et al, 2005).
and has been increased in current year to 0.049 (Deegan, 2013). The ROCE, Gross profit
ratio, Gross profit and Net profit ratio of the company has been improved from last year.
Limitations:
Profitability ratio of the company could be influenced due to the source which is
earnings and investments. There are various dissimilar ways for evaluating the profits and
investment. This study only emphasizes upon the short term profits. It is exaggerated by
various extraneous and non-controllable factors (Kaplan and Atkinson, 2015). It is excessive
implication over the capital resources of the company. Thus it has been analyzed that it is not
a good option for the company to make a decision on the basis of profitability ratio only.
Liquidity ratios:
Liquidity ratio of a company assesses the capability of a firm to disburse the short term
debt of the company. Calculation of liquidity ratios have been given below:
1. Current ratio – Current Assets/Current Liabilities
2. Quick ratio – (Current Assets-Inventory)/Current liabilities
(Amount in £ ‘000)
Liquidity ratio
(amount in £ '000)
2015 2016
Current ratio £ 1.38 £ 2.91
Quick ratio £ 0.20 £ 0.23
(Jaumotte, Lall and Papageorgiou, 2013)
The calculation of liquid ratios of the company depict that the company has reduced
the level of the current assets to manage the performance of the company and the level of the
working capital management (Du and Girma, 2009). Further, it has been found that still
company is required to manage the level of the current assets and liabilities to manage the
working capital. It explains about the bad position of the company.
Limitations:
This ratio does not offer any reliable news as the current assets and liabilities depends
upon the production which is seasonal. It manipulates the company’s top level management
about the company’s requirement for managing and meets all the current debts. These
calculations are done for short term period only (Horngren et al, 2005).
Financial management and control 6
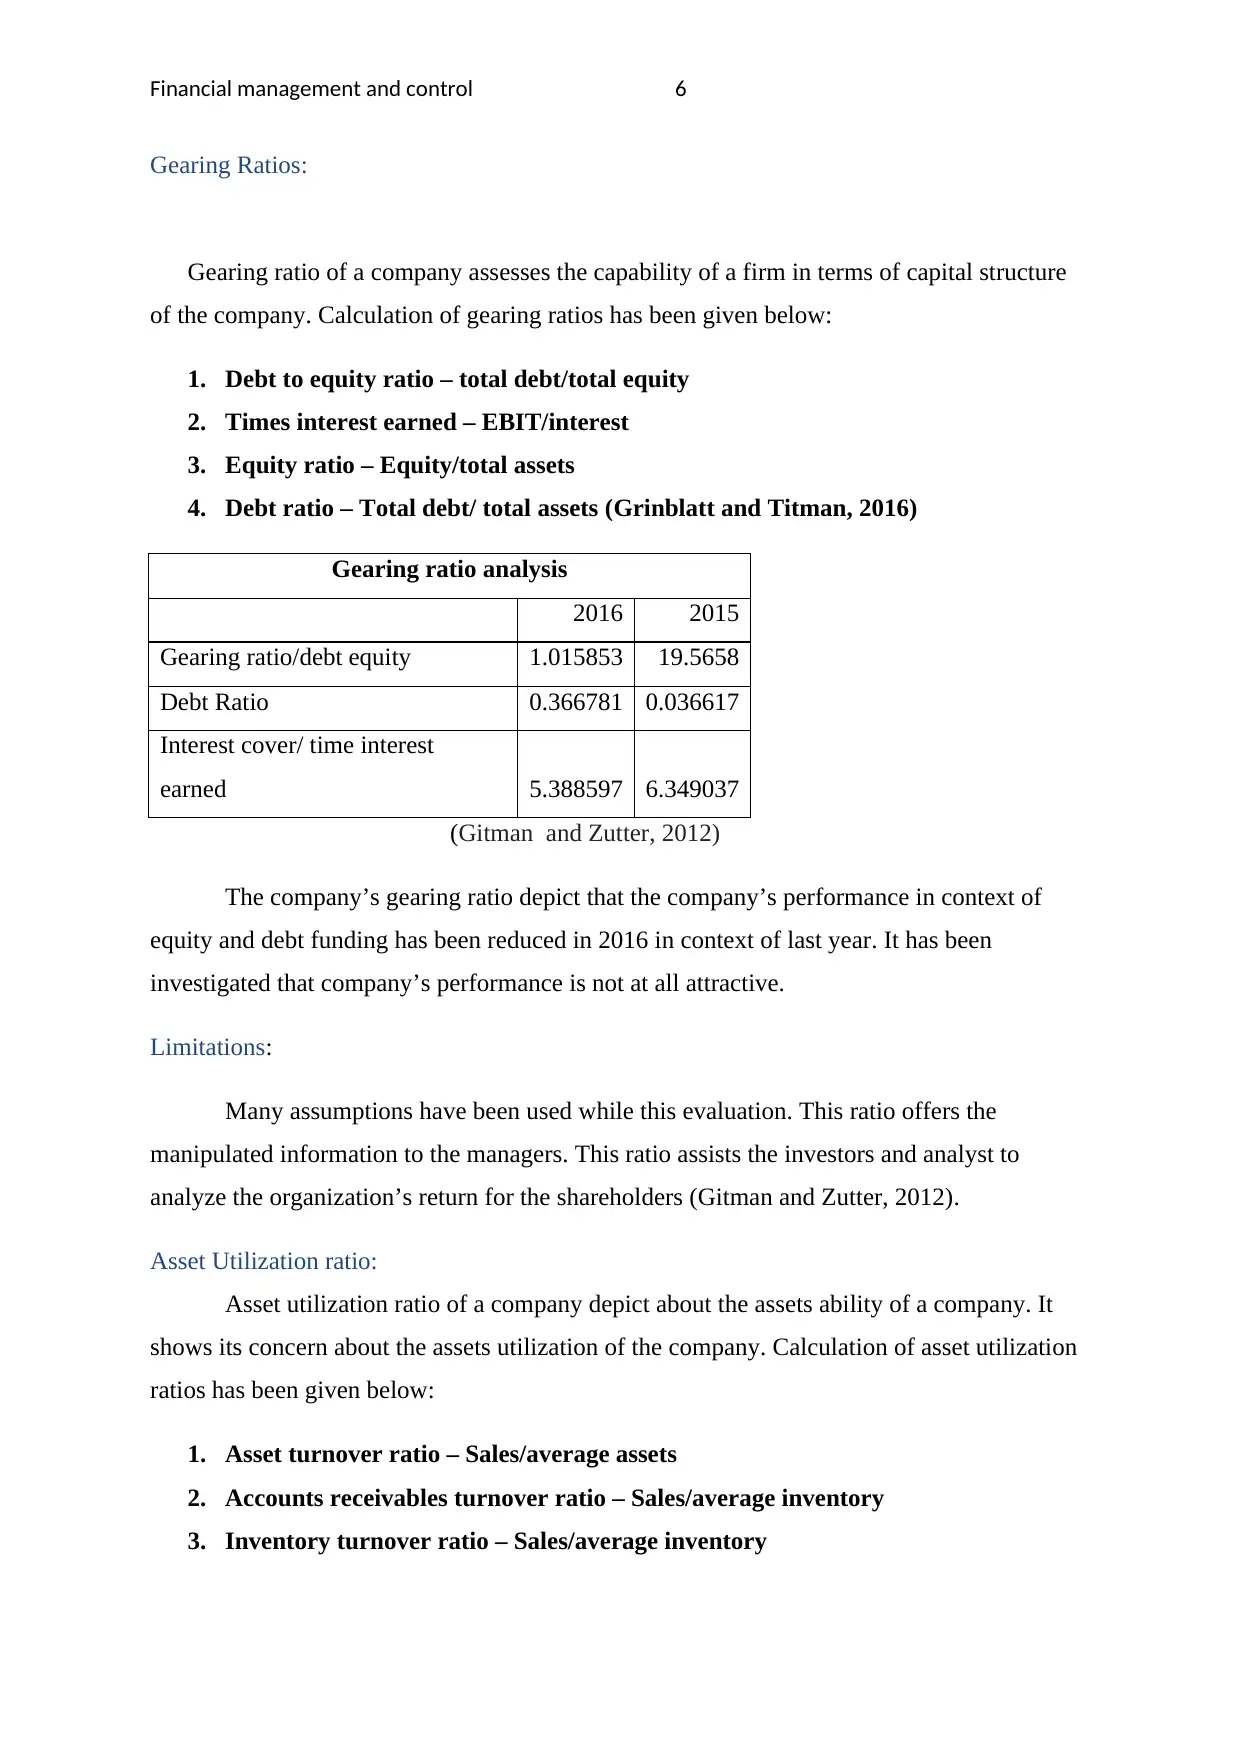
Gearing Ratios:
Gearing ratio of a company assesses the capability of a firm in terms of capital structure
of the company. Calculation of gearing ratios has been given below:
1. Debt to equity ratio – total debt/total equity
2. Times interest earned – EBIT/interest
3. Equity ratio – Equity/total assets
4. Debt ratio – Total debt/ total assets (Grinblatt and Titman, 2016)
Gearing ratio analysis
2016 2015
Gearing ratio/debt equity 1.015853 19.5658
Debt Ratio 0.366781 0.036617
Interest cover/ time interest
earned 5.388597 6.349037
(Gitman and Zutter, 2012)
The company’s gearing ratio depict that the company’s performance in context of
equity and debt funding has been reduced in 2016 in context of last year. It has been
investigated that company’s performance is not at all attractive.
Limitations:
Many assumptions have been used while this evaluation. This ratio offers the
manipulated information to the managers. This ratio assists the investors and analyst to
analyze the organization’s return for the shareholders (Gitman and Zutter, 2012).
Asset Utilization ratio:
Asset utilization ratio of a company depict about the assets ability of a company. It
shows its concern about the assets utilization of the company. Calculation of asset utilization
ratios has been given below:
1. Asset turnover ratio – Sales/average assets
2. Accounts receivables turnover ratio – Sales/average inventory
3. Inventory turnover ratio – Sales/average inventory
⊘ This is a preview!⊘
Do you want full access?
Subscribe today to unlock all pages.
Trusted by 1+ million students worldwide
Financial management and control 7
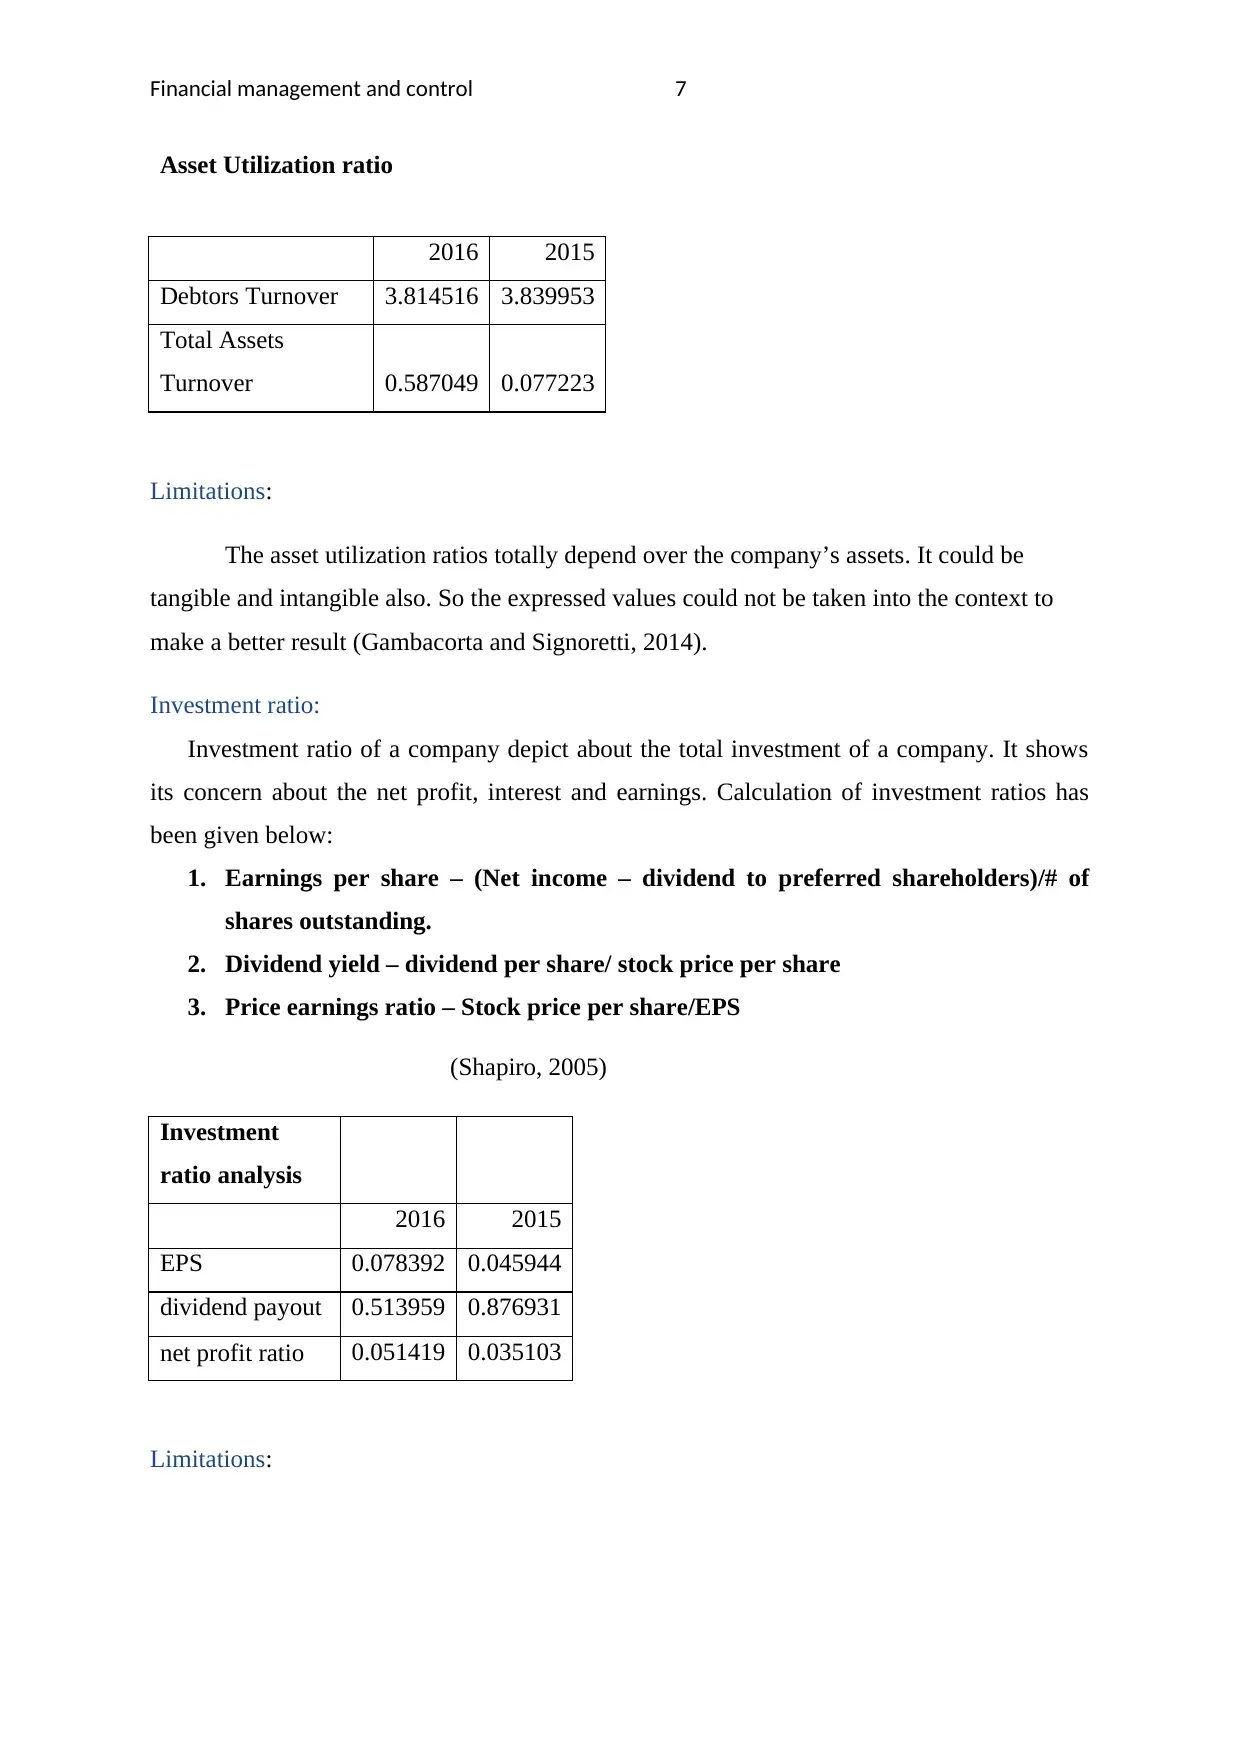
Asset Utilization ratio
2016 2015
Debtors Turnover 3.814516 3.839953
Total Assets
Turnover 0.587049 0.077223
Limitations:
The asset utilization ratios totally depend over the company’s assets. It could be
tangible and intangible also. So the expressed values could not be taken into the context to
make a better result (Gambacorta and Signoretti, 2014).
Investment ratio:
Investment ratio of a company depict about the total investment of a company. It shows
its concern about the net profit, interest and earnings. Calculation of investment ratios has
been given below:
1. Earnings per share – (Net income – dividend to preferred shareholders)/# of
shares outstanding.
2. Dividend yield – dividend per share/ stock price per share
3. Price earnings ratio – Stock price per share/EPS
(Shapiro, 2005)
Investment
ratio analysis
2016 2015
EPS 0.078392 0.045944
dividend payout 0.513959 0.876931
net profit ratio 0.051419 0.035103
Limitations:
Paraphrase This Document
Need a fresh take? Get an instant paraphrase of this document with our AI Paraphraser

Financial management and control 8
Investment ratios don’t offer the correct results due to the fact that the share price of a
company’s are of fluctuate nature and the dividend of the shareholders could also be changes
due to various internal activities of the company (Fernandes, Lynch and Netemeyer, 2014).
Investment ratios don’t offer the correct results due to the fact that the share price of a
company’s are of fluctuate nature and the dividend of the shareholders could also be changes
due to various internal activities of the company (Fernandes, Lynch and Netemeyer, 2014).
Financial management and control 9
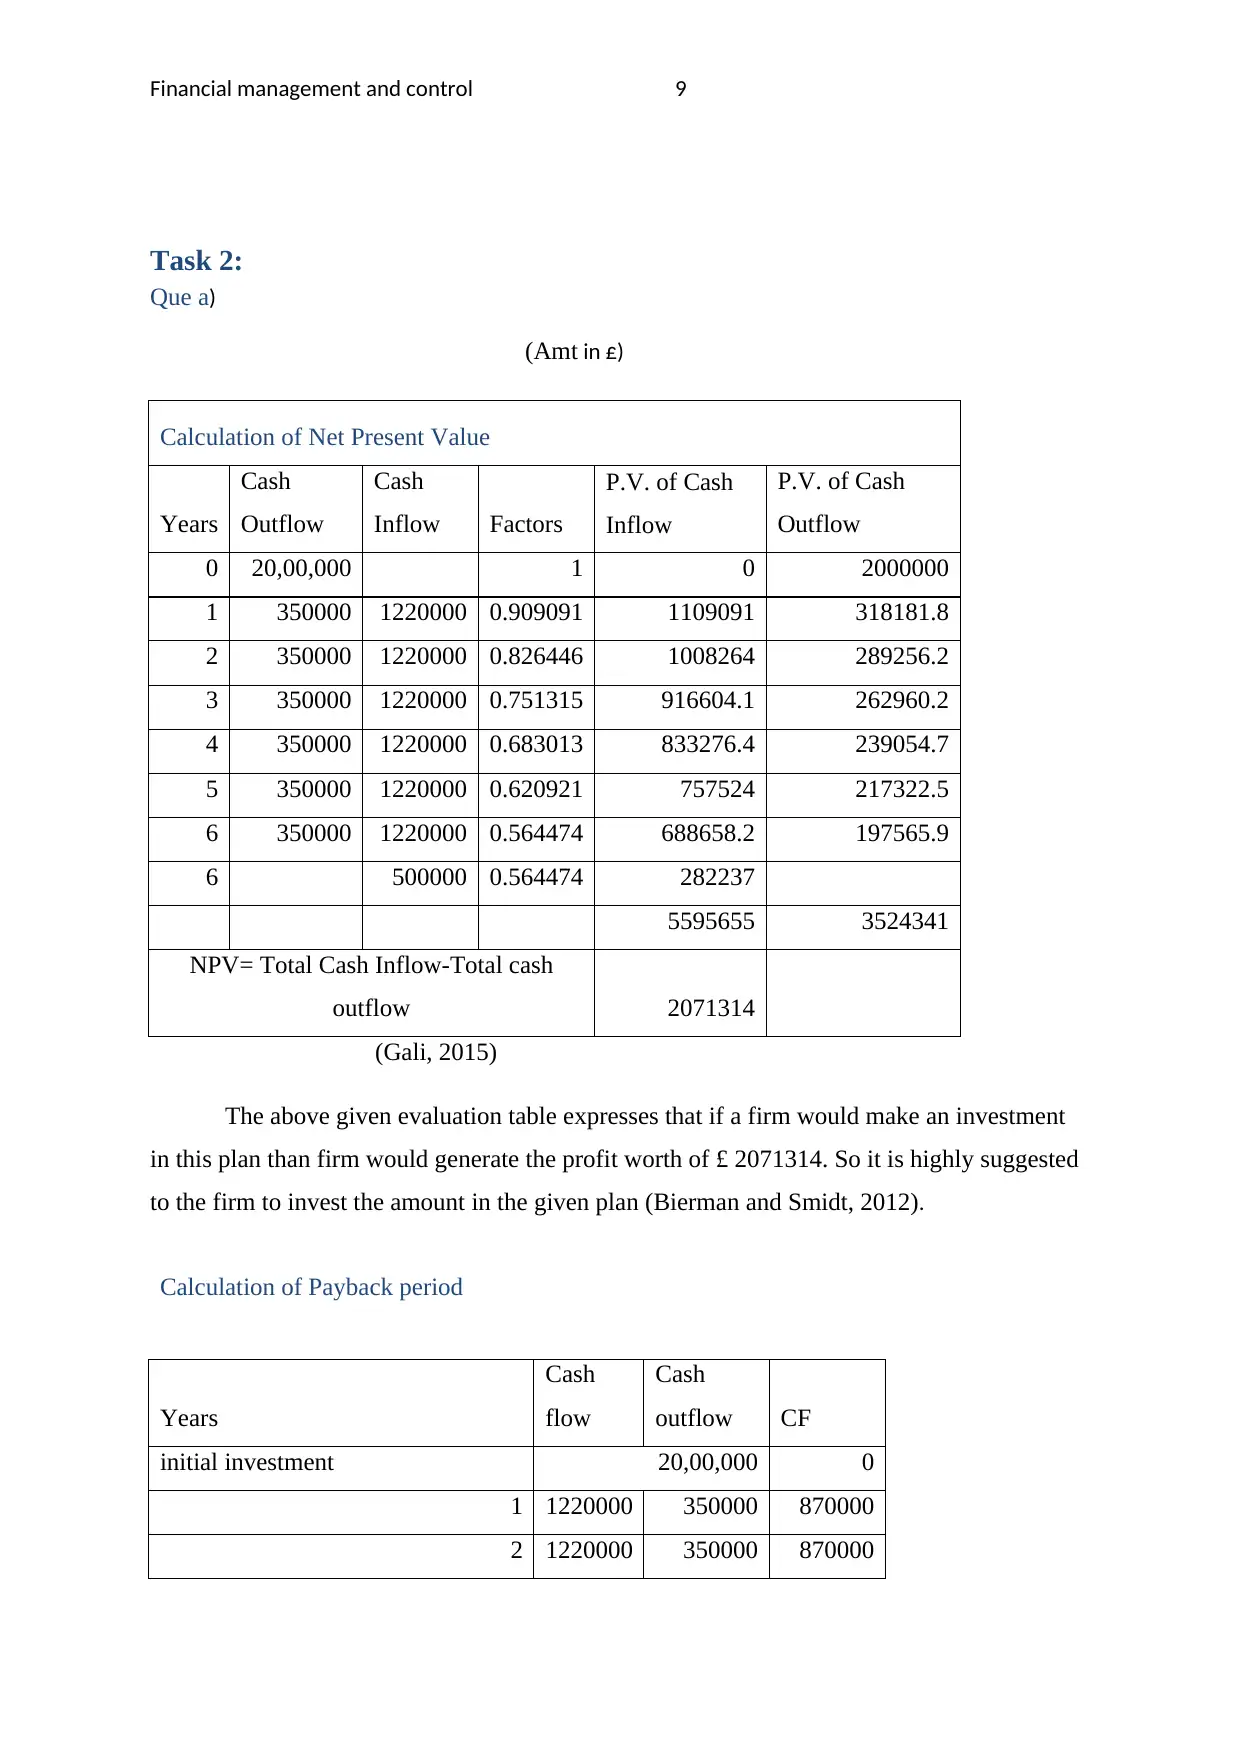
Task 2:
Que a)
(Amt in £)
Calculation of Net Present Value
Years
Cash
Outflow
Cash
Inflow Factors
P.V. of Cash
Inflow
P.V. of Cash
Outflow
0 20,00,000 1 0 2000000
1 350000 1220000 0.909091 1109091 318181.8
2 350000 1220000 0.826446 1008264 289256.2
3 350000 1220000 0.751315 916604.1 262960.2
4 350000 1220000 0.683013 833276.4 239054.7
5 350000 1220000 0.620921 757524 217322.5
6 350000 1220000 0.564474 688658.2 197565.9
6 500000 0.564474 282237
5595655 3524341
NPV= Total Cash Inflow-Total cash
outflow 2071314
(Gali, 2015)
The above given evaluation table expresses that if a firm would make an investment
in this plan than firm would generate the profit worth of £ 2071314. So it is highly suggested
to the firm to invest the amount in the given plan (Bierman and Smidt, 2012).
Calculation of Payback period
Years
Cash
flow
Cash
outflow CF
initial investment 20,00,000 0
1 1220000 350000 870000
2 1220000 350000 870000
⊘ This is a preview!⊘
Do you want full access?
Subscribe today to unlock all pages.
Trusted by 1+ million students worldwide
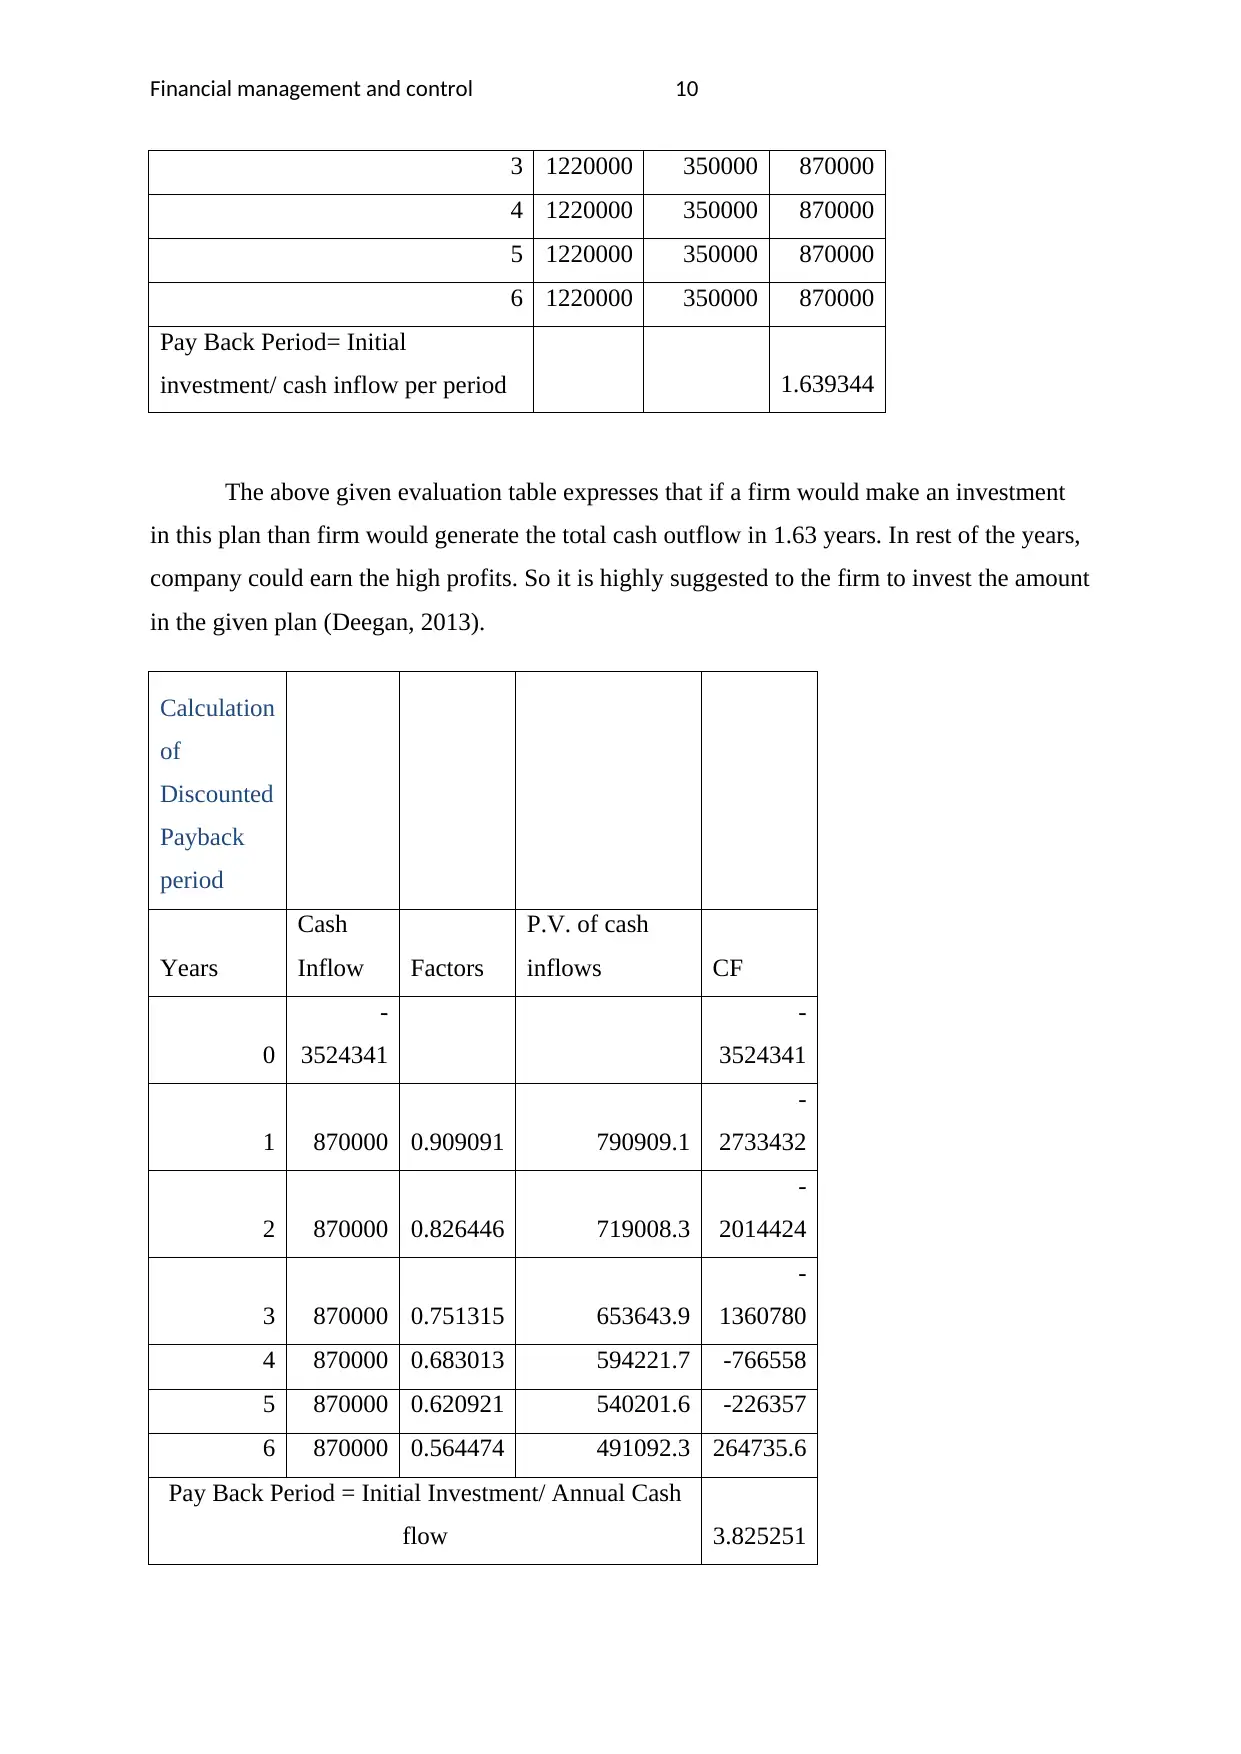
Financial management and control 10
3 1220000 350000 870000
4 1220000 350000 870000
5 1220000 350000 870000
6 1220000 350000 870000
Pay Back Period= Initial
investment/ cash inflow per period 1.639344
The above given evaluation table expresses that if a firm would make an investment
in this plan than firm would generate the total cash outflow in 1.63 years. In rest of the years,
company could earn the high profits. So it is highly suggested to the firm to invest the amount
in the given plan (Deegan, 2013).
Calculation
of
Discounted
Payback
period
Years
Cash
Inflow Factors
P.V. of cash
inflows CF
0
-
3524341
-
3524341
1 870000 0.909091 790909.1
-
2733432
2 870000 0.826446 719008.3
-
2014424
3 870000 0.751315 653643.9
-
1360780
4 870000 0.683013 594221.7 -766558
5 870000 0.620921 540201.6 -226357
6 870000 0.564474 491092.3 264735.6
Pay Back Period = Initial Investment/ Annual Cash
flow 3.825251
Paraphrase This Document
Need a fresh take? Get an instant paraphrase of this document with our AI Paraphraser
Financial management and control 11
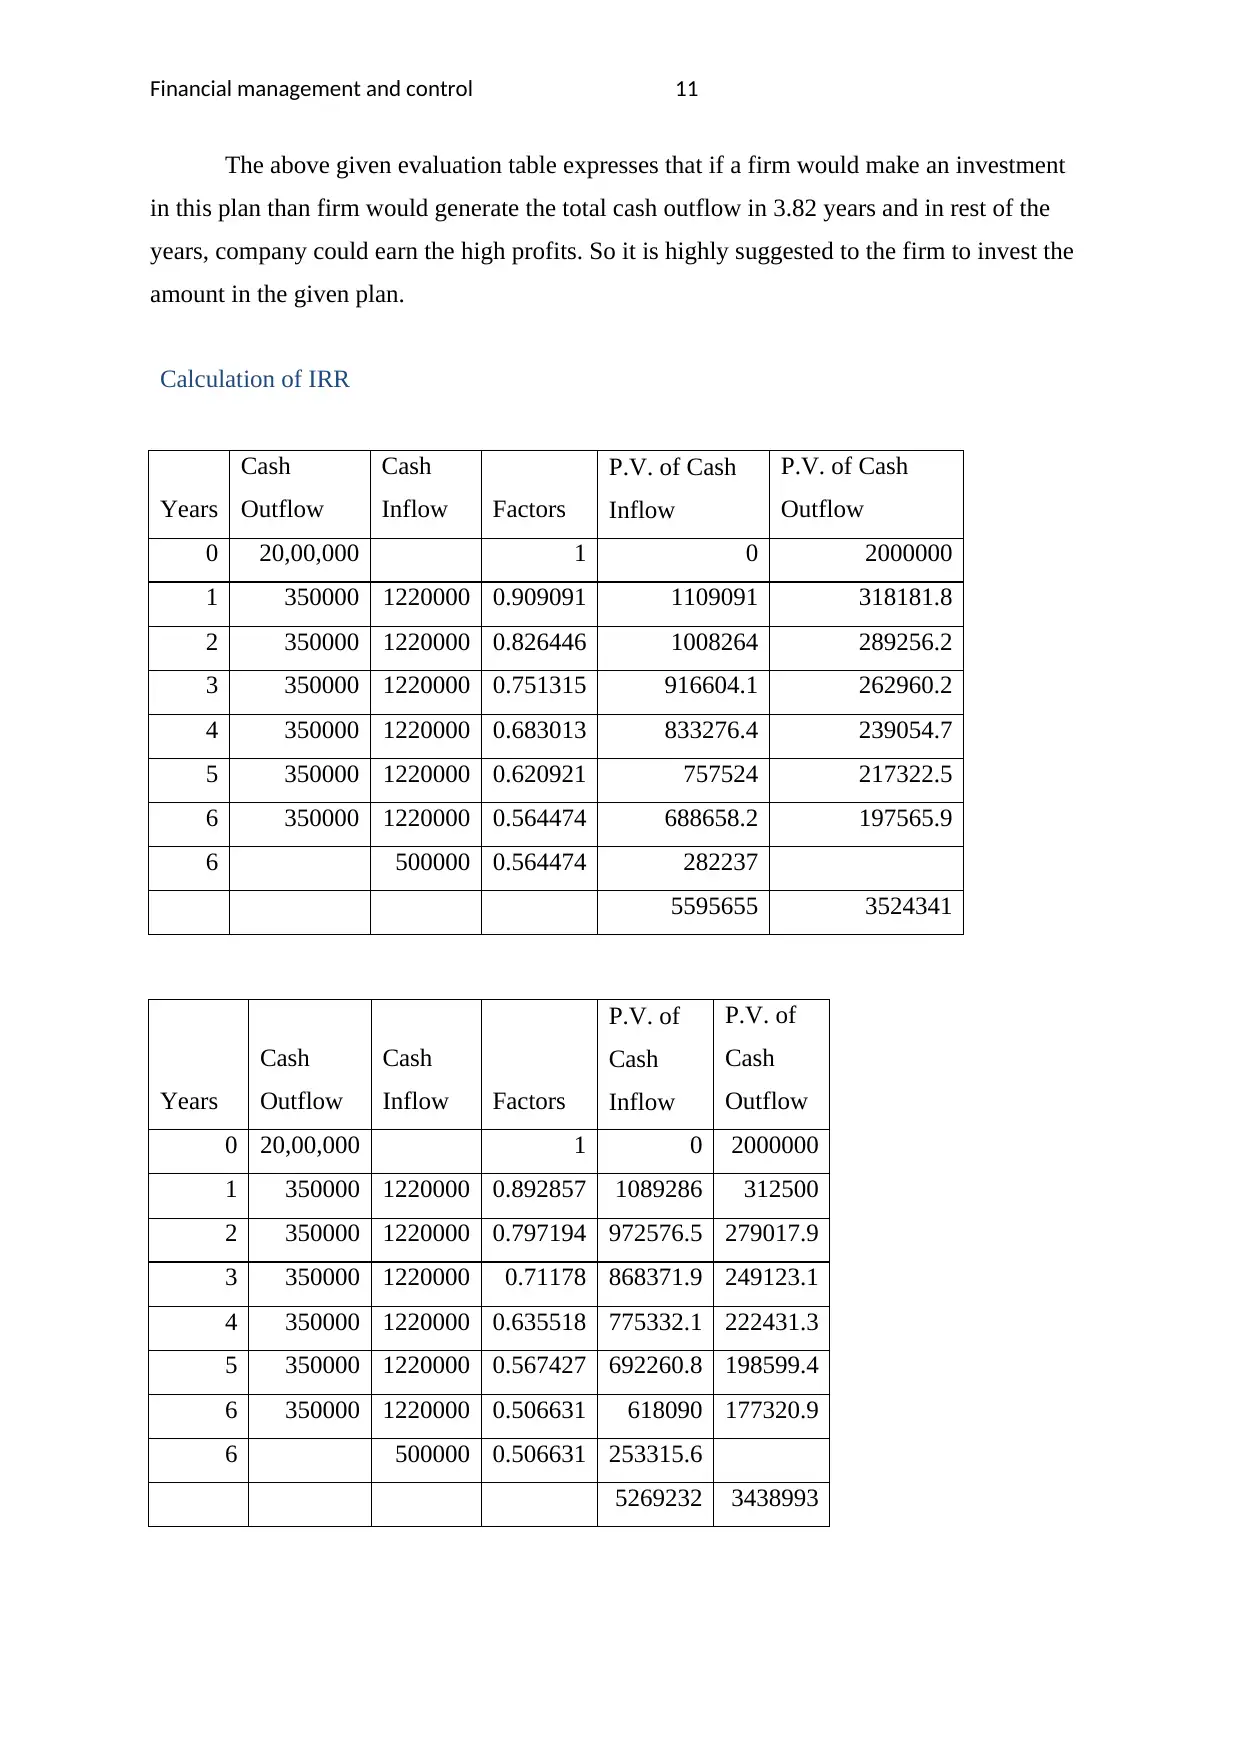
The above given evaluation table expresses that if a firm would make an investment
in this plan than firm would generate the total cash outflow in 3.82 years and in rest of the
years, company could earn the high profits. So it is highly suggested to the firm to invest the
amount in the given plan.
Calculation of IRR
Years
Cash
Outflow
Cash
Inflow Factors
P.V. of Cash
Inflow
P.V. of Cash
Outflow
0 20,00,000 1 0 2000000
1 350000 1220000 0.909091 1109091 318181.8
2 350000 1220000 0.826446 1008264 289256.2
3 350000 1220000 0.751315 916604.1 262960.2
4 350000 1220000 0.683013 833276.4 239054.7
5 350000 1220000 0.620921 757524 217322.5
6 350000 1220000 0.564474 688658.2 197565.9
6 500000 0.564474 282237
5595655 3524341
Years
Cash
Outflow
Cash
Inflow Factors
P.V. of
Cash
Inflow
P.V. of
Cash
Outflow
0 20,00,000 1 0 2000000
1 350000 1220000 0.892857 1089286 312500
2 350000 1220000 0.797194 972576.5 279017.9
3 350000 1220000 0.71178 868371.9 249123.1
4 350000 1220000 0.635518 775332.1 222431.3
5 350000 1220000 0.567427 692260.8 198599.4
6 350000 1220000 0.506631 618090 177320.9
6 500000 0.506631 253315.6
5269232 3438993
Financial management and control 12
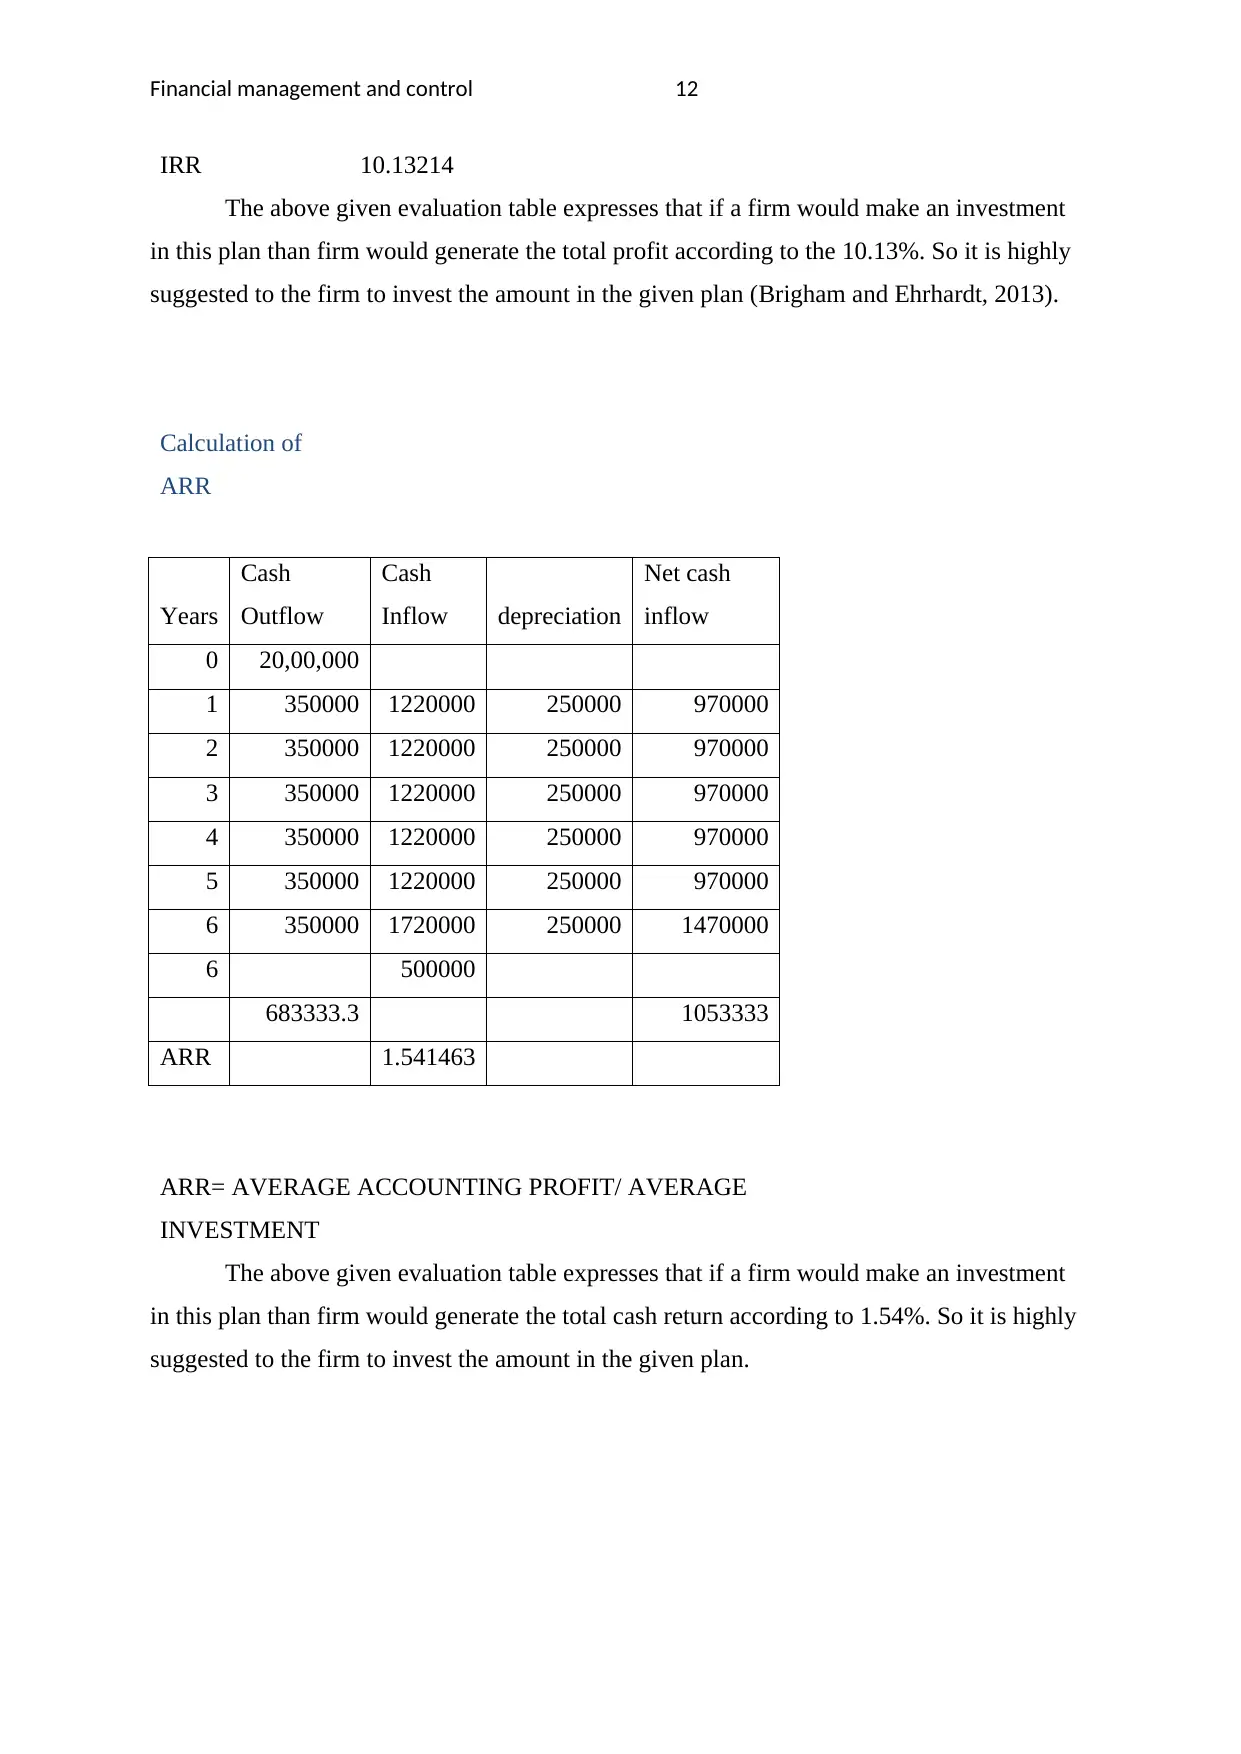
IRR 10.13214
The above given evaluation table expresses that if a firm would make an investment
in this plan than firm would generate the total profit according to the 10.13%. So it is highly
suggested to the firm to invest the amount in the given plan (Brigham and Ehrhardt, 2013).
Calculation of
ARR
Years
Cash
Outflow
Cash
Inflow depreciation
Net cash
inflow
0 20,00,000
1 350000 1220000 250000 970000
2 350000 1220000 250000 970000
3 350000 1220000 250000 970000
4 350000 1220000 250000 970000
5 350000 1220000 250000 970000
6 350000 1720000 250000 1470000
6 500000
683333.3 1053333
ARR 1.541463
ARR= AVERAGE ACCOUNTING PROFIT/ AVERAGE
INVESTMENT
The above given evaluation table expresses that if a firm would make an investment
in this plan than firm would generate the total cash return according to 1.54%. So it is highly
suggested to the firm to invest the amount in the given plan.
⊘ This is a preview!⊘
Do you want full access?
Subscribe today to unlock all pages.
Trusted by 1+ million students worldwide
1 out of 17
Related Documents


Your All-in-One AI-Powered Toolkit for Academic Success.
+13062052269
info@desklib.com
Available 24*7 on WhatsApp / Email
![[object Object]](/_next/static/media/star-bottom.7253800d.svg)
Unlock your academic potential
Copyright © 2020–2026 A2Z Services. All Rights Reserved. Developed and managed by ZUCOL.