Financial Resource Management and CVP Analysis Report

Verified

Added on  2023/02/03

|13
|624
|55
Report
AI Summary
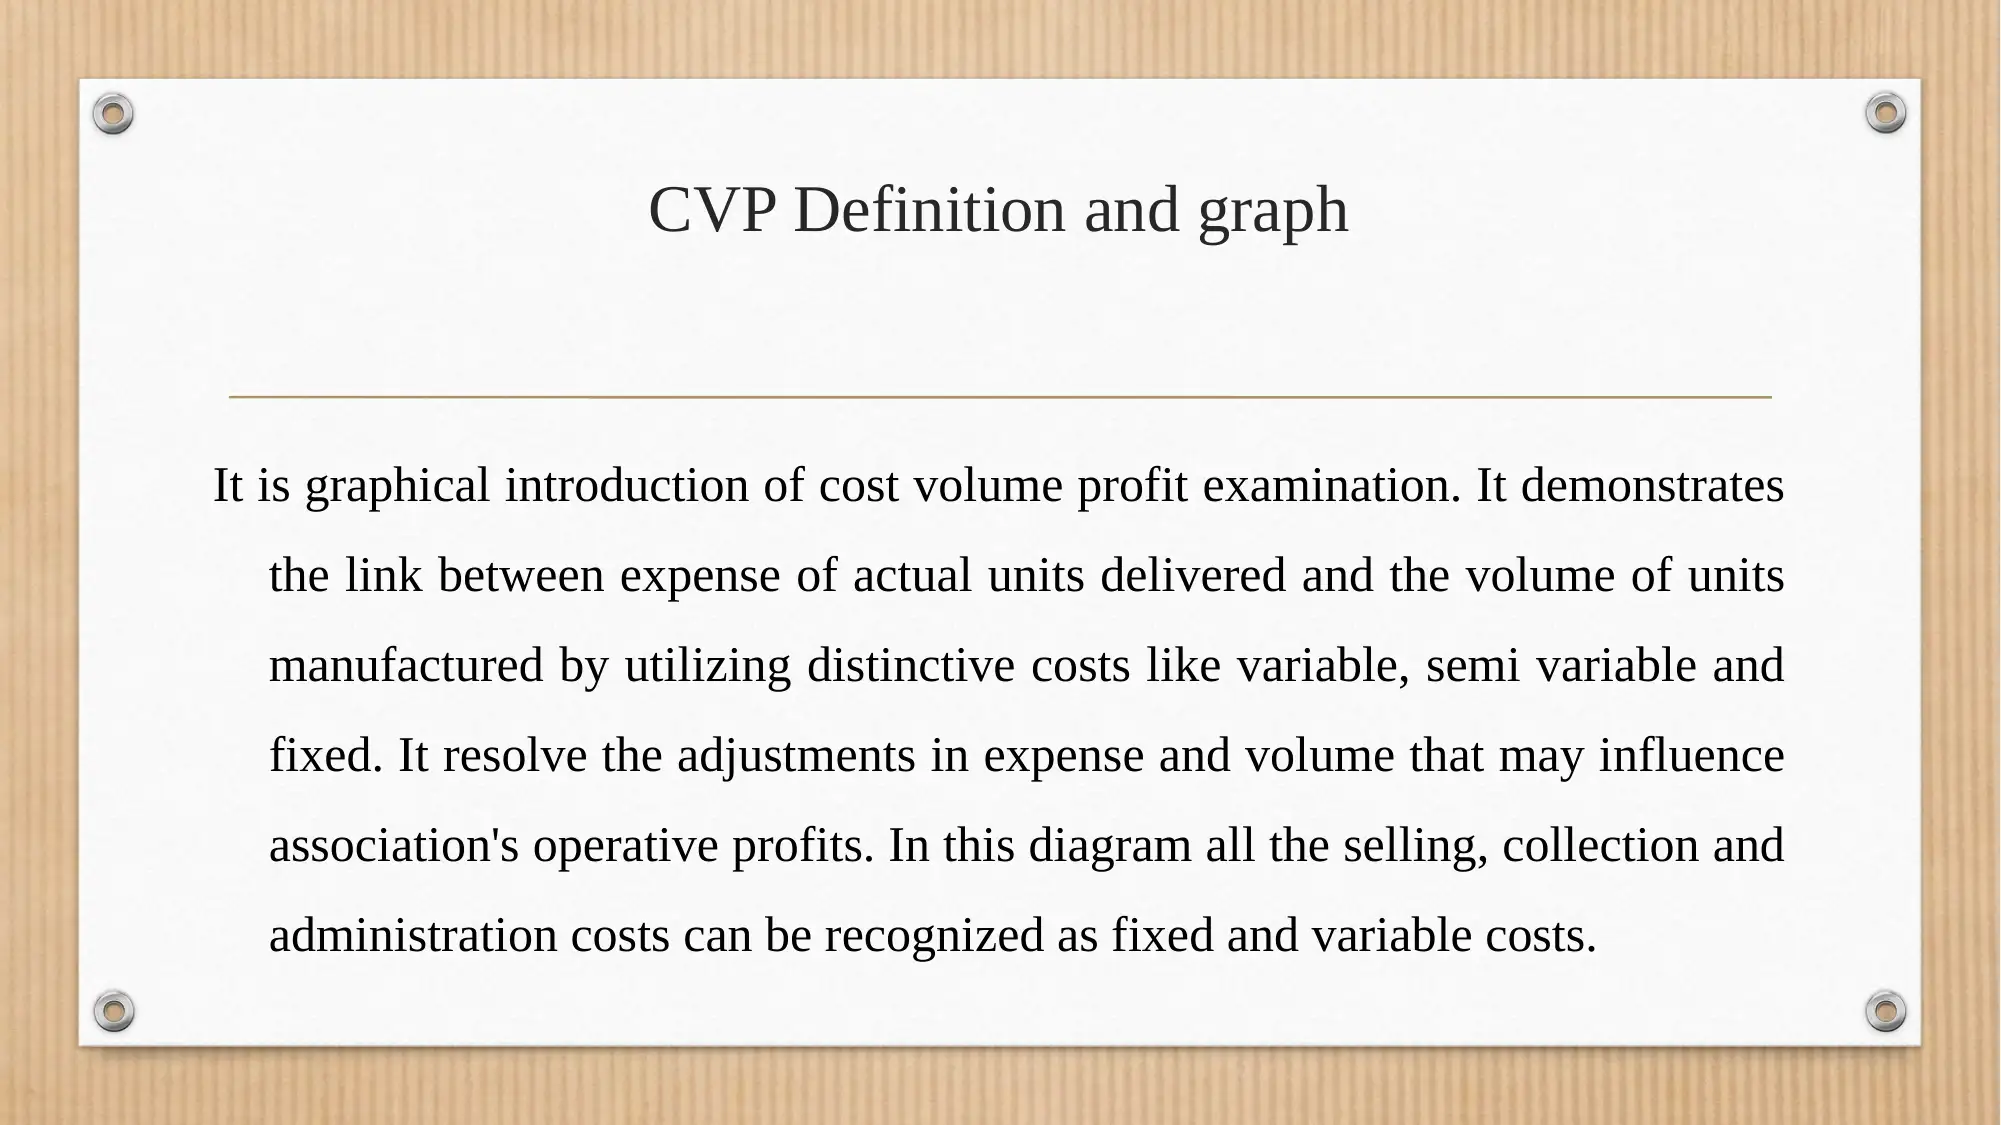
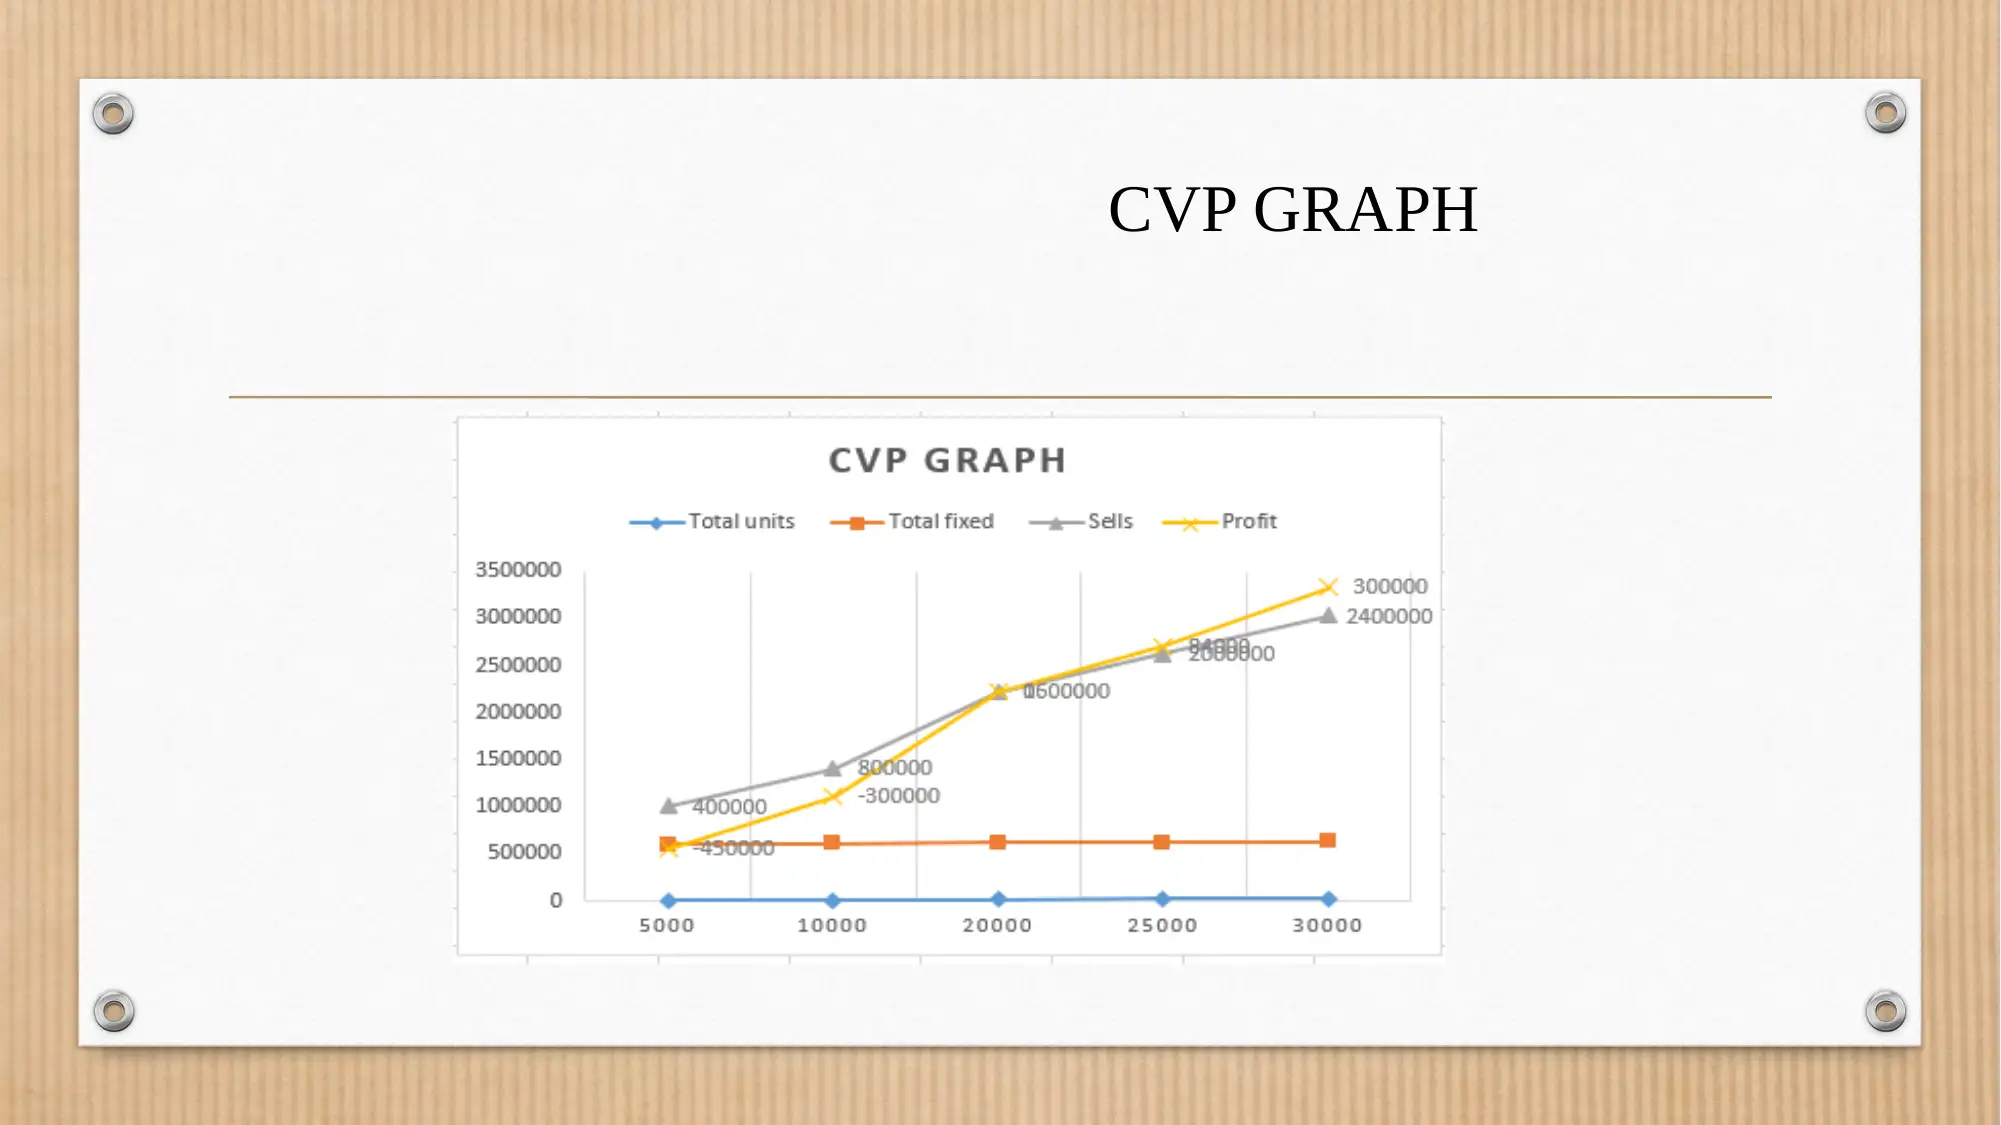
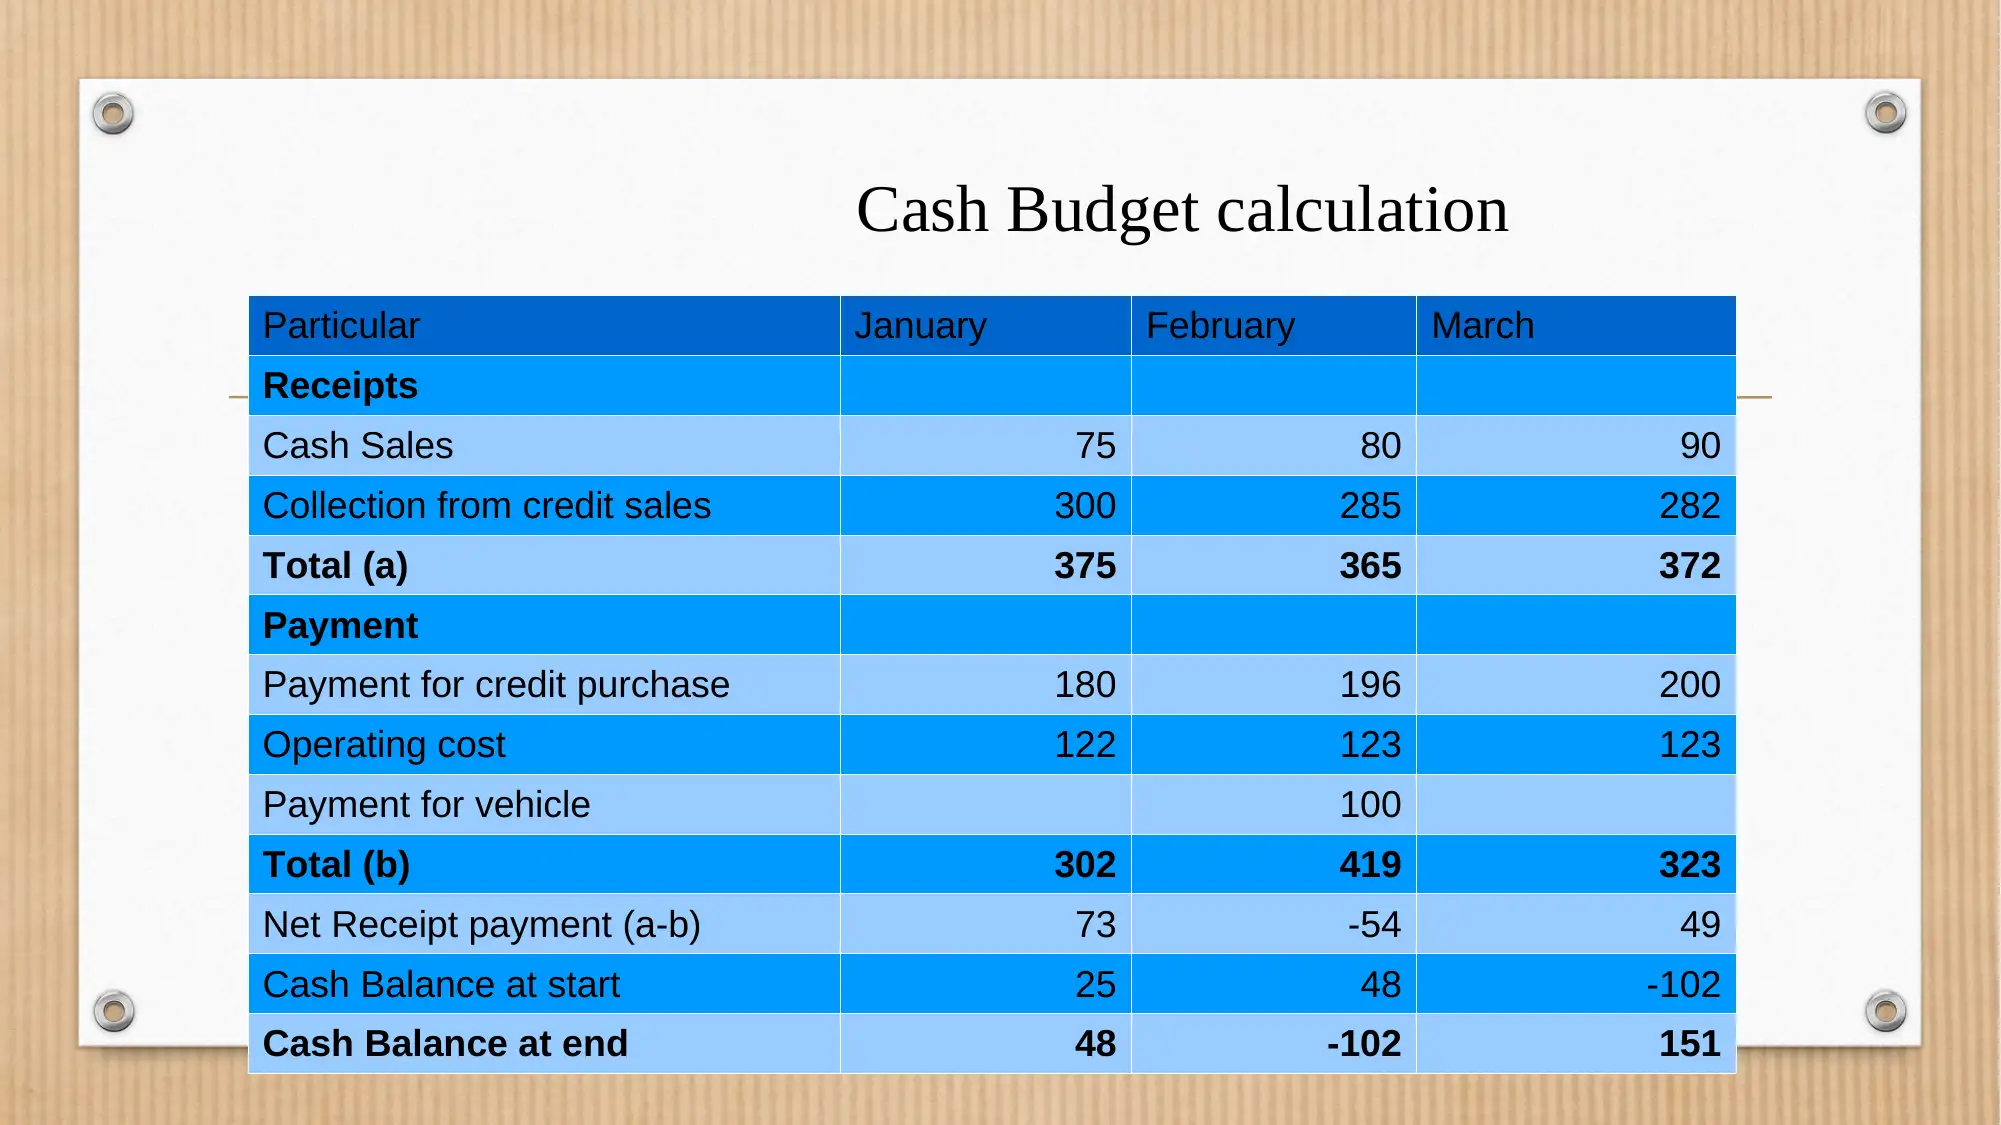
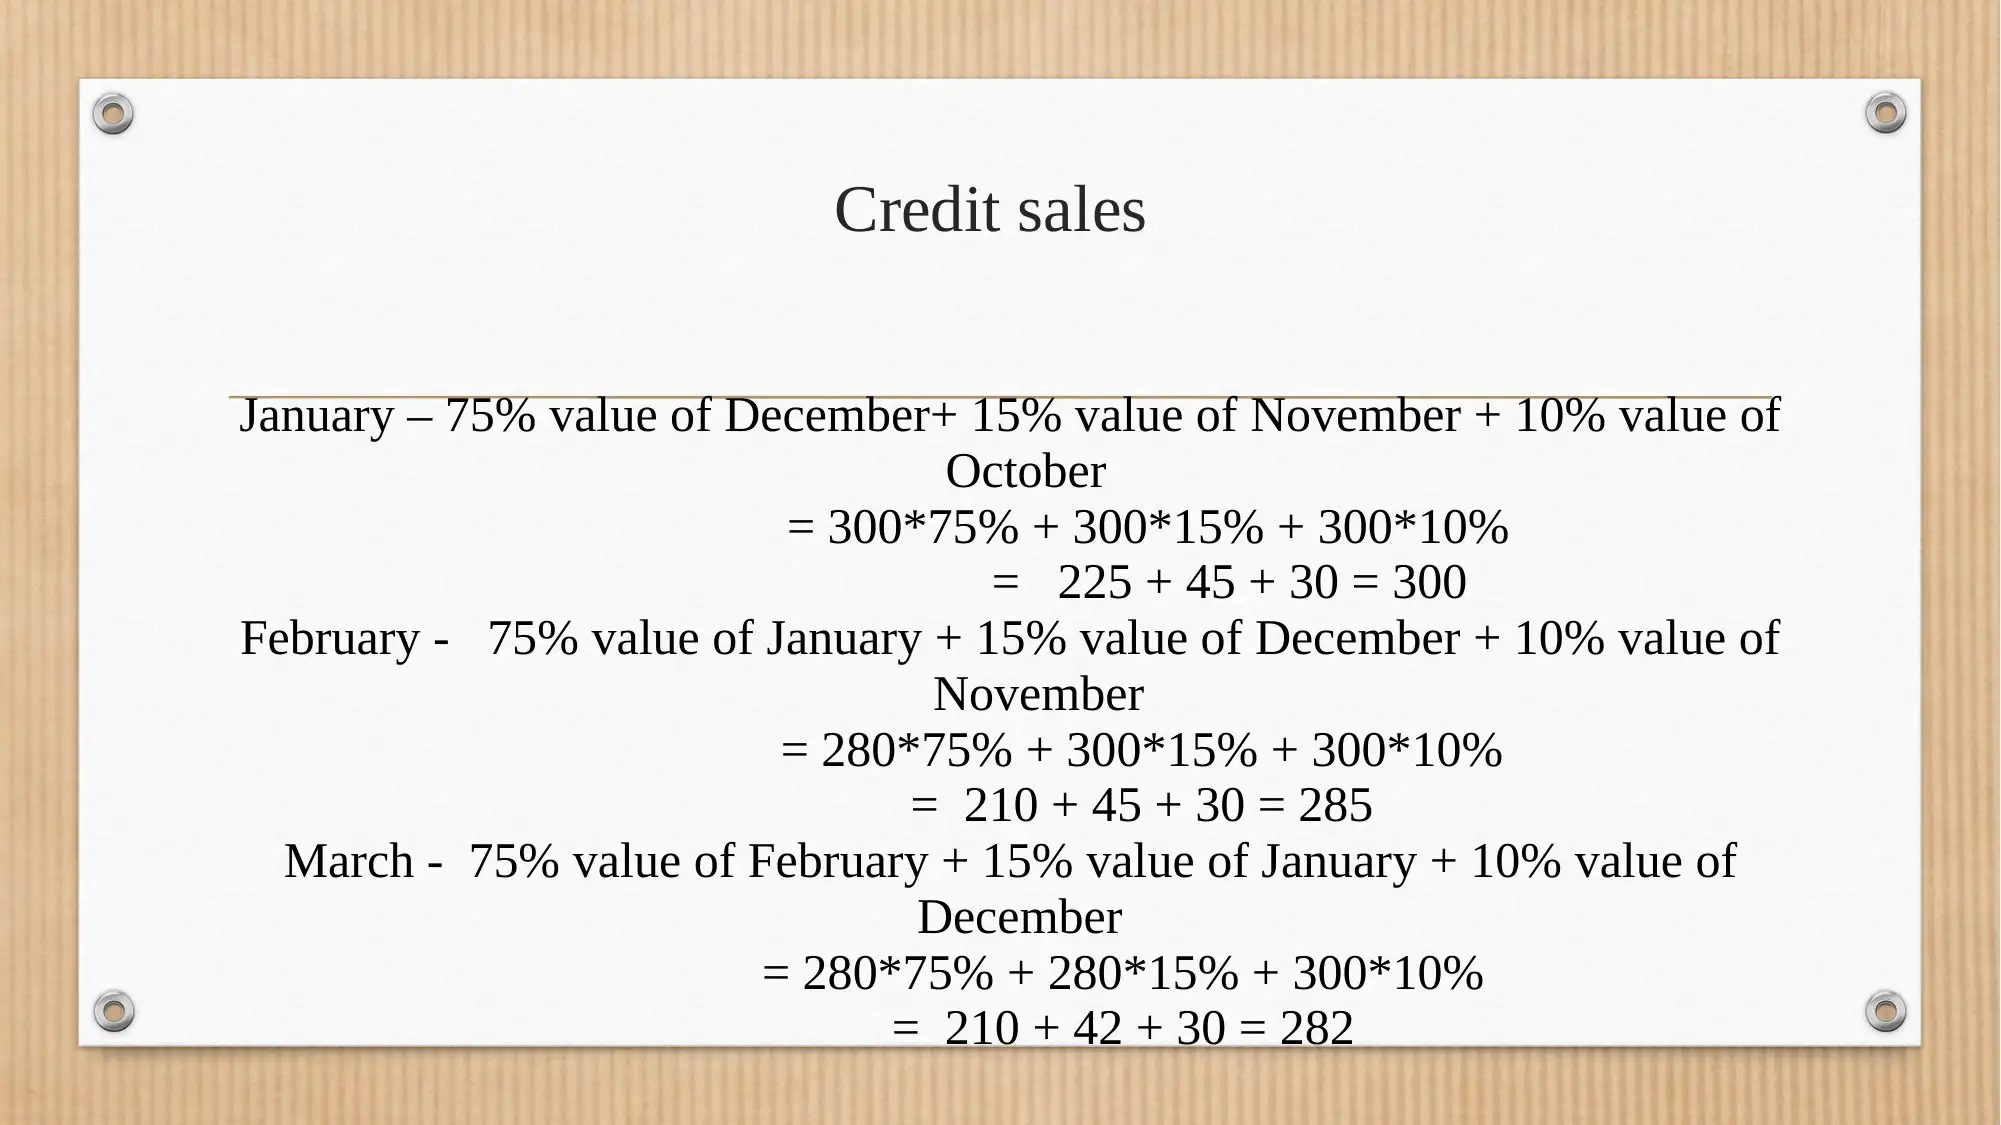
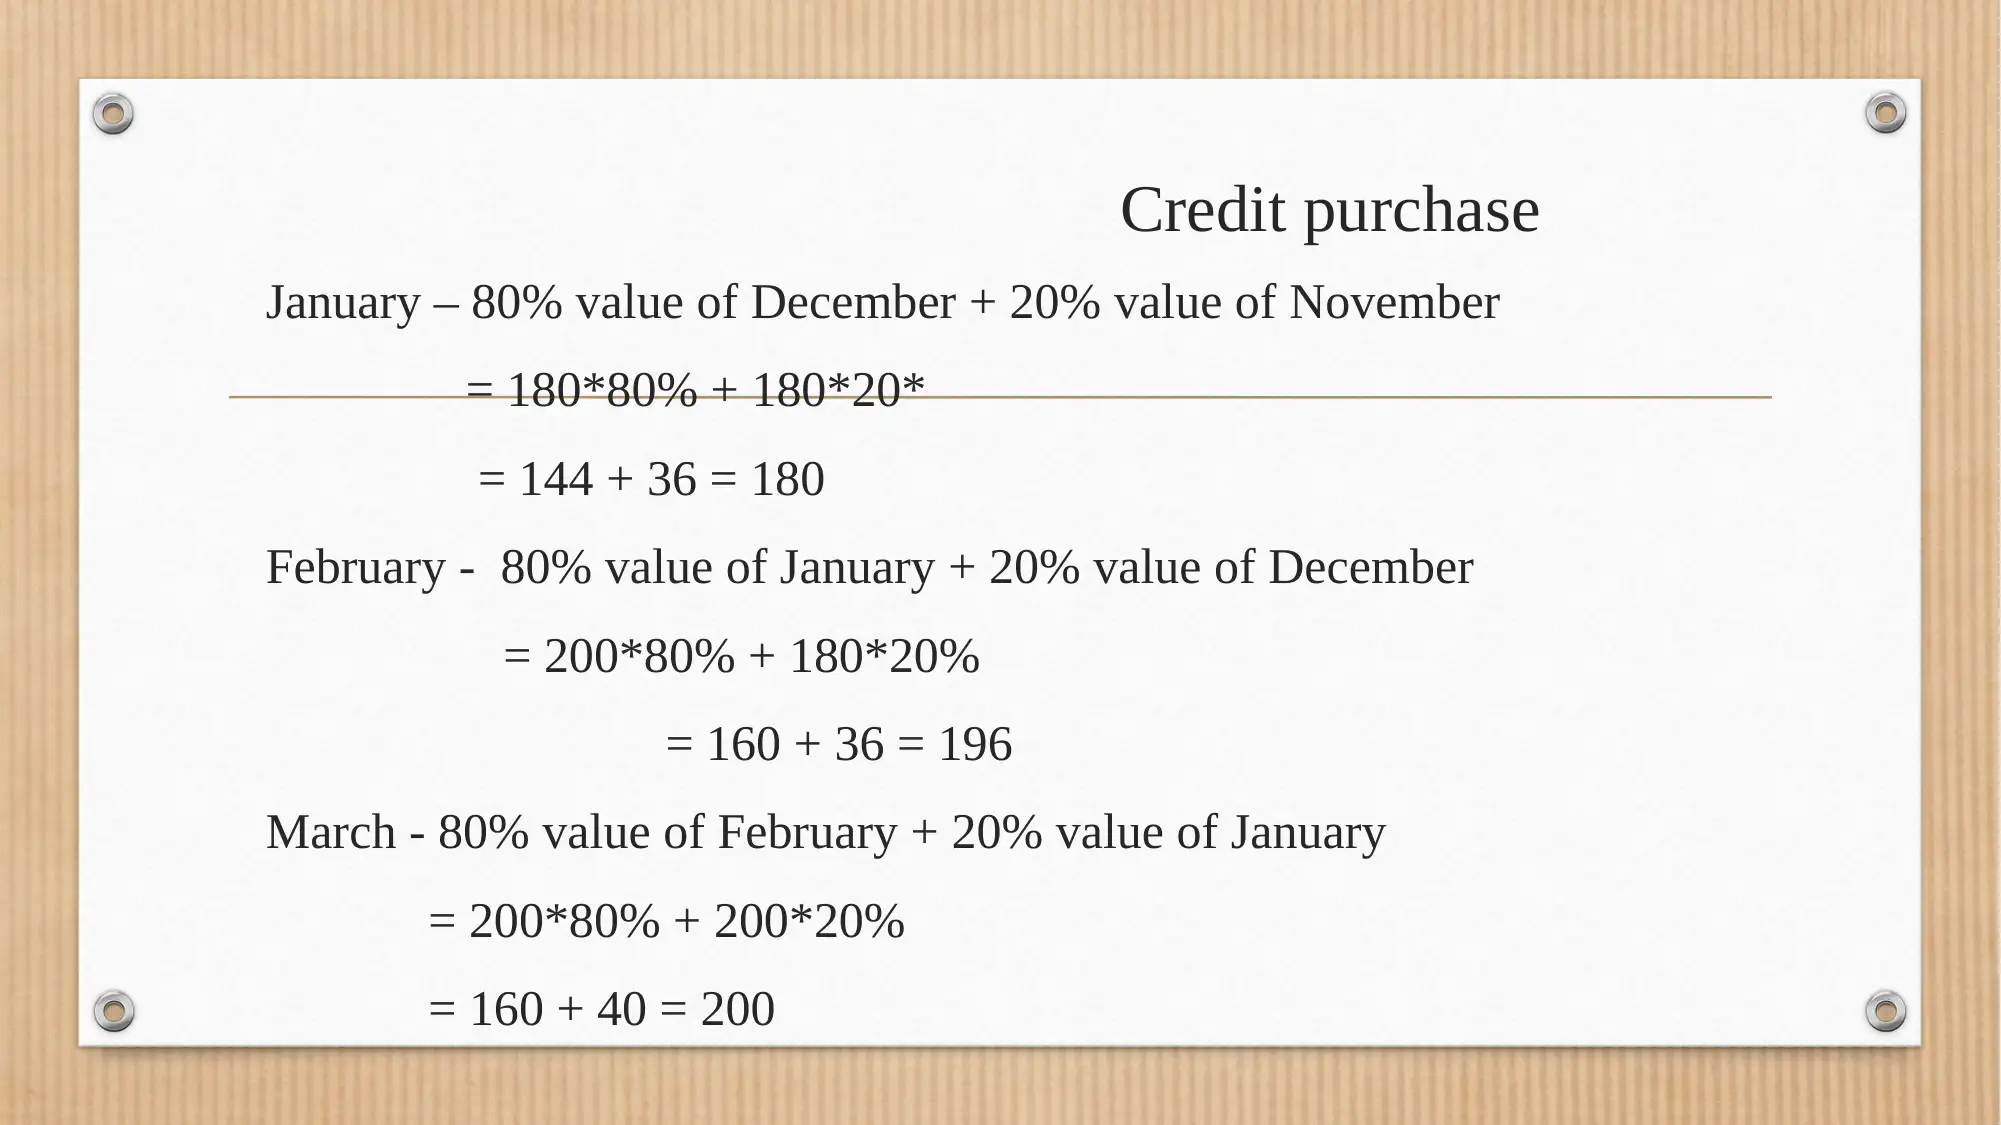
This report provides a comprehensive overview of Cost-Volume-Profit (CVP) analysis and its application in managing financial resources. It begins with a definition and graphical representation of CVP, illustrating the relationship between costs, volume, and profit. The report includes detailed calculations related to total costs, along with a cash budget that outlines cash receipts and payments for January, February, and March. It also presents calculations for credit sales and purchases, offering insights into how these transactions impact financial planning. The report concludes by summarizing the key findings and emphasizing the importance of break-even analysis in achieving desired financial outcomes. References to relevant academic resources are provided.
tabler-icon-diamond-filled.svg

Contribute Materials

Your contribution can guide someone’s learning journey. Share your documents today.
Document Page
MANAGING FINANCIAL
RESOURCES
tabler-icon-diamond-filled.svg

Secure Best Marks with AI Grader

Need help grading? Try our AI Grader for instant feedback on your assignments.
Document Page
Table of content
Introduction
CVP Definition and graph
CVP Calculations
Cash budget
Credit sales and credit purchase
Conclusion
References
Document Page
Introduction
This presentation present the graphical representation of Cost-Volume-Profit
and brief overview of CVP concept. Calculations regarding total cost
calculations are also defined in this report. Cash budget and calculations for
credit sales and purchases are presented in this presentation.
Document Page
CVP Definition and graph
It is graphical introduction of cost volume profit examination. It demonstrates
the link between expense of actual units delivered and the volume of units
manufactured by utilizing distinctive costs like variable, semi variable and
fixed. It resolve the adjustments in expense and volume that may influence
association's operative profits. In this diagram all the selling, collection and
administration costs can be recognized as fixed and variable costs.
tabler-icon-diamond-filled.svg

Secure Best Marks with AI Grader

Need help grading? Try our AI Grader for instant feedback on your assignments.
Document Page
CVP Calculation
Total units Total fixed Sells Profit
5000 600000 400000 -450000
10000 600000 800000 -300000
20000 600000 1600000 0
25000 600000 2000000 84000
30000 600000 2400000 300000
Document Page
CVP GRAPH
Document Page
Cash budget
It is one of the important equipment that is utilized by various organisation
to record cash exchanges whether these are identified with cash receipts
and instalment payments. Cash budgets produce information regarding
requirement of cash to execute future business operations and functions.
tabler-icon-diamond-filled.svg

Paraphrase This Document

Need a fresh take? Get an instant paraphrase of this document with our AI Paraphraser
Document Page
Cash Budget calculation
Particular January February March
Receipts
Cash Sales 75 80 90
Collection from credit sales 300 285 282
Total (a) 375 365 372
Payment
Payment for credit purchase 180 196 200
Operating cost 122 123 123
Payment for vehicle 100
Total (b) 302 419 323
Net Receipt payment (a-b) 73 -54 49
Cash Balance at start 25 48 -102
Cash Balance at end 48 -102 151
Document Page
Credit sales
January – 75% value of December+ 15% value of November + 10% value of
October
= 300*75% + 300*15% + 300*10%
= 225 + 45 + 30 = 300
February - 75% value of January + 15% value of December + 10% value of
November
= 280*75% + 300*15% + 300*10%
= 210 + 45 + 30 = 285
March - 75% value of February + 15% value of January + 10% value of
December
= 280*75% + 280*15% + 300*10%
= 210 + 42 + 30 = 282
Document Page
Credit purchase
January – 80% value of December + 20% value of November
= 180*80% + 180*20*
= 144 + 36 = 180
February - 80% value of January + 20% value of December
= 200*80% + 180*20%
= 160 + 36 = 196
March - 80% value of February + 20% value of January
= 200*80% + 200*20%
= 160 + 40 = 200
tabler-icon-diamond-filled.svg

Secure Best Marks with AI Grader

Need help grading? Try our AI Grader for instant feedback on your assignments.
Document Page
Conclusion
The above report summarises the evaluation of CVP graph defines that there
is a parallel relation found between cost volume and profit ratio. Break
even analysis provides adequate requirement of production units to attain
desired results.
Document Page
References
Noreen, E.W., Brewer, P.C. and Garrison, R.H., 2014. Managerial accounting
for managers. New York: McGraw-Hill/Irwin.
Renz, D.O., 2016. The Jossey-Bass handbook of non-profit leadership and
management. John Wiley & Sons.
Online
Cost Volume Profit Graph. 2018. [Online]. Available through:
<http://hong.hankk.co/cvp-chart/>.
Document Page
THANK YOU
chevron_up_icon
1 out of 13
circle_padding
hide_on_mobile
zoom_out_icon
logo.png

Your All-in-One AI-Powered Toolkit for Academic Success.

Available 24*7 on WhatsApp / Email

[object Object]