Financial Decision Making Project Report: Facebook Inc Analysis
VerifiedAdded on 2023/03/17
|19
|4593
|26
Report
AI Summary
This report, a financial analysis of Facebook Inc., examines the company's capital structure and dividend policy and their impact on financial performance. It begins with an executive summary and an introduction outlining the purpose and objectives, followed by an overview of the company and its financial position. The report then reviews relevant literature on capital structure and dividend policy, providing a theoretical foundation for the analysis. The core of the report involves a detailed analysis and evaluation of Facebook's financial status, including its capital structure, WACC calculation, and dividend analysis. The report proposes changes to capital structure and dividend policies to enhance profitability and shareholder return. Furthermore, it discusses the crucial role of finance in corporate governance, covering budgeting, planning, cash management, cost control, and risk management. The report concludes with a summary of findings and recommendations, supported by references and an appendix. The analysis uses data from the company's annual reports, financial statements, and industry benchmarks.
Running Head: Financial Decision Making 1
Project Report: Financial Decision Making
Project Report: Financial Decision Making
Paraphrase This Document
Need a fresh take? Get an instant paraphrase of this document with our AI Paraphraser
Financial Decision Making 2
Executive summary:
Financial decision making is process which includes various approaches used in the
companies to reach overall conclusion about the better presentation level of the company. In
the report, the study has been done over capital structure and dividend payout policies of
facebook Inc to measure the performance of the business and the impact of these factors over
the profitability ratio of the company. On the basis of overall study, it has been recognized
that the few changes should be done by the company in its capital structure and dividend
payout policies to improve the overall performance of the company.
Financial Decision Making 3
Contents
Executive summary..........................................................................................................2
1. Introduction..............................................................................................................5
1.1 Purpose and objective.............................................................................................5
1.2 Company overview.................................................................................................5
1.3 Financial and investing position.............................................................................6
2. Literature review......................................................................................................6
2.1 Capital structure......................................................................................................6
2.2 Dividend policy......................................................................................................7
3. Analysis and evaluation...........................................................................................8
3.1 Financial status and performance of Facebook......................................................8
3.2 Capital structure of Facebook...............................................................................11
3.3 Dividend analysis of Facebook.............................................................................12
4. Results and proposal..............................................................................................12
4.1 Capital structure....................................................................................................12
4.2 Dividend policy....................................................................................................13
5. Discussion: the role of finance in corporate governance.......................................14
5.1 Finance in budgeting and planning.......................................................................14
5.2 Finance in cash management................................................................................14
5.3 Finance in cost control and planning....................................................................15
5.4 Risk management..................................................................................................15
6. Conclusion.............................................................................................................16
References.......................................................................................................................17
Appendix.........................................................................................................................19
⊘ This is a preview!⊘
Do you want full access?
Subscribe today to unlock all pages.
Trusted by 1+ million students worldwide

Financial Decision Making 4
Paraphrase This Document
Need a fresh take? Get an instant paraphrase of this document with our AI Paraphraser
Financial Decision Making 5
1. Introduction:
1.1 Purpose and objective:
In an organization, a vital role is played by the dividend policy followed by the
organization and the capital structure maintained by the company. Dividend policy and the
capitals structure directly affect over the financial performance of the company. Hence, it
becomes important for the financial manager of the business to make better decision about
these aspects. Capital structure is explained as the combination of numerous sources on the
basis of which funds are raised by the company (Rabin, 2013). It mainly includes the debt
and equity level of the company. An organization is always suggested to prepare an optimal
capital structure in order to maintain better market and financial position of the business.
Optimal capital structure defines about the better arrangement of debt and equity in order to
reduce the total cost of capital and associated risk of the company.
It has been studied that capital structure of an organization could be affected through
various internal and external factors such as economical position, classification of market,
internal changes in the company, cash flow and collateral value of company’s asset. Further,
dividend policy defines about the plan presented and followed by the company to pay the
dividend amount to its investors. Dividend amount is always paid by the company to its
shareholders against their investment into the stock of the company. Dividends are retained
and paid off by the organization on the basis of their policies (Palicka, 2011). This report
focuses over the capital structure and dividend policy relation with the financial performance
of the company. In the report, Facebook Inc has been taken into consideration to identify the
capital structure and dividend policy relation in an organization.
1.2 Company overview:
Facebook Inc is an American international company which is basically a social
networking website. It offers the online social networking services to its customers. Company
has been founded in the year of 2004 by Mark Zuckerberg. Headquarter of the company is in
California, US. The company is offering its services worldwide except the few countries
where the website has been blocked. According to a recent report, 2.3 billion people are
monthly active user of Facebook. Company has offered app services as well to access the
Financial Decision Making 6
profile from anywhere (Home, 2019). The market share and financial market share of the
company is quite higher and depicts about better performance level of the company.
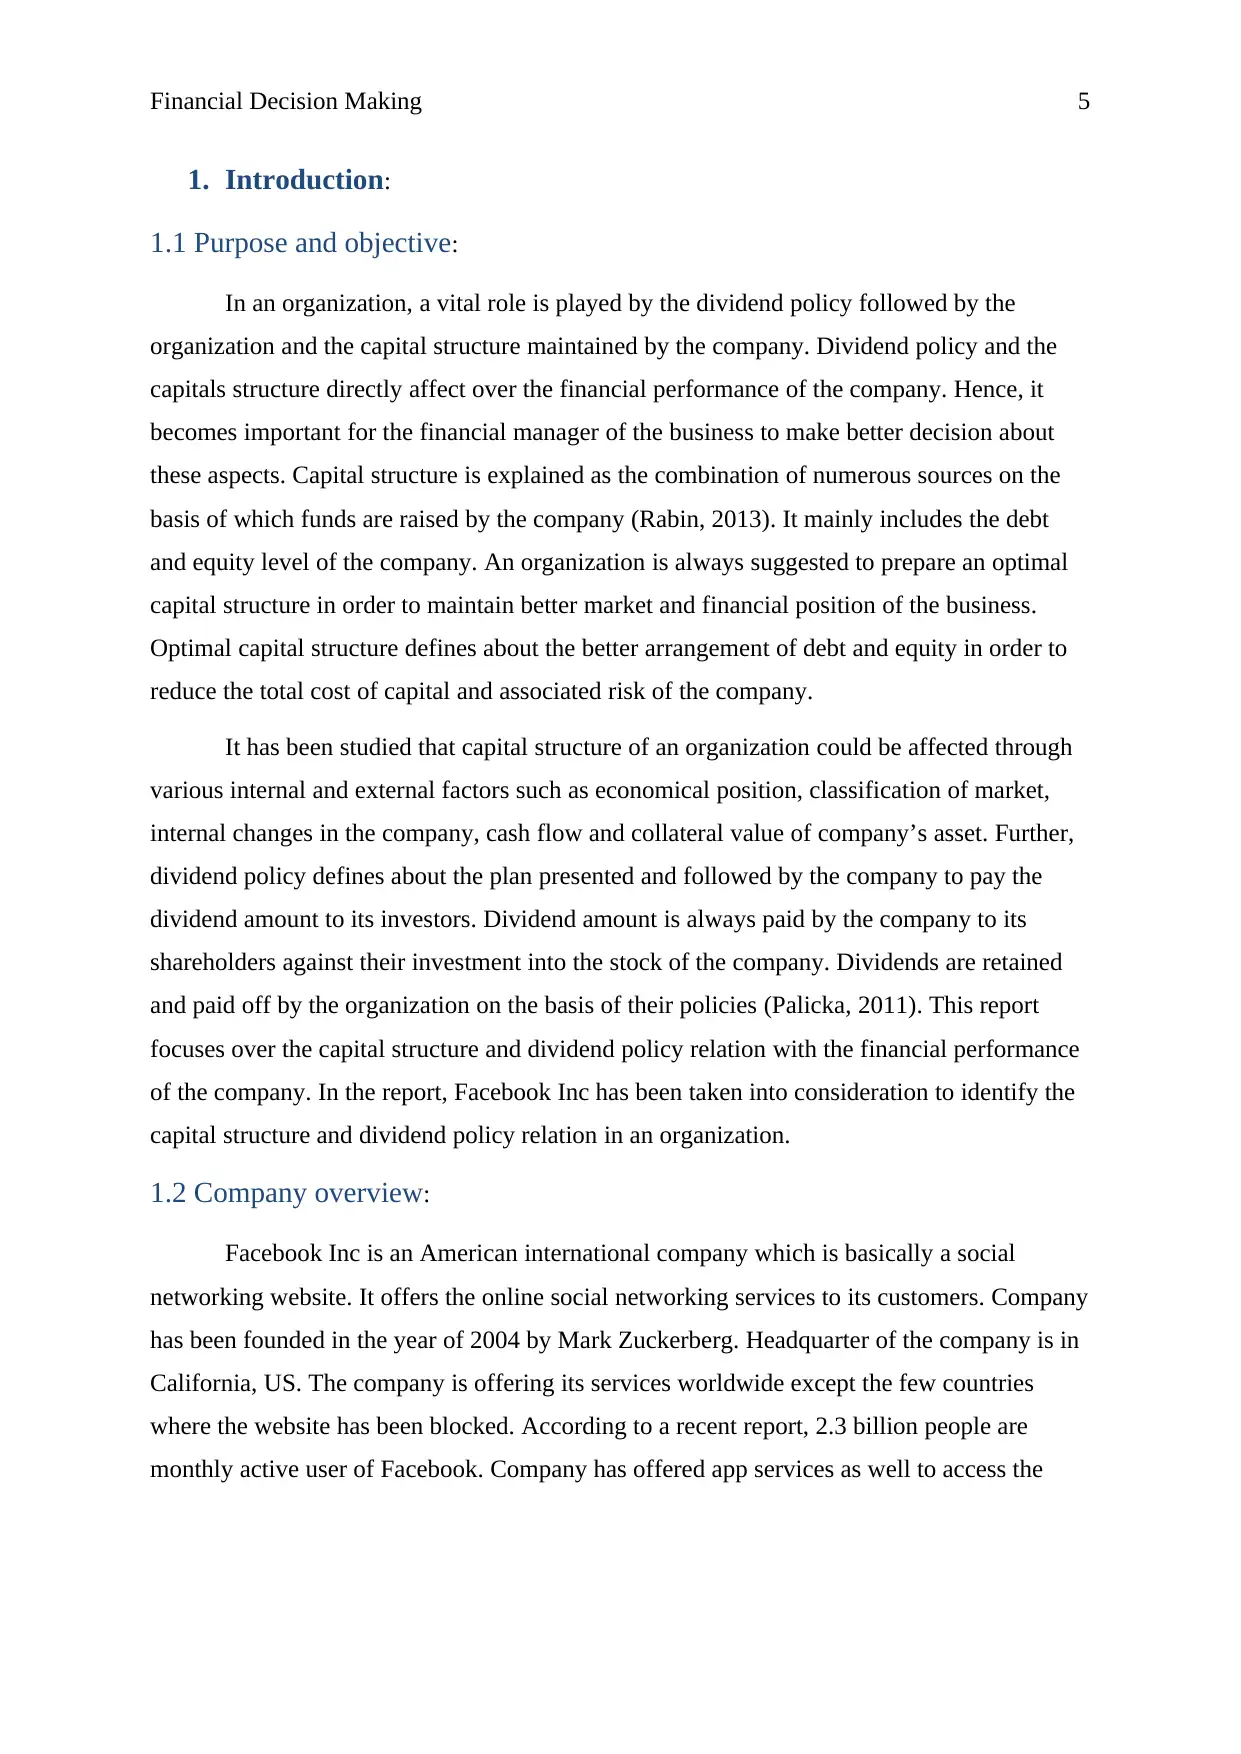
1.3 Financial and investing position:
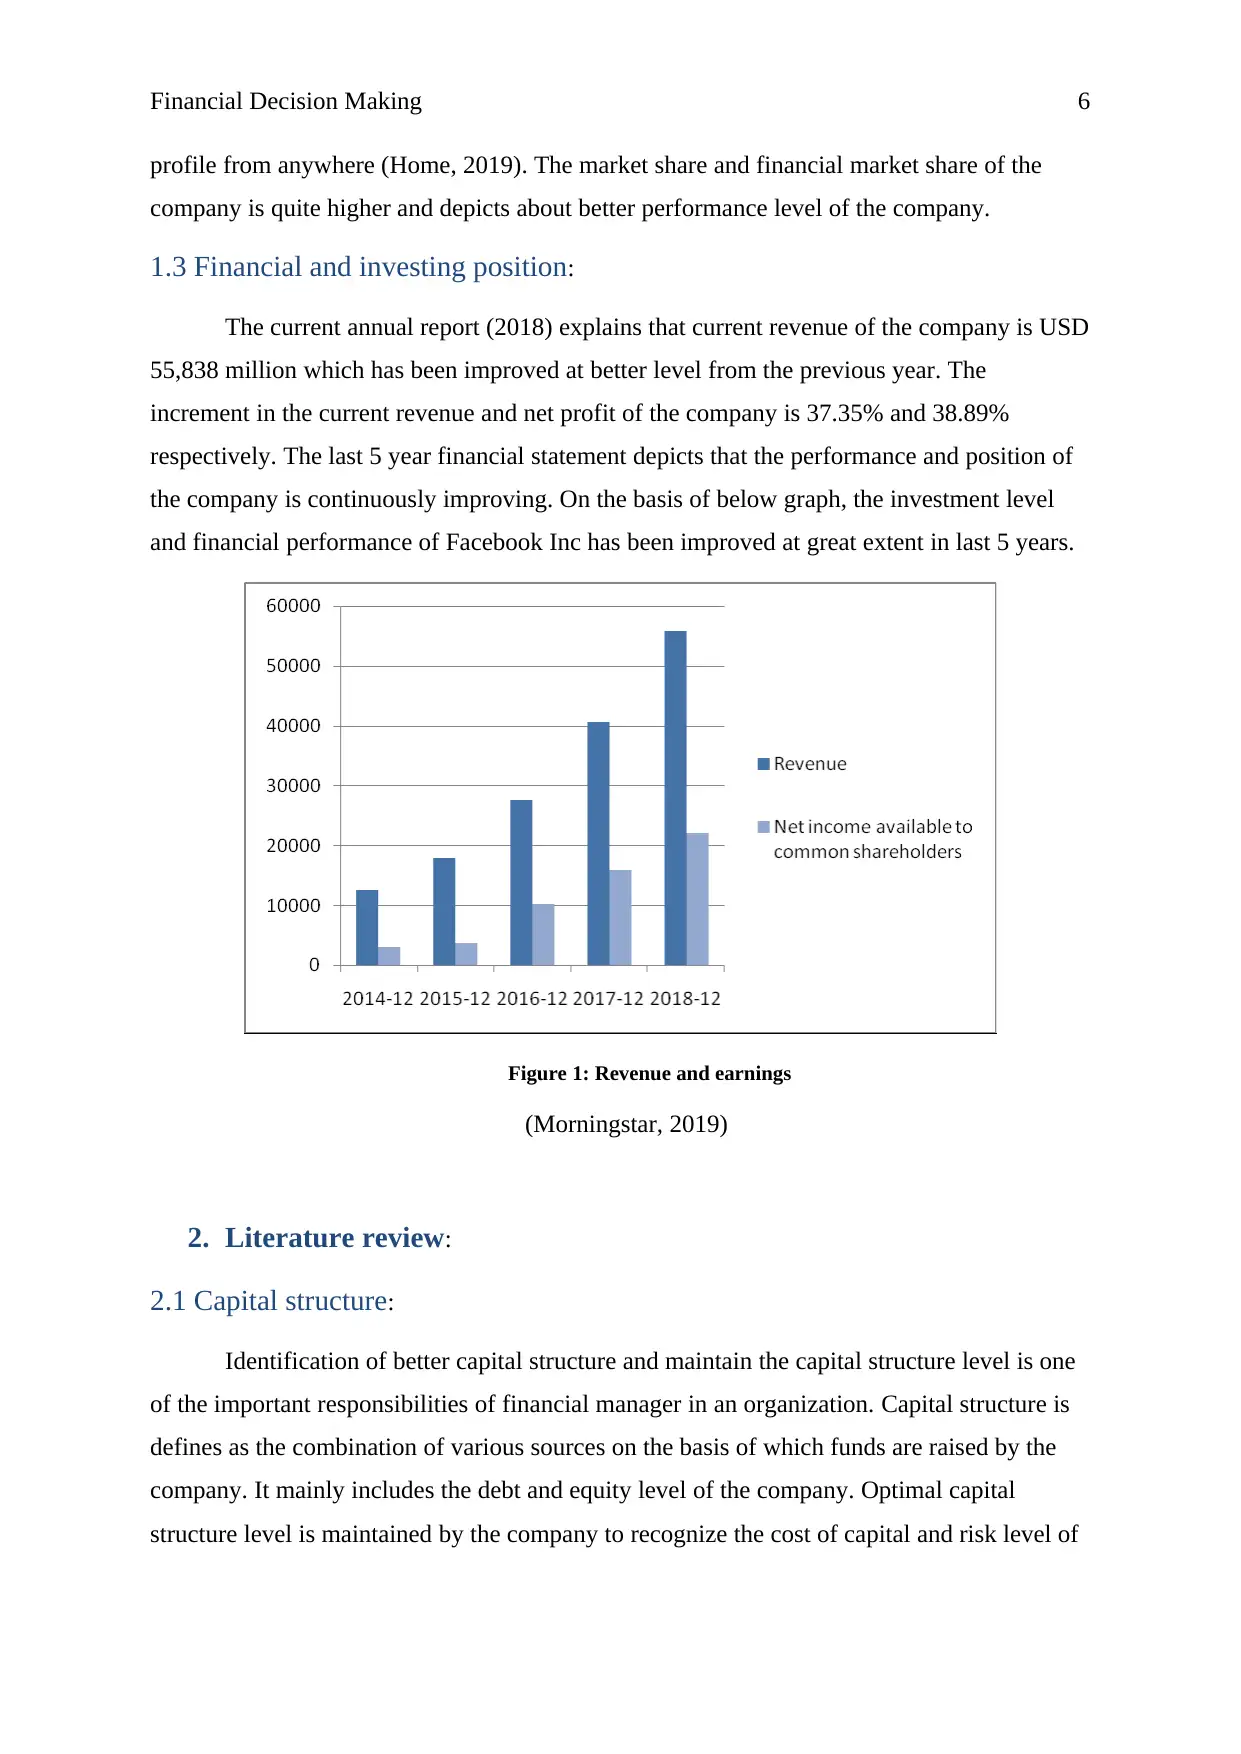
The current annual report (2018) explains that current revenue of the company is USD
55,838 million which has been improved at better level from the previous year. The
increment in the current revenue and net profit of the company is 37.35% and 38.89%
respectively. The last 5 year financial statement depicts that the performance and position of
the company is continuously improving. On the basis of below graph, the investment level
and financial performance of Facebook Inc has been improved at great extent in last 5 years.
Figure 1: Revenue and earnings
(Morningstar, 2019)
2. Literature review:
2.1 Capital structure:
Identification of better capital structure and maintain the capital structure level is one
of the important responsibilities of financial manager in an organization. Capital structure is
defines as the combination of various sources on the basis of which funds are raised by the
company. It mainly includes the debt and equity level of the company. Optimal capital
structure level is maintained by the company to recognize the cost of capital and risk level of
profile from anywhere (Home, 2019). The market share and financial market share of the
company is quite higher and depicts about better performance level of the company.
1.3 Financial and investing position:
The current annual report (2018) explains that current revenue of the company is USD
55,838 million which has been improved at better level from the previous year. The
increment in the current revenue and net profit of the company is 37.35% and 38.89%
respectively. The last 5 year financial statement depicts that the performance and position of
the company is continuously improving. On the basis of below graph, the investment level
and financial performance of Facebook Inc has been improved at great extent in last 5 years.
Figure 1: Revenue and earnings
(Morningstar, 2019)
2. Literature review:
2.1 Capital structure:
Identification of better capital structure and maintain the capital structure level is one
of the important responsibilities of financial manager in an organization. Capital structure is
defines as the combination of various sources on the basis of which funds are raised by the
company. It mainly includes the debt and equity level of the company. Optimal capital
structure level is maintained by the company to recognize the cost of capital and risk level of
⊘ This is a preview!⊘
Do you want full access?
Subscribe today to unlock all pages.
Trusted by 1+ million students worldwide
Financial Decision Making 7
the company (Porcelli & Delgado, 2009). An organization is always suggested to prepare an
optimal capital structure in order to maintain better market and financial position of the
company. Optimal capital structure defines about the better combination of debt and equity in
order to reduce the total cost of capital and associated risk of the company (Mandell &
Hanson, 2009).
There is no ideal ratio of optimal capital structure. Optimal capital structure of an
organization depends on the industry and internal position of the company. The main aim of
optimal capital structure is to reduce the overall cost of capital of the company along with the
associated risk (Palicka, 2011). It has been studied that capital structure of an organization
could be affected through various internal and external factors such as economical position,
classification of market, internal changes in the company, cash flow and collateral value of
company’s asset.
The main aspect of optimal capital structure is optimal debt ratio. It defines that the
debt level must be managed in such a way that short term and long term debt level of the
company is manageable against the total assets and equity of the company. Higgins (2012)
explains that some of the companies prefer debt capital due to lower cost of capital whereas
some prefers equity capital to reduce the risk level. However, the capital structure hardly
impacts over the financial performance of the company. According to a research conduct of
Egypt Company, it has been found that debt and financial performance doesn’t have any
correlation (Koropp, Kellermanns Grichnik & Stanley, 2014).
2.2 Dividend policy:
Dividend amount is known as the total amount which has been paid by the company
to the investors through the net profit earned in consideration of their investment in the
company. It is one of the curtail and complex process as financial manager of the company
has to decide the dividend payout on the basis of market demand and company’s performance
Dividend policy defines about the plan presented and followed by the company to pay the
dividend amount to its investors. Net profits are retained and paid off by the organization on
the basis of their policies. Modigliani and miller (1958) defined that an organization’s main
objectives is to enhance the stockholder’s worth. Hence, the dividend amount, time and rate
are decided by the company accordingly. Madura (2014) has defined that the higher the
dividend would be paid by the company, the more the stock’s worth of the company would
Paraphrase This Document
Need a fresh take? Get an instant paraphrase of this document with our AI Paraphraser
Financial Decision Making 8
be improved whereas Elton, Gruber, Brown & Goetzmann, (2009) has argued that instead of
distributing the net profit as dividend, company should retain the profit for long term projects,
it would improve the market worth of the company.
3. Analysis and evaluation:
3.1 Financial status and performance of Facebook:
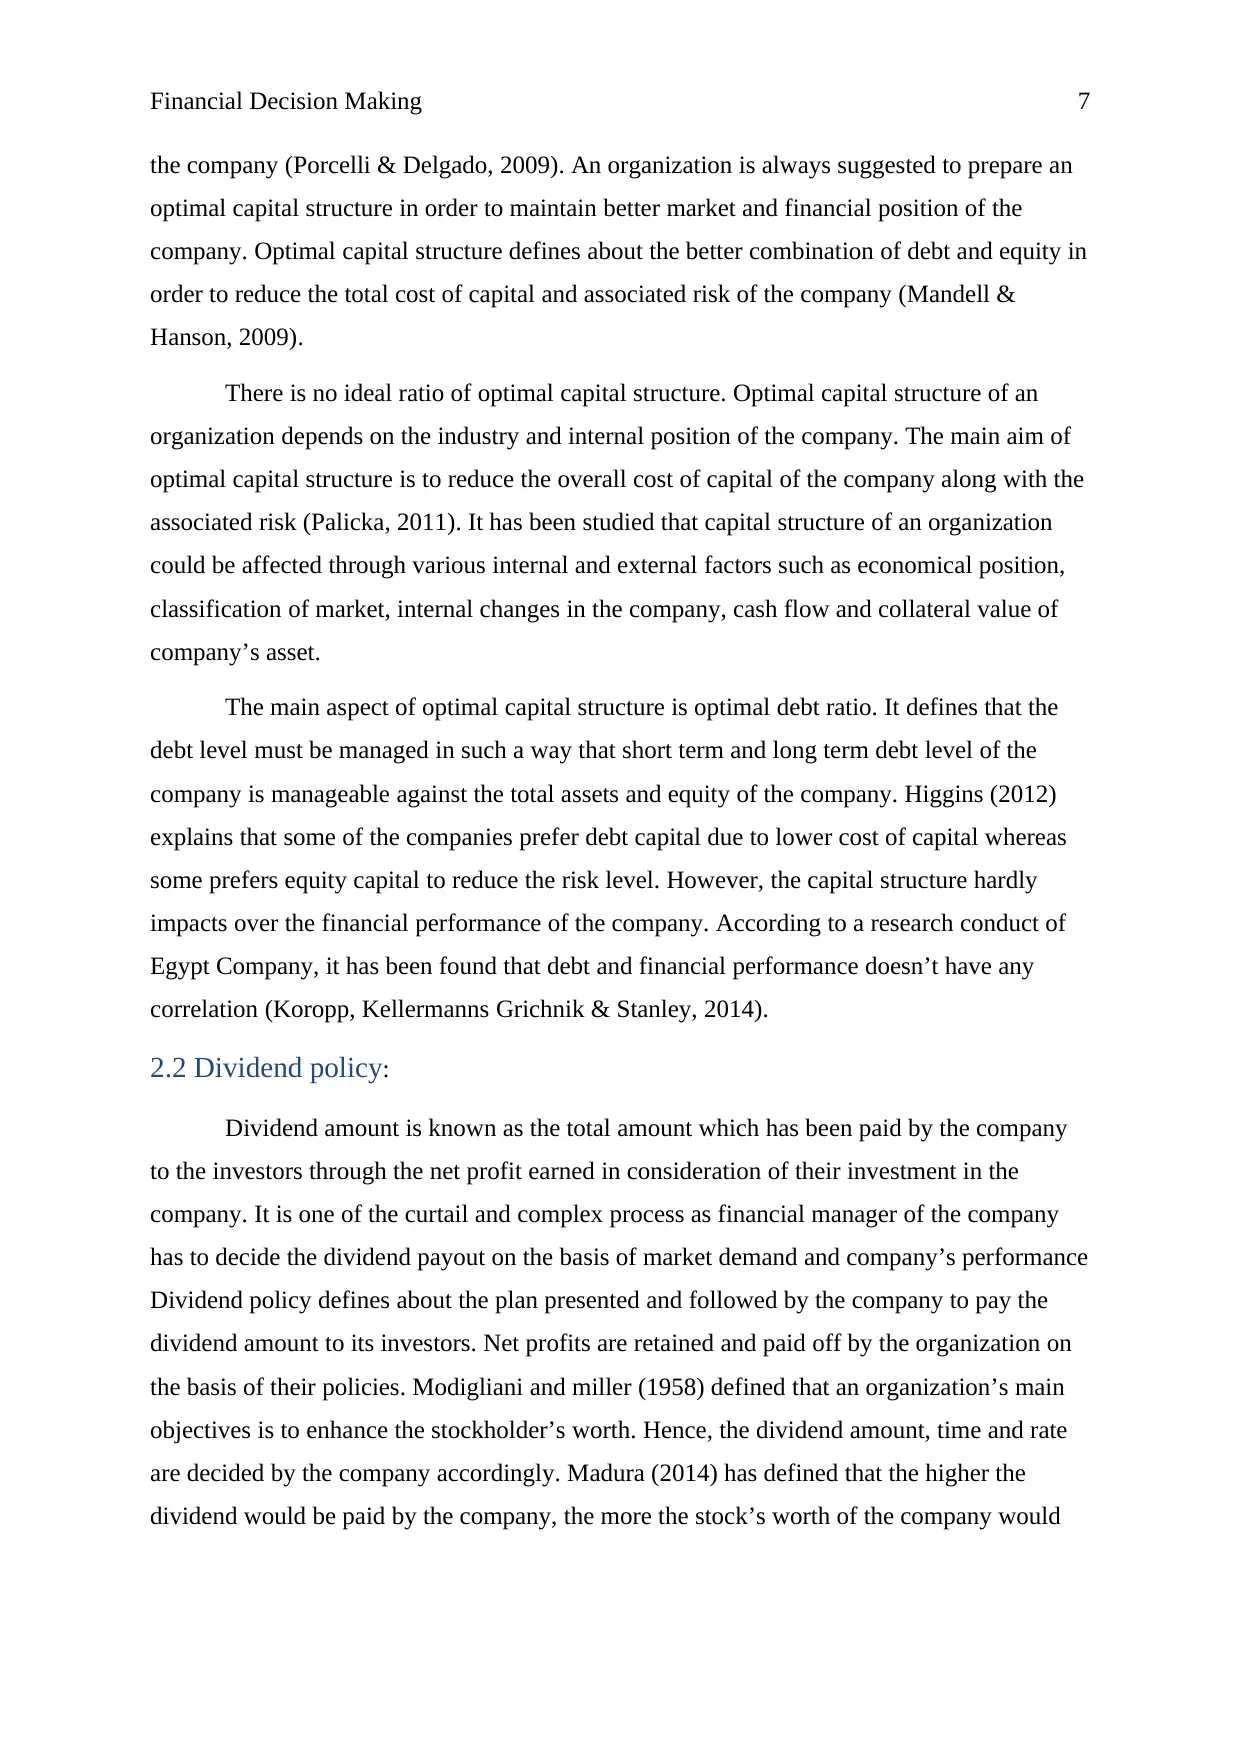
The annual report (2018) of Facebook Inc has been studied to recognize the capital
structure of the company. On the basis of study, it has been recognized that total equity, debt
and total assets of the company are $ 84,127 thousand, $ 13,207 thousand and $ 97334
thousand. It defines that the debt to equity ratio of the company is 15.70%.
Figure 2: Capital structure
(Annual report, 2018)
Further, cost of capital of the company has been calculated. WACC is the total cost
which would be paid by the company against the various sources used to raise the funds for
the company. On the basis of annual report (2018), it has been found that the main source of
capital of the company is equity and debt. The cost of capital study has been applied over the
company to identify the total cost. Initially, the cost of equity has been calculated and found
that total cost of equity of the company is 6.95% and the share of equity in total capital
structure is 86.43%.
Cost of Equity: CAPM model
be improved whereas Elton, Gruber, Brown & Goetzmann, (2009) has argued that instead of
distributing the net profit as dividend, company should retain the profit for long term projects,
it would improve the market worth of the company.
3. Analysis and evaluation:
3.1 Financial status and performance of Facebook:
The annual report (2018) of Facebook Inc has been studied to recognize the capital
structure of the company. On the basis of study, it has been recognized that total equity, debt
and total assets of the company are $ 84,127 thousand, $ 13,207 thousand and $ 97334
thousand. It defines that the debt to equity ratio of the company is 15.70%.
Figure 2: Capital structure
(Annual report, 2018)
Further, cost of capital of the company has been calculated. WACC is the total cost
which would be paid by the company against the various sources used to raise the funds for
the company. On the basis of annual report (2018), it has been found that the main source of
capital of the company is equity and debt. The cost of capital study has been applied over the
company to identify the total cost. Initially, the cost of equity has been calculated and found
that total cost of equity of the company is 6.95% and the share of equity in total capital
structure is 86.43%.
Cost of Equity: CAPM model
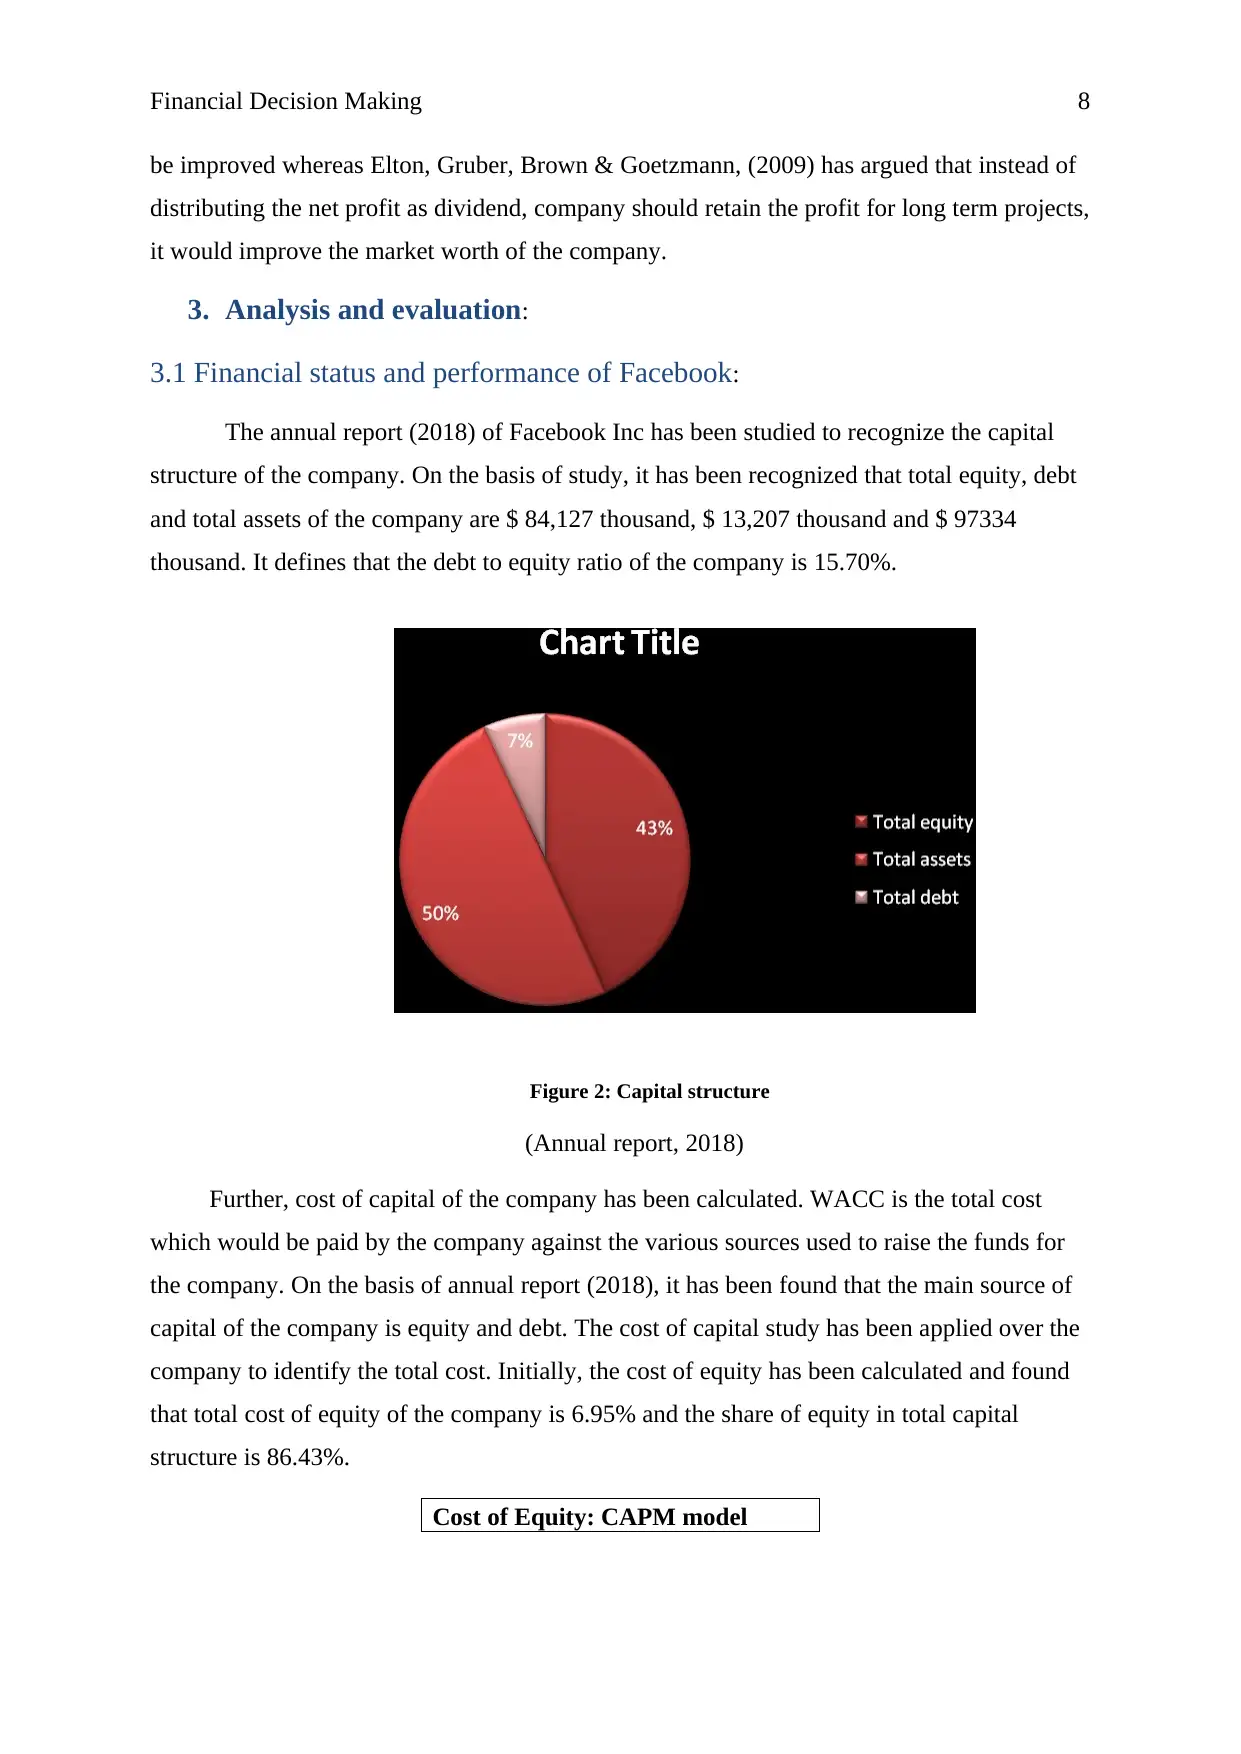
Financial Decision Making 9
A. Risk free rate 2.83%
B. Market rate of return 6%
C. Beta 1.30
D. CAPM 6.95%
(Yahoo finance, 2019)
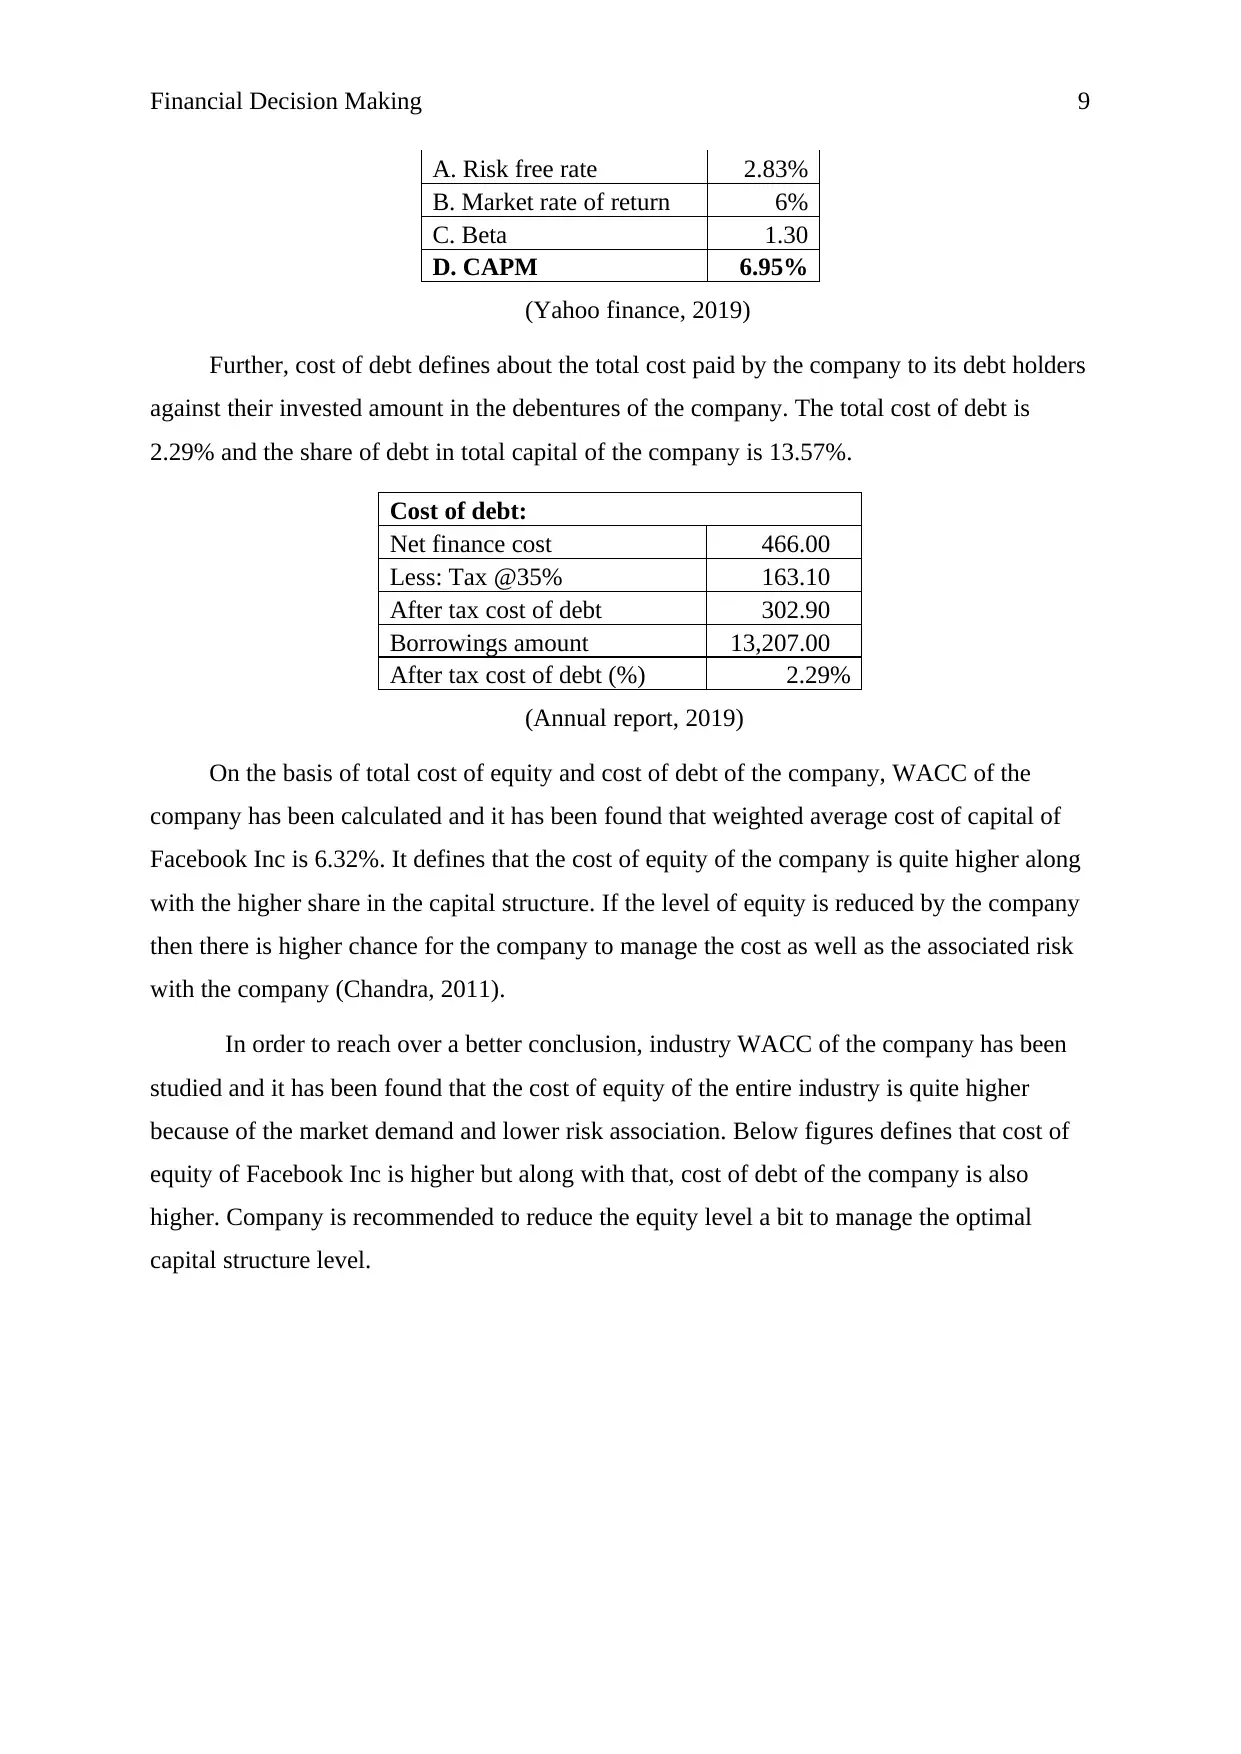
Further, cost of debt defines about the total cost paid by the company to its debt holders
against their invested amount in the debentures of the company. The total cost of debt is
2.29% and the share of debt in total capital of the company is 13.57%.
Cost of debt:
Net finance cost 466.00
Less: Tax @35% 163.10
After tax cost of debt 302.90
Borrowings amount 13,207.00
After tax cost of debt (%) 2.29%
(Annual report, 2019)
On the basis of total cost of equity and cost of debt of the company, WACC of the
company has been calculated and it has been found that weighted average cost of capital of
Facebook Inc is 6.32%. It defines that the cost of equity of the company is quite higher along
with the higher share in the capital structure. If the level of equity is reduced by the company
then there is higher chance for the company to manage the cost as well as the associated risk
with the company (Chandra, 2011).
In order to reach over a better conclusion, industry WACC of the company has been
studied and it has been found that the cost of equity of the entire industry is quite higher
because of the market demand and lower risk association. Below figures defines that cost of
equity of Facebook Inc is higher but along with that, cost of debt of the company is also
higher. Company is recommended to reduce the equity level a bit to manage the optimal
capital structure level.
A. Risk free rate 2.83%
B. Market rate of return 6%
C. Beta 1.30
D. CAPM 6.95%
(Yahoo finance, 2019)
Further, cost of debt defines about the total cost paid by the company to its debt holders
against their invested amount in the debentures of the company. The total cost of debt is
2.29% and the share of debt in total capital of the company is 13.57%.
Cost of debt:
Net finance cost 466.00
Less: Tax @35% 163.10
After tax cost of debt 302.90
Borrowings amount 13,207.00
After tax cost of debt (%) 2.29%
(Annual report, 2019)
On the basis of total cost of equity and cost of debt of the company, WACC of the
company has been calculated and it has been found that weighted average cost of capital of
Facebook Inc is 6.32%. It defines that the cost of equity of the company is quite higher along
with the higher share in the capital structure. If the level of equity is reduced by the company
then there is higher chance for the company to manage the cost as well as the associated risk
with the company (Chandra, 2011).
In order to reach over a better conclusion, industry WACC of the company has been
studied and it has been found that the cost of equity of the entire industry is quite higher
because of the market demand and lower risk association. Below figures defines that cost of
equity of Facebook Inc is higher but along with that, cost of debt of the company is also
higher. Company is recommended to reduce the equity level a bit to manage the optimal
capital structure level.
⊘ This is a preview!⊘
Do you want full access?
Subscribe today to unlock all pages.
Trusted by 1+ million students worldwide
Financial Decision Making 10
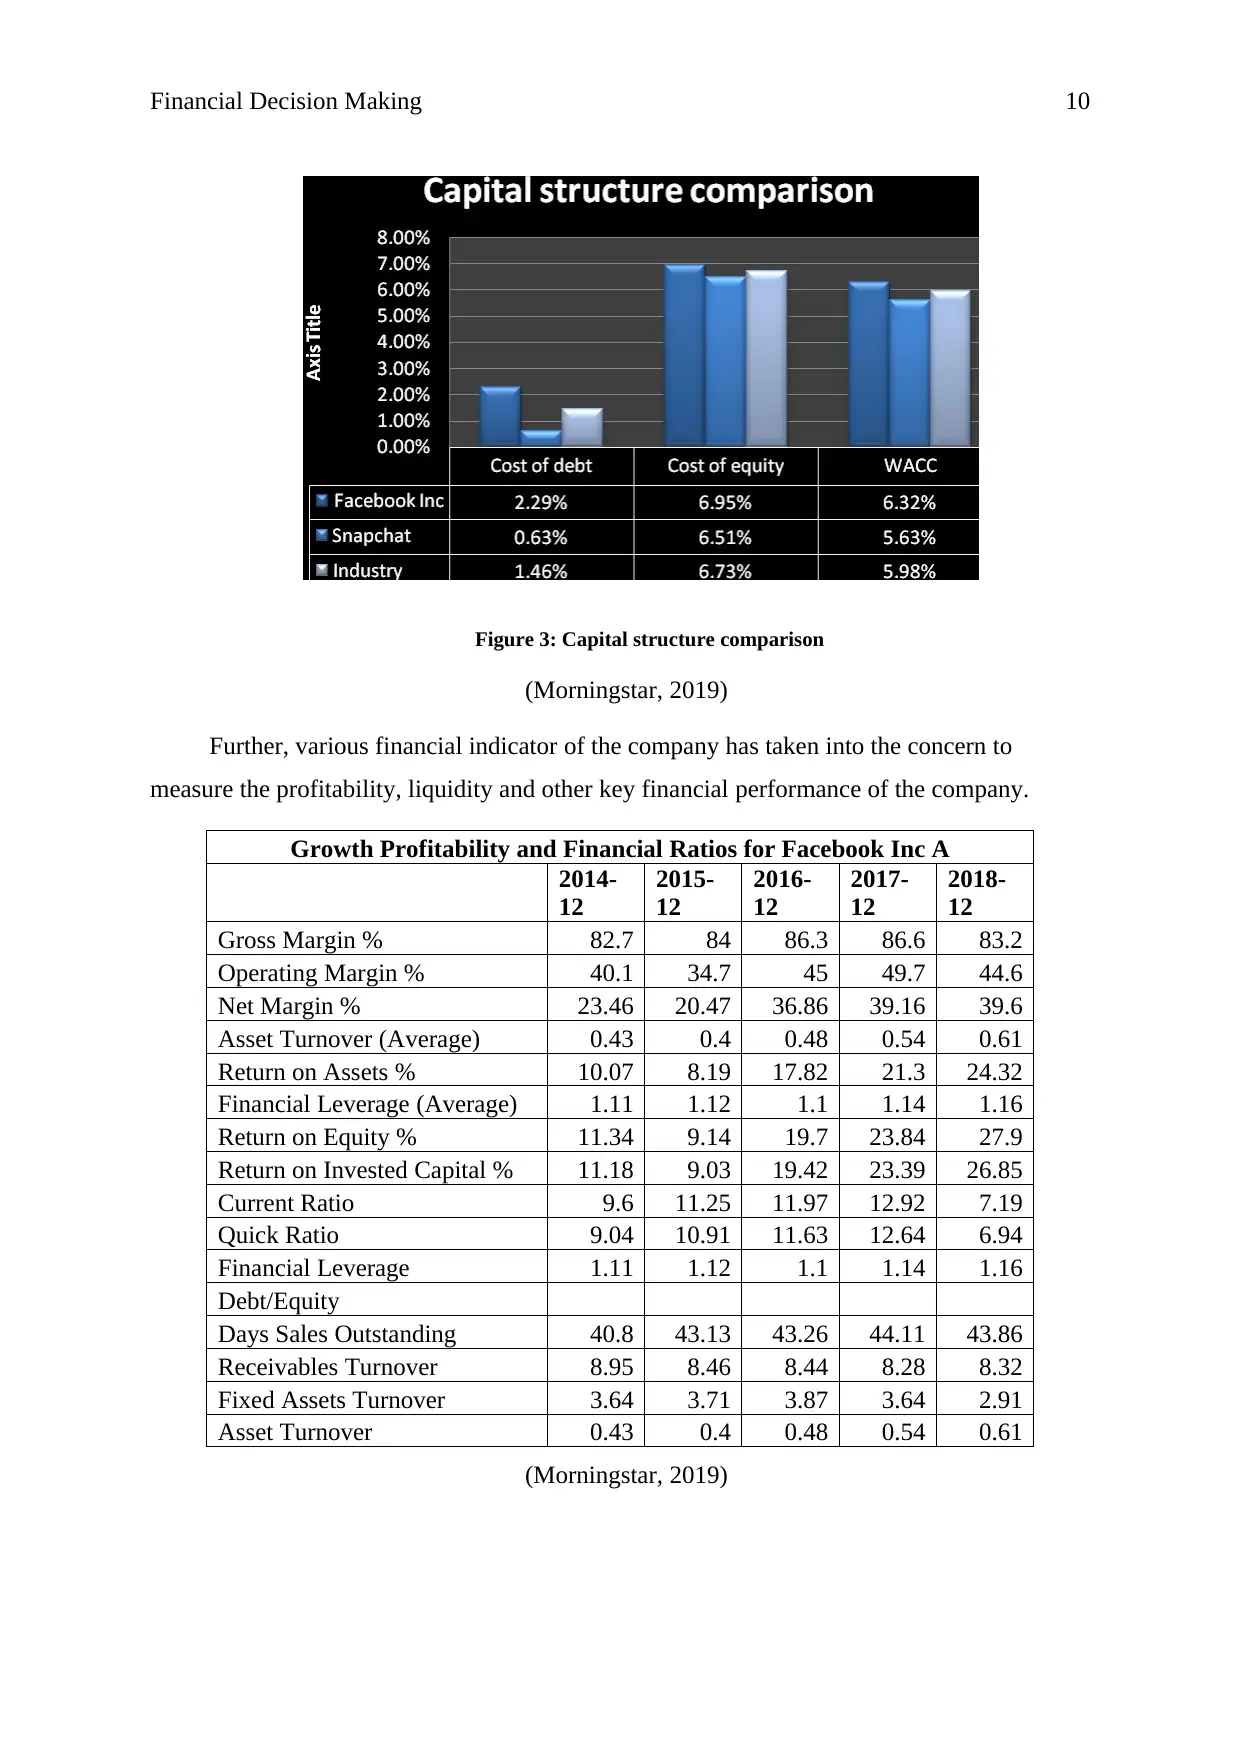
Figure 3: Capital structure comparison
(Morningstar, 2019)
Further, various financial indicator of the company has taken into the concern to
measure the profitability, liquidity and other key financial performance of the company.
Growth Profitability and Financial Ratios for Facebook Inc A
2014-
12
2015-
12
2016-
12
2017-
12
2018-
12
Gross Margin % 82.7 84 86.3 86.6 83.2
Operating Margin % 40.1 34.7 45 49.7 44.6
Net Margin % 23.46 20.47 36.86 39.16 39.6
Asset Turnover (Average) 0.43 0.4 0.48 0.54 0.61
Return on Assets % 10.07 8.19 17.82 21.3 24.32
Financial Leverage (Average) 1.11 1.12 1.1 1.14 1.16
Return on Equity % 11.34 9.14 19.7 23.84 27.9
Return on Invested Capital % 11.18 9.03 19.42 23.39 26.85
Current Ratio 9.6 11.25 11.97 12.92 7.19
Quick Ratio 9.04 10.91 11.63 12.64 6.94
Financial Leverage 1.11 1.12 1.1 1.14 1.16
Debt/Equity
Days Sales Outstanding 40.8 43.13 43.26 44.11 43.86
Receivables Turnover 8.95 8.46 8.44 8.28 8.32
Fixed Assets Turnover 3.64 3.71 3.87 3.64 2.91
Asset Turnover 0.43 0.4 0.48 0.54 0.61
(Morningstar, 2019)
Paraphrase This Document
Need a fresh take? Get an instant paraphrase of this document with our AI Paraphraser
Financial Decision Making 11
The above table defines that various positive changes have occurred into the financial
performance and financial position of the company in last few years. In comparison of
competitor companies, Facebook Inc is performing well in the market.
3.2 Capital structure of Facebook:
On the basis of annual report of the company, net income, operating cash flow,
revenue and capital structure level of Facebook Inc has been studied. The study explains that
various positive changes have taken place into the financial performance and financial
position of the business in last few years. In comparison of competitor companies, Facebook
Inc is performing well in the market.
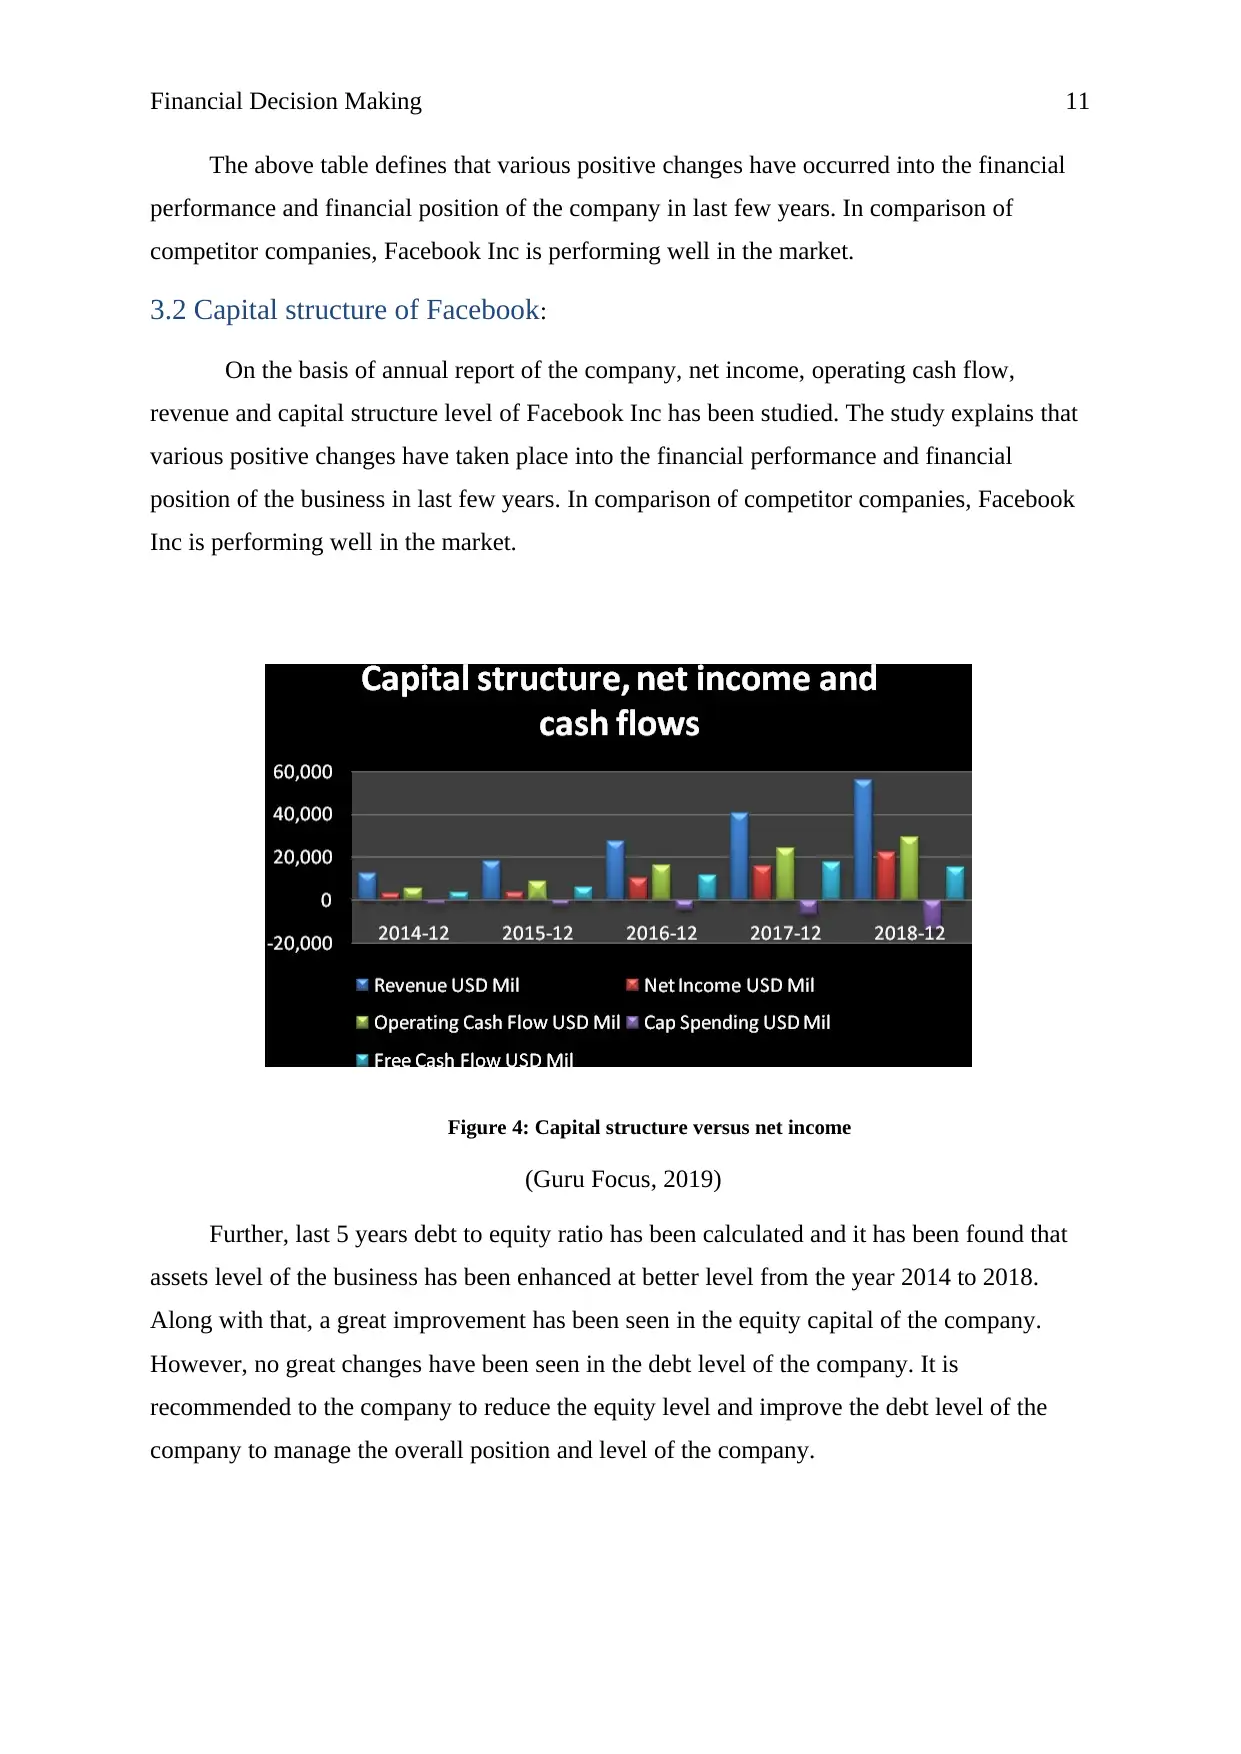
Figure 4: Capital structure versus net income
(Guru Focus, 2019)
Further, last 5 years debt to equity ratio has been calculated and it has been found that
assets level of the business has been enhanced at better level from the year 2014 to 2018.
Along with that, a great improvement has been seen in the equity capital of the company.
However, no great changes have been seen in the debt level of the company. It is
recommended to the company to reduce the equity level and improve the debt level of the
company to manage the overall position and level of the company.
The above table defines that various positive changes have occurred into the financial
performance and financial position of the company in last few years. In comparison of
competitor companies, Facebook Inc is performing well in the market.
3.2 Capital structure of Facebook:
On the basis of annual report of the company, net income, operating cash flow,
revenue and capital structure level of Facebook Inc has been studied. The study explains that
various positive changes have taken place into the financial performance and financial
position of the business in last few years. In comparison of competitor companies, Facebook
Inc is performing well in the market.
Figure 4: Capital structure versus net income
(Guru Focus, 2019)
Further, last 5 years debt to equity ratio has been calculated and it has been found that
assets level of the business has been enhanced at better level from the year 2014 to 2018.
Along with that, a great improvement has been seen in the equity capital of the company.
However, no great changes have been seen in the debt level of the company. It is
recommended to the company to reduce the equity level and improve the debt level of the
company to manage the overall position and level of the company.
Financial Decision Making 12
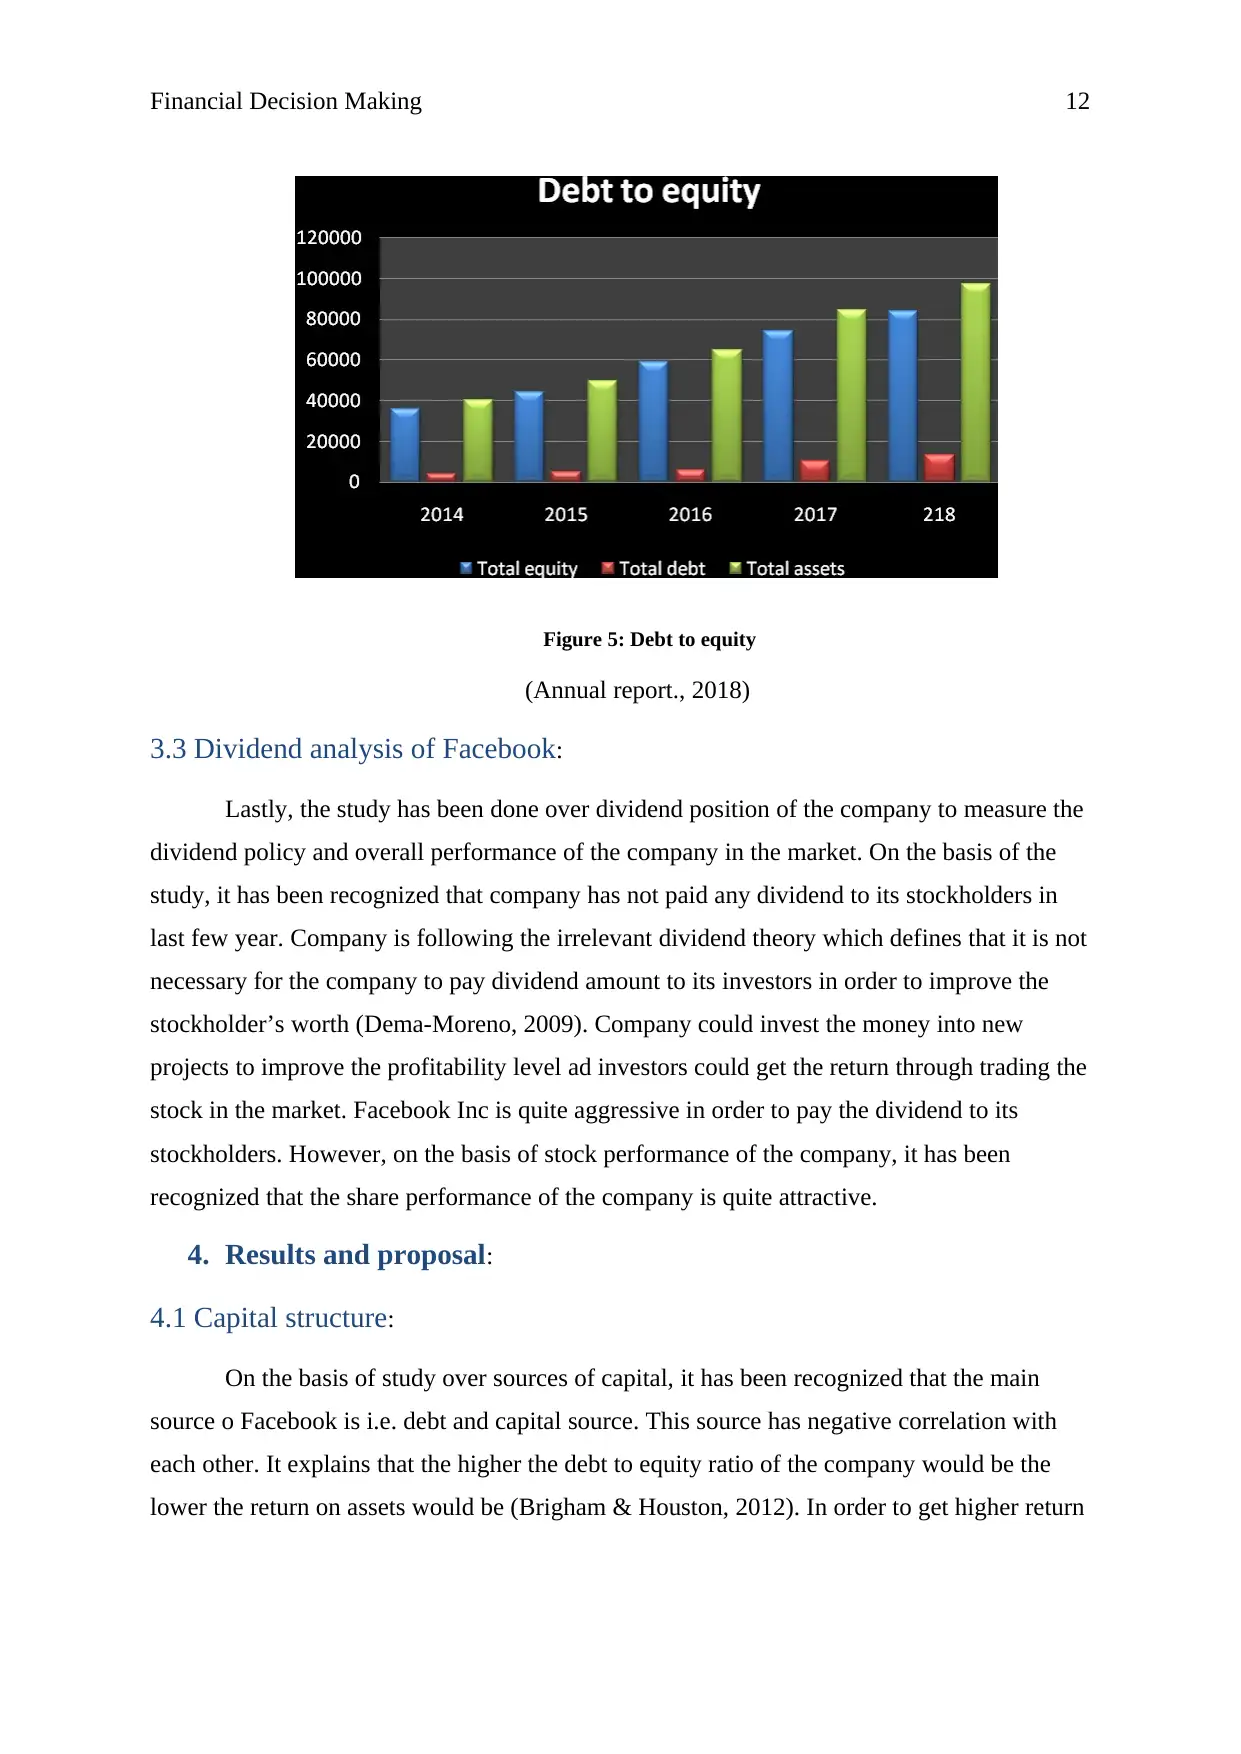
Figure 5: Debt to equity
(Annual report., 2018)
3.3 Dividend analysis of Facebook:
Lastly, the study has been done over dividend position of the company to measure the
dividend policy and overall performance of the company in the market. On the basis of the
study, it has been recognized that company has not paid any dividend to its stockholders in
last few year. Company is following the irrelevant dividend theory which defines that it is not
necessary for the company to pay dividend amount to its investors in order to improve the
stockholder’s worth (Dema-Moreno, 2009). Company could invest the money into new
projects to improve the profitability level ad investors could get the return through trading the
stock in the market. Facebook Inc is quite aggressive in order to pay the dividend to its
stockholders. However, on the basis of stock performance of the company, it has been
recognized that the share performance of the company is quite attractive.
4. Results and proposal:
4.1 Capital structure:
On the basis of study over sources of capital, it has been recognized that the main
source o Facebook is i.e. debt and capital source. This source has negative correlation with
each other. It explains that the higher the debt to equity ratio of the company would be the
lower the return on assets would be (Brigham & Houston, 2012). In order to get higher return
⊘ This is a preview!⊘
Do you want full access?
Subscribe today to unlock all pages.
Trusted by 1+ million students worldwide
1 out of 19
Related Documents


Your All-in-One AI-Powered Toolkit for Academic Success.
+13062052269
info@desklib.com
Available 24*7 on WhatsApp / Email
![[object Object]](/_next/static/media/star-bottom.7253800d.svg)
Unlock your academic potential
Copyright © 2020–2026 A2Z Services. All Rights Reserved. Developed and managed by ZUCOL.