Finance for Managers: Morrison and Sainsbury Performance Analysis
VerifiedAdded on 2020/02/05
|27
|7719
|47
Report
AI Summary
This report provides a comprehensive financial and non-financial performance evaluation of two British retailers, Morrison and Sainsbury. It begins with an introduction to finance and its impact on business success, emphasizing the importance of financial analysis for investors. The report outlines key parameters for financial and non-financial analysis, including strategic financial analysis, profitability ratios, return on capital employed, and non-financial factors like SWOT analysis and CSR initiatives. It then delves into the specific financial performance of Morrison, analyzing turnover, cost of sales, and profitability narratives. A comparative analysis with Sainsbury is implied, although not fully developed in the provided text. The report aims to advise investors by assessing the companies' financial health, business models, and strategic approaches, ultimately offering insights into their investment potential. It incorporates ratio analysis, strategic analysis, CSR initiatives, SWOT analysis, and business models to provide a holistic view.
Finance for managers
1
1
Paraphrase This Document
Need a fresh take? Get an instant paraphrase of this document with our AI Paraphraser
Table of Contents
INTRODUCTION................................................................................................................................3
1. Parameters for the financial as well as non-financial analysis....................................................3
2. Different financial and non-financial areas need to be consider by investor:..............................5
3. Evaluation of financial and non-financial performance of Morrison with its competitor
Sainsbury.........................................................................................................................................6
4. Reflection...................................................................................................................................12
RECOMMENDATION......................................................................................................................12
CONCLUSION..................................................................................................................................12
REFERENCES...................................................................................................................................14
APPENDIX........................................................................................................................................16
2
INTRODUCTION
Finance is the most crucial element which has high level of impact on the growth and
success of the firm. It is mainly because, in order to carry out regular business operations and
functions, companies are require to gather appropriate amount of fund for meeting out its daily
expenditures and CAPEX such as investment in plant and property, meet out debt obligations,
administration and selling payments and so on. Looking at the present corporate world, companies
gather large amount of money from the investors either domestic or international. Before making
investment in any firm, investors ones assess their risk and return relationship associated with their
potential investment and invest money in that organization where risk is minimum and possibility of
return is maximum. In order to make such analysis, investors need to evaluate business operational
outcome and financial strength by calculating number of ratios like profitability, long-term solvency
and liquidity and so on. This assignment lay emphasizes on financial as well as non-financial
performance evaluation of two British retailers, Morrison and its competitor Sainsbury. It will be
done by ratio analysis strategic analysis, CSR initiatives, SWOT analysis, business model and
others so as to advice investors to make solid decisions.
Brief overview of business
UK retail sector shows a rapid growth as numbers of retailers are delivering excellent
services to the customers. WM Morrison Supermarket is a public limited company listed on LSE,
founded in 1899 and operates in retail sector. It provides retailing services to the people through via
both the established retail stores and online medium. The main aim of the company is to deliver top-
quality food and grocery products to the customers so as to gain competitive advantage.
Another retail organization that has been chosen for comparative analysis is Sainsbury
founded in the year 1869, listed on LSE. It delivers retailing services to the people through its
convenience stores, forecourt stores, hypermarket, supermarkets and superstores. Company also
deliver services to the target audiences using online channel i.e. website development and web
marketing etc.
1. Parameters for the financial as well as non-financial analysis
In the current era of tough competition, all the commercial establishments require to
examine and interpret their actual performance including both financial as well as non-financial
results. There are many parameters available to business analysts to compare and evaluate their
actual outcome either quantitative or qualitative for a given duration. The most often use parameters
for monetary as well as non-monetary analyses are enumerated hereunder:
Strategic Financial Analysis: SFA regarded as the process of examining and evaluating
3
⊘ This is a preview!⊘
Do you want full access?
Subscribe today to unlock all pages.
Trusted by 1+ million students worldwide
financial performance of an organization so as to diagnose business problems, operational
difficulties and reason for poor performance. There are various techniques available to the Morrison
for performance analysis such as common-size/vertical analysis, trend analysis and ratio analysis
(Shiller, 2013). Out of these, ratio analysis is considered as the best methodology that assesses
relationship between each and every variable of the reported annual accounts.
Profitability analysis: WM Morisson’s profitability can be examined by utilizing ratios like
gross profit and net profit (Brealey & et.al., 2012). In this, gross profits indicate the percentage that
company earned through adding a mark-up on their total turnover. However, net margin helps to
identify surplus percentage that company earned by generating excess revenue over total business
expenses.
Return on capital employed: This parameter can be used to determine percentage that firm
earned on their total capital invested. In other words, it measure that how efficiently Morrison is
generating yield on their total capital employed (total assets-current liabilities) in the business.
Earning per share: Companies like Morrison and others generate huge proportion of long-
term fund by shareholders. They invest money in the business so as to get optimum and maximum
return to meet their yield expectations (Masubuchi, 2013). EPS is an effective and often used
parameter to assess investment performance to interpret that in what extent, organization is able to
deliver favourable financial reward to their investors in return for undertaken risk.
Current ratio: This ratio helps to measure the proportion between current assets and
liabilities typically used to evaluate business ability to repay suppliers on right time. It is essential
for the managers to examine their liquidity position or creditworthiness to meet their short-term
obligations within extended credit period (Uechi & et.al., 2015).
Dividend payout ratio: In the real market, retailers kept some amount of their net earnings in
the business for the future growth, success and financial risk management (Wilson, 2016). DPS is
often used by the analysts to determine the proportion of net income that is distributed among
stockholders as dividend.
Gearing ratio: Investors often use this ratio as a parameter to determine the proportion or
mix of debt and equity fund so as to examine potential risk associated with their investment (Shiller,
2013).
Non-financial analysis/quantifiable performance
SWOT: It is a model used for identifying internal business strength and weaknesses as well
as market opportunity and threats due to volatile external market forces.
Strategic planning: Business strategies and planning can also be evaluate to measure that
how efficiently executives and managers plans proves successful for the corporate growth and
4
Paraphrase This Document
Need a fresh take? Get an instant paraphrase of this document with our AI Paraphraser
success (Uechi & et.al., 2015).
Brand reputation: Market reputation and position also works as an indicator of business
strength. Customer loyalty, use of upgraded and advanced technology, globalized operations, strong
brand portfolio, expansion and growth projects helps to build a strong brand reputation.
CSR activities: In the present times, establishments like Morrison and other retailers have to
take several initiatives so as to meet their responsibilities towards all their stakeholders like
consumer, society, suppliers, employees and so on (Masubuchi, 2013).
2. Different financial and non-financial areas need to be consider by investor:
Every potential investor who is planning to invest fund in an organization desires to get
maximum return. Therefore, they require examining both the quantitative as well as qualitative
aspects so as to make solid investment decisions. According to Uechi and et.al., (2015), presented
ratio analysis as the best methodology for conducting quantitative and financial analysis. With the
help of this, investor can examine and evaluate business performance by computing variety of ratios
like profitability, solvency, liquidity and managerial efficiency. Gross margin, net margin, return on
shareholders fund, ROCE, debt to equity ratio, leverage and current ratio can be used for examining
the outcome of regular functions and financial health as well. Likewise, Shiller (2013), presented
that investors put their money in an organization to get maximum reward henceforth, they need to
examine current investors return. It can be done by computing investment ratios like earnings per
share and dividend payout ratio. EPS indicates return on each holding whereas dividend payout
ratio indicates that what proportion of net corporate yield is distributed among stockholders as
dividend.
However, it has been criticised by Wilson (2016), as the study outlined that ratio analysis
method has number of shortcomings. One of the most important limitations is that it gives
information about quantitative values and figures of historical years, however, investors are highly
motivated by the future performance. Moreover, the success of the decision based upon strategic
financial analysis of company’s annual accounts is highly dependent upon reliability, truthfulness
and validity of the information reported in financial statements. Incorrect and misleading
information can lead to take wrong decisions. Further, although comparative analysis is consider
useful for better decisions, but still, in the real corporate sector, companies use distinguish
accounting policies and rules which differentiate financial reporting structure and can lead to take
harmful decisions. In addition to this, changes in business performance may be the result of volatile
market conditions that are not considered by financial statement. Therefore, investors have to use a
combination of both the quantitative as well as qualitative methods for more accurate analysis.
5
According to Chia-Hsing, Padmanabhan and Zhang (2013), initially, investor has to evaluate
several company/firm-specific factors, more importantly, business model. Before investigating
annual accounts, investors have to look at company’s business model at its website or financial
reports. It delivers information to the investors that how company work out its operations and
regular business activities. On the other hand, Masubuchi (2013), commented that it seems to be
difficult for the enterprises to understand business model clearly and precisely, therefore,
competitive advantage is considered as more essential element that an investor need to consider
before putting their money. It is an indicator of long-term business success, growth and
sustainability. In such respects, investor has to evaluate unique business preposition, strategic
planning and activities, technologies, operational effectiveness, strategic capabilities, market
presence and so on.
Despite this, in the study of Gelman, Carlin & Rubin (2014), it has been observed that
managers play a crucial role in the enterprise success, as they make policies, decisions and prepare
plans for the smooth functioning. Therefore, managerial efficiency is a key or vital element that an
investor needs to evaluate so as to invest money in that organization which managers are highly
skilled, talented and experienced and capable to reach business towards greatest heights.
However, on the critical note, Berk and et. al., (2013), said that every organization is a part
of society and have some responsibility towards all the stakeholders. Establishing excellent
managerial structure to meet interest and expectations of all the stakeholders is a sign of good
corporate governance. In other words, it refers to a set of transparent rules, policies, activities and
operational system which is developed to maintain reliability, integrity and meet out obligations
towards all the stakeholders. In contrast to this, Brealey & et.al. (2012), argued that
SWOT/PESTEL models can be used to conduct both the internal as well as external analysis. This
method gives assistance to the investor to examine the effectiveness of internal operations and the
impact of external market forces on regular business activities and functions. It enables investors to
make better and stronger decisions so as to make sure sufficient financial return for the money
invested.
3. Evaluation of financial and non-financial performance of Morrison with its competitor Sainsbury
Financial performance analysis of Morrison
Profitability narratives:
Gross margin: Morrison’s GM got declined from 6.89% to 3.83% in the year 2016 indicates
that company is generating less return on their total turnover due to following reasons:
Year Turnover % change
6
⊘ This is a preview!⊘
Do you want full access?
Subscribe today to unlock all pages.
Trusted by 1+ million students worldwide
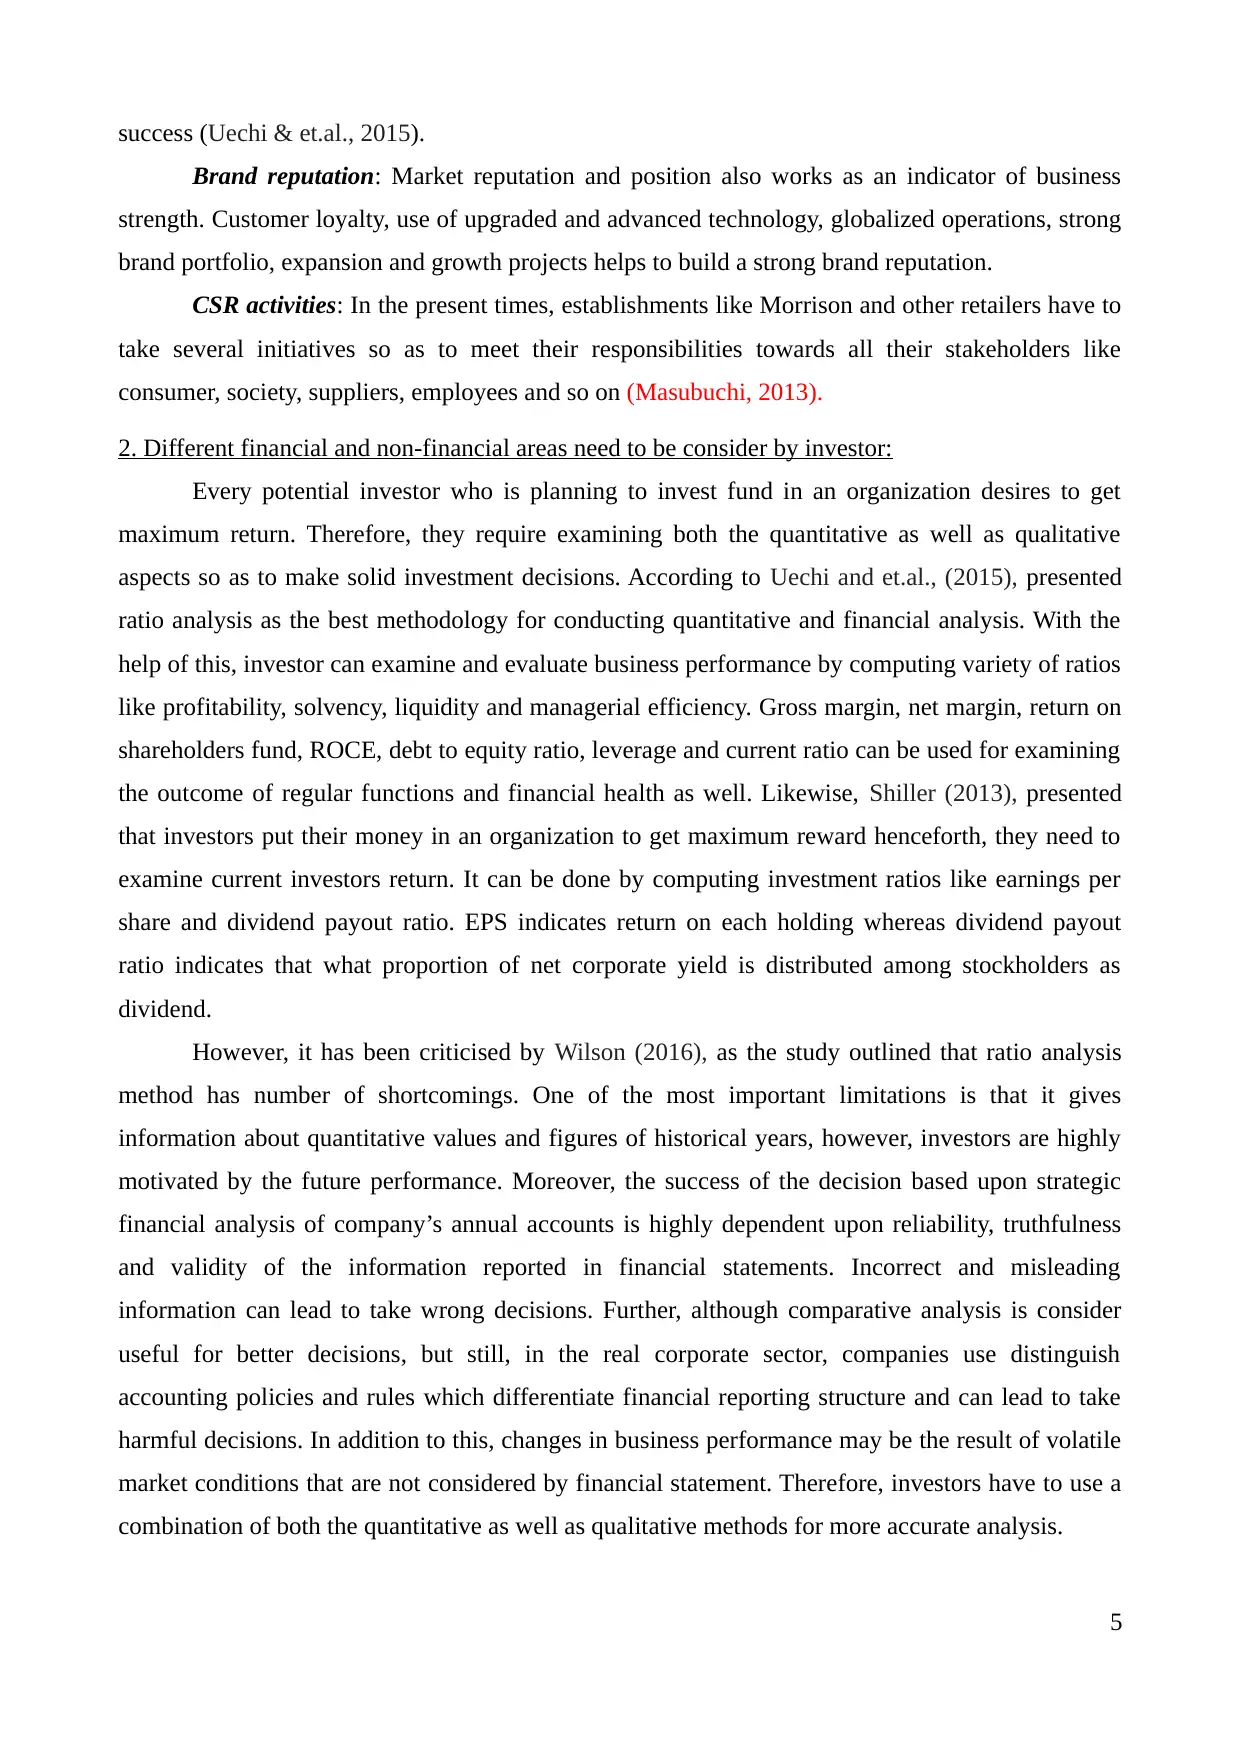
2012 17663
2013 18116 2.56%
2014 17680 -2.41%
2015 16816 -4.89%
2016 16122 -4.13%
1.J Sainsbury PLC 2.WM Morrison Supermarkets P L C
0
5,000,000
10,000,000
15,000,000
20,000,000
25,000,000
th GBP
Std dev. Av. 1 2
11 12 13
11 12 13
11
12 13
11 12 13
Turnover: In 2013, firm’s turnover got improved from £17,663m to £18,116m by 2.56% due
to increased demand. However, thereafter sales shows a continuous decrease by 2.41% and 4.89%
and 4.13% respectively may be due to decrease in consumer demand, worst quality products and
availability of substitute products at cheaper prices. Cutting product prices, improvement in quality
of service, online operations and rapid growth in offered discounts were the main reasons for the
grown turnover. Growing brand portfolio, premium quality service, price cut strategies proven as a
key pillars for high like for like sales and other revenues. In this year, company cut down its prices
on around 100 products, more importantly, fresh fruit and vegetables bring significant growth in
sales revenues (Morrison’s returns to profit as sales rise, 2016). In addition to this, opening new
convenience stores and grocery shops at different locations also assist entrepreneur to maximize
their total turnover and reach success. Besides this, increase in real wages increased availability of
disposable income, which in turn, rose customer demand and results in increased turnover.
Expansion of services at stores has explored total revenue of the firm.
7
Paraphrase This Document
Need a fresh take? Get an instant paraphrase of this document with our AI Paraphraser
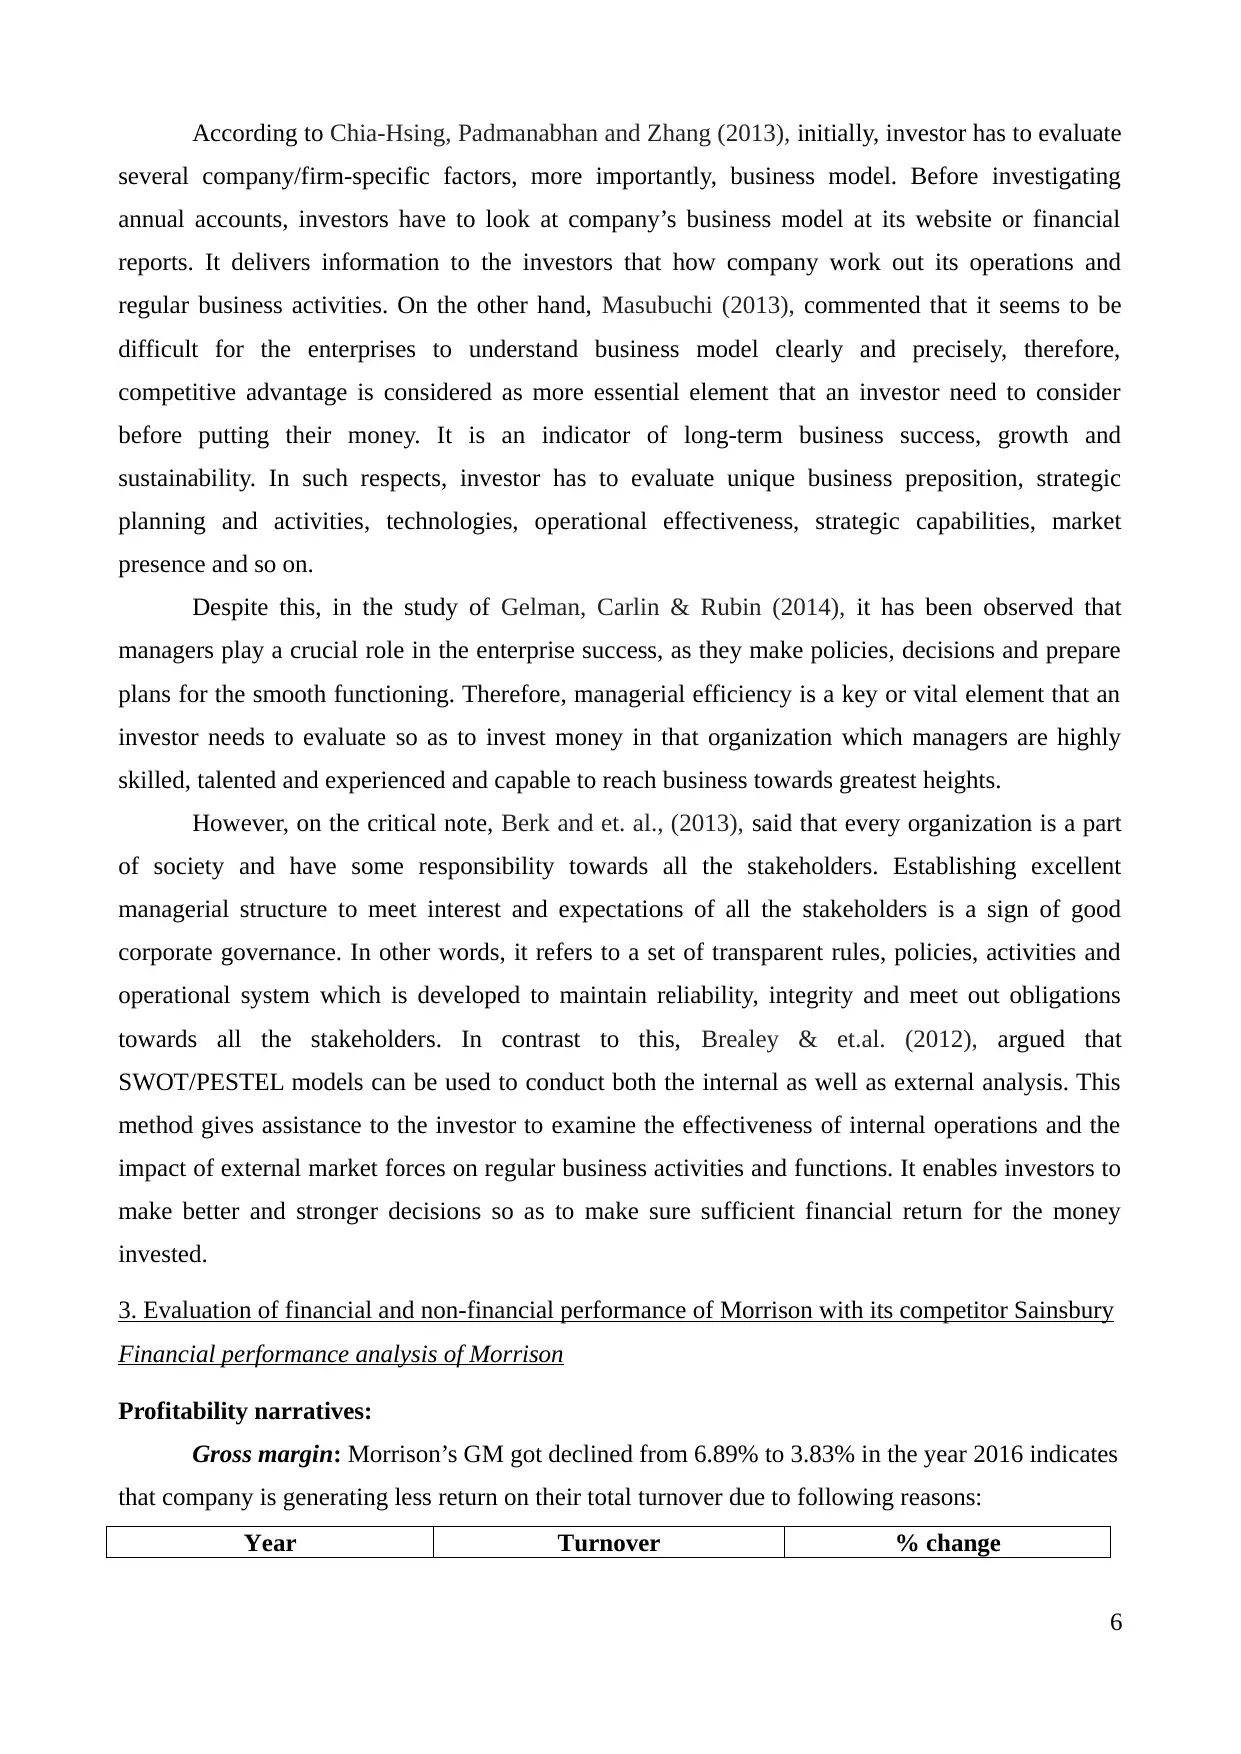
Year Cost of sale % change
2012 16446
2013 16910 2.82%
2014 16606 -1.80%
2015 16055 -3.32%
2016 15505 -3.43%
Cost of sales: Another reason for decrease in profitability is ineffective control over cost of
sale. The table reflects that in 2013, cost got improved by 2.82%, however, thereafter; it dropped
down by 1.80%, 3.32% and 3.43%. Although % decrease in cost is rising but still it is
comparatively less than % change in sales resulted in decreased gross margin (WM Morrison
Supermarket Plc, 2016).
J Sainsbury PLC
(62.77%)
WM Morrison Supermarkets P L
C
(37.23%)
Net margin: Till 2015, NM got declined from 5.36% to -4.71%, but in 2016, it got increased
to 1.35% which indicates that this year, Morrison generated favourable return on their total
revenues. Following are the reasons for volatility in net profit, enumerated underneath:
Sales, general and administration expense: In 2016, SG&A shows a sudden decline from
£1,670m to £472m by 71.74%, which in turn, resulted in high net margin. However, in this year,
company recruited 5000 new employees to serve their customers in the best manner during heavy
workload and busiest time.
Interest expense: Continuous increasing in interest expenses from £39m to £65m, £81m,
£95m and 98m increased total spending and declined net return (Marciukaityte & Szewczyk,
2011).
Other operational expense/income: In 2012, Morrison incurred expenses worth £340m
8
however, which was wholly removed in 2014 and 2015. While, in 2016, firm generated revenue
worth £97m from their regular course of activities and functions helps to maximize their net
earnings.
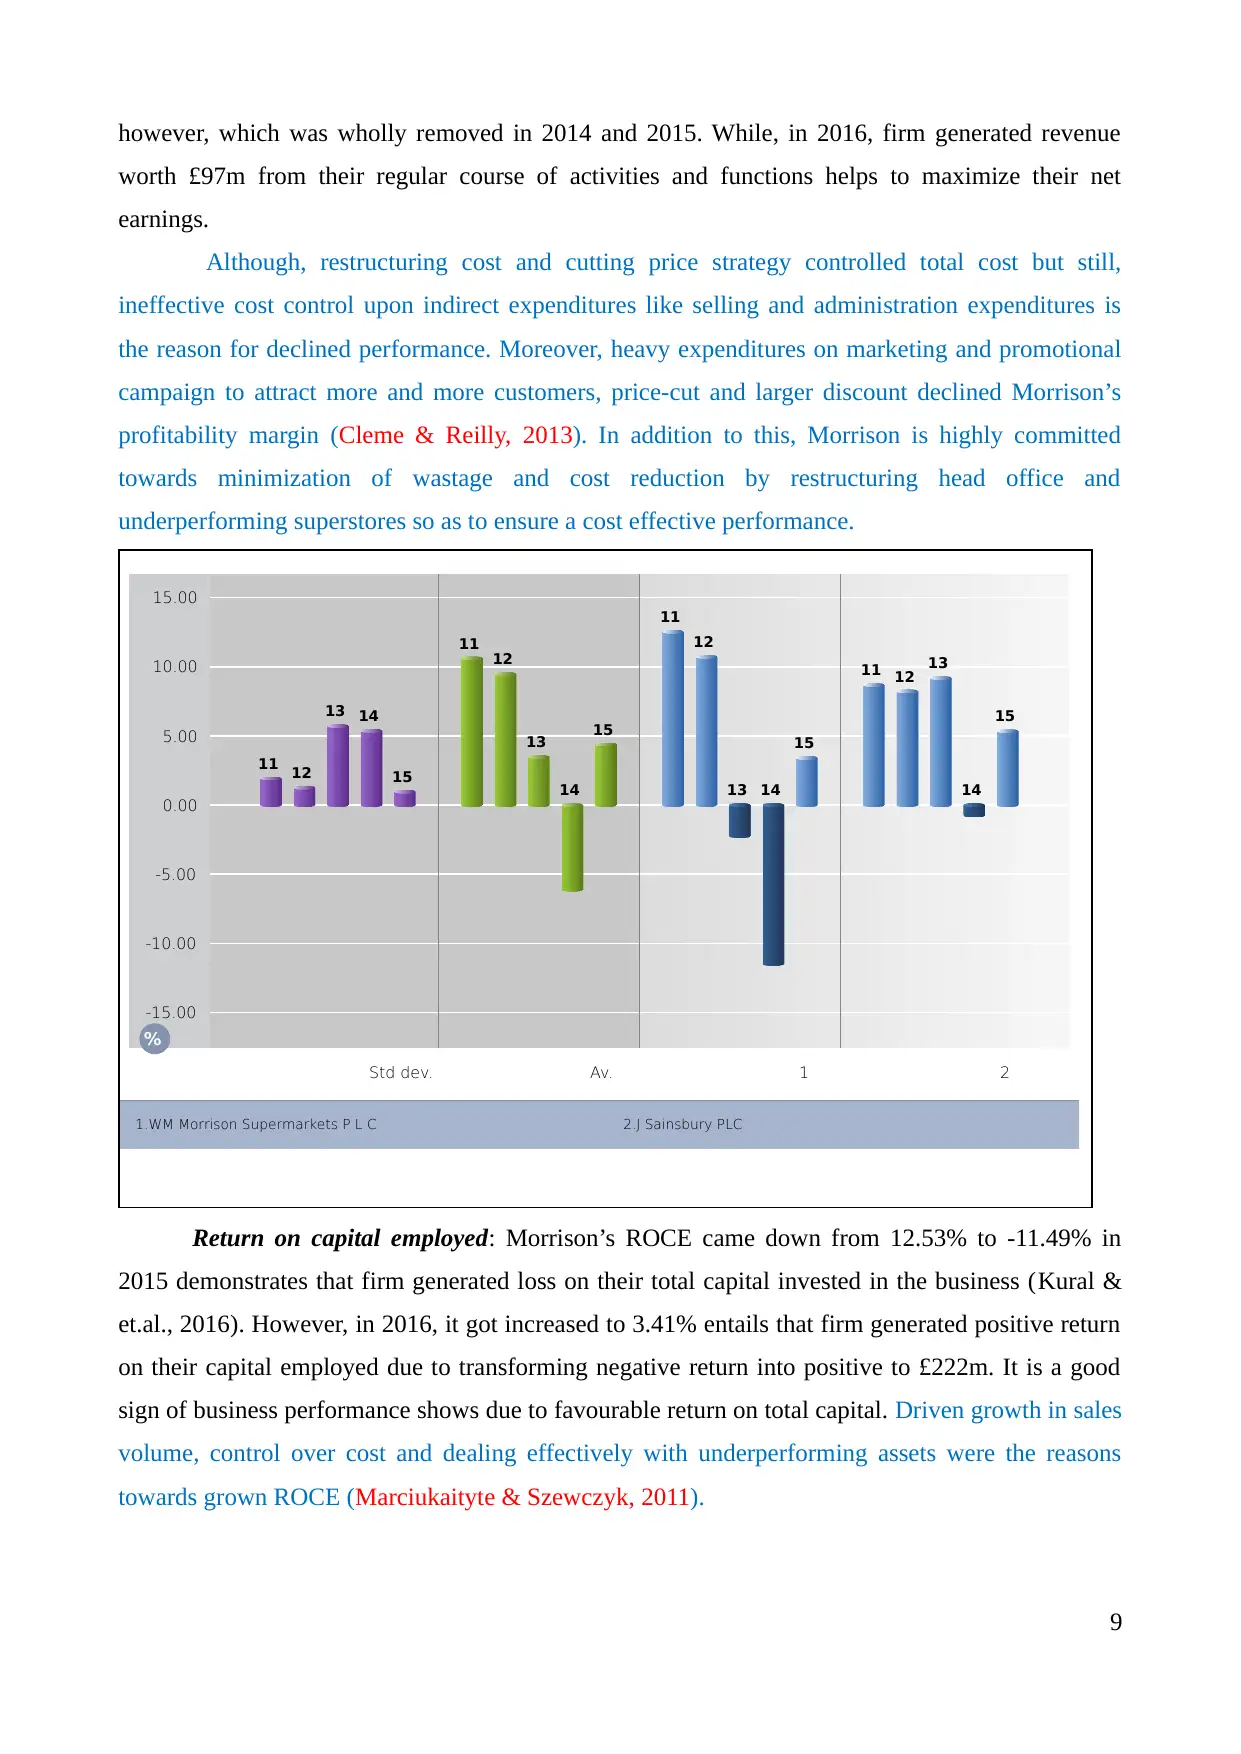
Although, restructuring cost and cutting price strategy controlled total cost but still,
ineffective cost control upon indirect expenditures like selling and administration expenditures is
the reason for declined performance. Moreover, heavy expenditures on marketing and promotional
campaign to attract more and more customers, price-cut and larger discount declined Morrison’s
profitability margin (Cleme & Reilly, 2013). In addition to this, Morrison is highly committed
towards minimization of wastage and cost reduction by restructuring head office and
underperforming superstores so as to ensure a cost effective performance.
1.WM Morrison Supermarkets P L C 2.J Sainsbury PLC
-15.00
-10.00
-5.00
0.00
5.00
10.00
15.00
%
Std dev. Av. 1 2
11 12
13 14
15
11
12
13
14
15
11
12
13 14
15
11 12 13
14
15
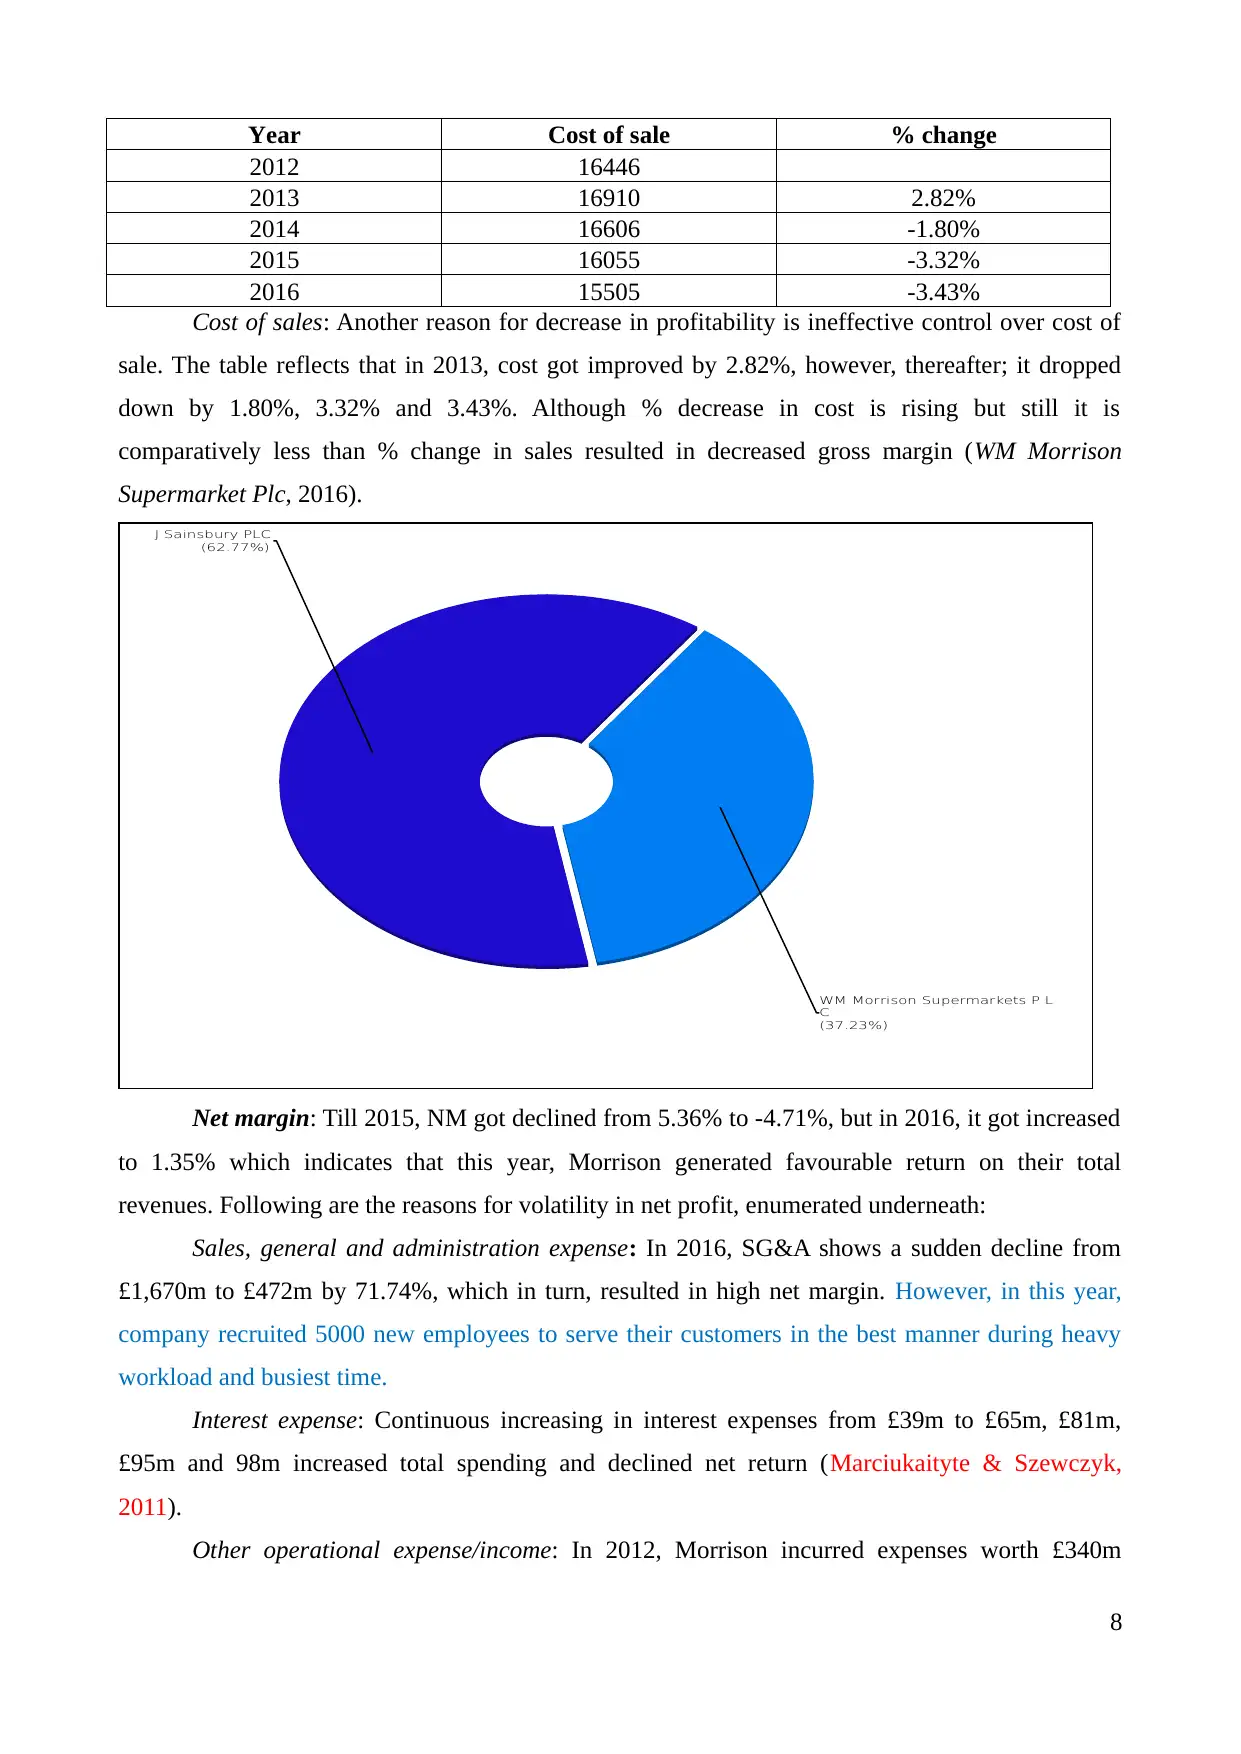
Return on capital employed: Morrison’s ROCE came down from 12.53% to -11.49% in
2015 demonstrates that firm generated loss on their total capital invested in the business (Kural &
et.al., 2016). However, in 2016, it got increased to 3.41% entails that firm generated positive return
on their capital employed due to transforming negative return into positive to £222m. It is a good
sign of business performance shows due to favourable return on total capital. Driven growth in sales
volume, control over cost and dealing effectively with underperforming assets were the reasons
towards grown ROCE (Marciukaityte & Szewczyk, 2011).
9
worth £97m from their regular course of activities and functions helps to maximize their net
earnings.
Although, restructuring cost and cutting price strategy controlled total cost but still,
ineffective cost control upon indirect expenditures like selling and administration expenditures is
the reason for declined performance. Moreover, heavy expenditures on marketing and promotional
campaign to attract more and more customers, price-cut and larger discount declined Morrison’s
profitability margin (Cleme & Reilly, 2013). In addition to this, Morrison is highly committed
towards minimization of wastage and cost reduction by restructuring head office and
underperforming superstores so as to ensure a cost effective performance.
1.WM Morrison Supermarkets P L C 2.J Sainsbury PLC
-15.00
-10.00
-5.00
0.00
5.00
10.00
15.00
%
Std dev. Av. 1 2
11 12
13 14
15
11
12
13
14
15
11
12
13 14
15
11 12 13
14
15
Return on capital employed: Morrison’s ROCE came down from 12.53% to -11.49% in
2015 demonstrates that firm generated loss on their total capital invested in the business (Kural &
et.al., 2016). However, in 2016, it got increased to 3.41% entails that firm generated positive return
on their capital employed due to transforming negative return into positive to £222m. It is a good
sign of business performance shows due to favourable return on total capital. Driven growth in sales
volume, control over cost and dealing effectively with underperforming assets were the reasons
towards grown ROCE (Marciukaityte & Szewczyk, 2011).
9
⊘ This is a preview!⊘
Do you want full access?
Subscribe today to unlock all pages.
Trusted by 1+ million students worldwide
EPS (earning per share): In 2012, EPS was 26.68p got improved to 27.26p in 2013,
Thereafter, it shows a continuous decrease to 23.08p, 10.93p and 7.77p. Changes in net earnings
available for the ordinary shareholders and stockholder’s equity are the reasons for volatility in
return on each holding. Regular decrease in EPS is a poor sign of business performance as investors
are getting less return on their equity capital and may give rise to dissatisfaction.
Price-earning ratio: In 2012, Morrison’s PE ratio was 10.23 shows an extreme level of
improvement in the year 2015 to 16.46. Increase in EPS is the main reasons for rising PE ratio
which is a good sign of business performance (Bull, 2007). Growth in PE ratio indicates that
investors are expecting more return from the company in return for the risk taken by putting their
own money.
Current ratio: In 2015, it remained constant to 0.57:1, while, after this, it shows a constant
decline to 0.57:1, 0.54:1 and 0.48:1. From the financial statement, it can be seen that till 2014, its
CA got improved to £1342m and £1430m but in 2014, it came down to £1228m. However, in 2016,
it rose to £1308m due to increased bank deposits from £241m to £488m. Contrary to this, from
2012 to 2016, Morrison’s current liabilities enhanced from £2303m to £2747m because of rise in
creditors, short-term loans and other nearby obligation (Rakićević & et.al., 2016). The ratio is also
far away from the idle ratio of 2:1 reflects that Morrison is unable to make their deferral payments
(short-term obligations) on right time because of having inadequate resources.
Dividend payout ratio: Morrison’s ratio rose up to 52.61% indicates that company delivered
more dividends to the investors out of profit generated to carry out regular business operations (WM
Morrison Supermarket Plc, 2016).
Gearing ratio: Till the end of 2015, Morrison’s gearing ratio got increased from 42.02 to
57.65, 79.22 and 92.13 indicates excessive risk because of rising mix of debt resources and
repayment of share capital to the investors. High ratio is a sign of improved risk because Morrison’s
debt obligation in relation to interest payment has been increased (Sharma & Mehra, 2016). But in
2016, it dropped down to 74.84 due to repayment of long-term debt worth £500m and more use of
shareholders equity as it got increased from £3594m to £3756m. It shows that management take
action to minimize financial risk and improve solvency position so as to meet long-term obligations
on right time as per repayment schedule (Weaver & Weston, 2007).
Financial performance analysis of Sainsbury
Gross margin: Sainsbury’s GM got enhanced from 5.43% to 6.19% which exhibits that
company generated greater return on their total sales due to following reasons:
Year Turnover % change Cost of sale % change
2012 22294 - 21091 -
10
Paraphrase This Document
Need a fresh take? Get an instant paraphrase of this document with our AI Paraphraser
2013 23303 4.53% 22026 4.43%
2014 23949 2.77% 22562 2.43%
2015 23775 -0.73% 22567 0.02%
2016 23506 -1.13% 22050 -2.29%
Rise in turnover is the reasons for high gross margin till 2014, however, thereafter, although
sales moved downward, but still, effective cost control mechanism to curtail direct expenditures
helps to maximize gross margin and improved its performance.
Net margin: From 2012 to 2015, net margin dropped down from 3.58% to 0.30%, thereafter,
got increased to 2.33% more than Morrison’s NM demonstrates that Sainsbury is performing well.
Control over SG&A expenses by 24.91%, reduction in interest expense by 2.44% and high
operational income are the reason for better return in 2016. It shows that Sainsbury’s performance
has been improved as its net earnings have been converted from negative £166m to £471m
(Saisnbury’s annual report, 2016).
ROCE: In 2015, Sainsbury borne loss on their total capital as its ROCE is -1.30% whereas
in 2016, it shows a sudden increase to 8.61%. Positive return worth £471m is the reason behind
improved ROCE is a sign of greater performance on total capital invested in the firm to carry out
regular business activities and operations (Marciukaityte & Szewczyk, 2011). .
Earning per share: Sainsbury’s EPS came down from 0.32 to -0.08 in 2015, whereas, in
next year, it got increased to 0.23 depicts that company delivered more return to their investors by
generating more yield on their total revenues (Agarwal & et.al., 2015).
Dividend payout ratio: In 2016, Sainsbury’s dividend payout ratio rose to 60.3%
comparatively higher than Morrison’s ratio indicates that it is distributing more dividends to the
shareholders out of total generated net earnings (Sainsbury, 2016).
Current ratio: In 2013, it came down from 0.65:1 to 0.61:1 is a sign of poor liquidity
position. While, thereafter, it shows a constant increase as in 2016, it got inclined to 0.66:1 and also
higher than Morrison’s CR. Increase in short-term investment by 43.48%, prepaid expenses by
8.08% and other CA by 7.91% is the reason behind high availability of nearby resources (Cleme &
Reilly, 2013). However, CL came down by 2.87% due to repayment of some short-term debt,
decreased trade payables and other short-term liabilities. It indicates that liquidity position of the
Sainsbury is comparatively strong than that of Morrison (Patel, 2016).
Price earning ratio: Sainsbury’s PE ratio got decreased from 1.78 to 1.47 in 2014 while in
2015, it got improved to -0.50 which is not a good sign. Negative change in EPS by 19.51% in 2014
is the responsible reason behind declined PE ratio (Weaver & Weston, 2007).
. Decline in ratio may be due to exceptionally well performance as compare to the historical period
11
or firm also may be undervalued.
Gearing ratio: Till 2015, it shows a regular increase from 66.18% to 78.26%, whereas, in
2016, it dropped down to 64.52% and also less than Morrison’s GR of 74.84%. Excessive collection
of equity capital by 14.91% increase and repayment of debt worth 12.15% are the two responsible
reasons for declined gearing ratio. It indicates that managers are trying to minimize their investment
risk to strengthen their solvency position and repay long-term creditors like debt-holders on time
(Daka & Basu, 2016).
Non-financial analysis
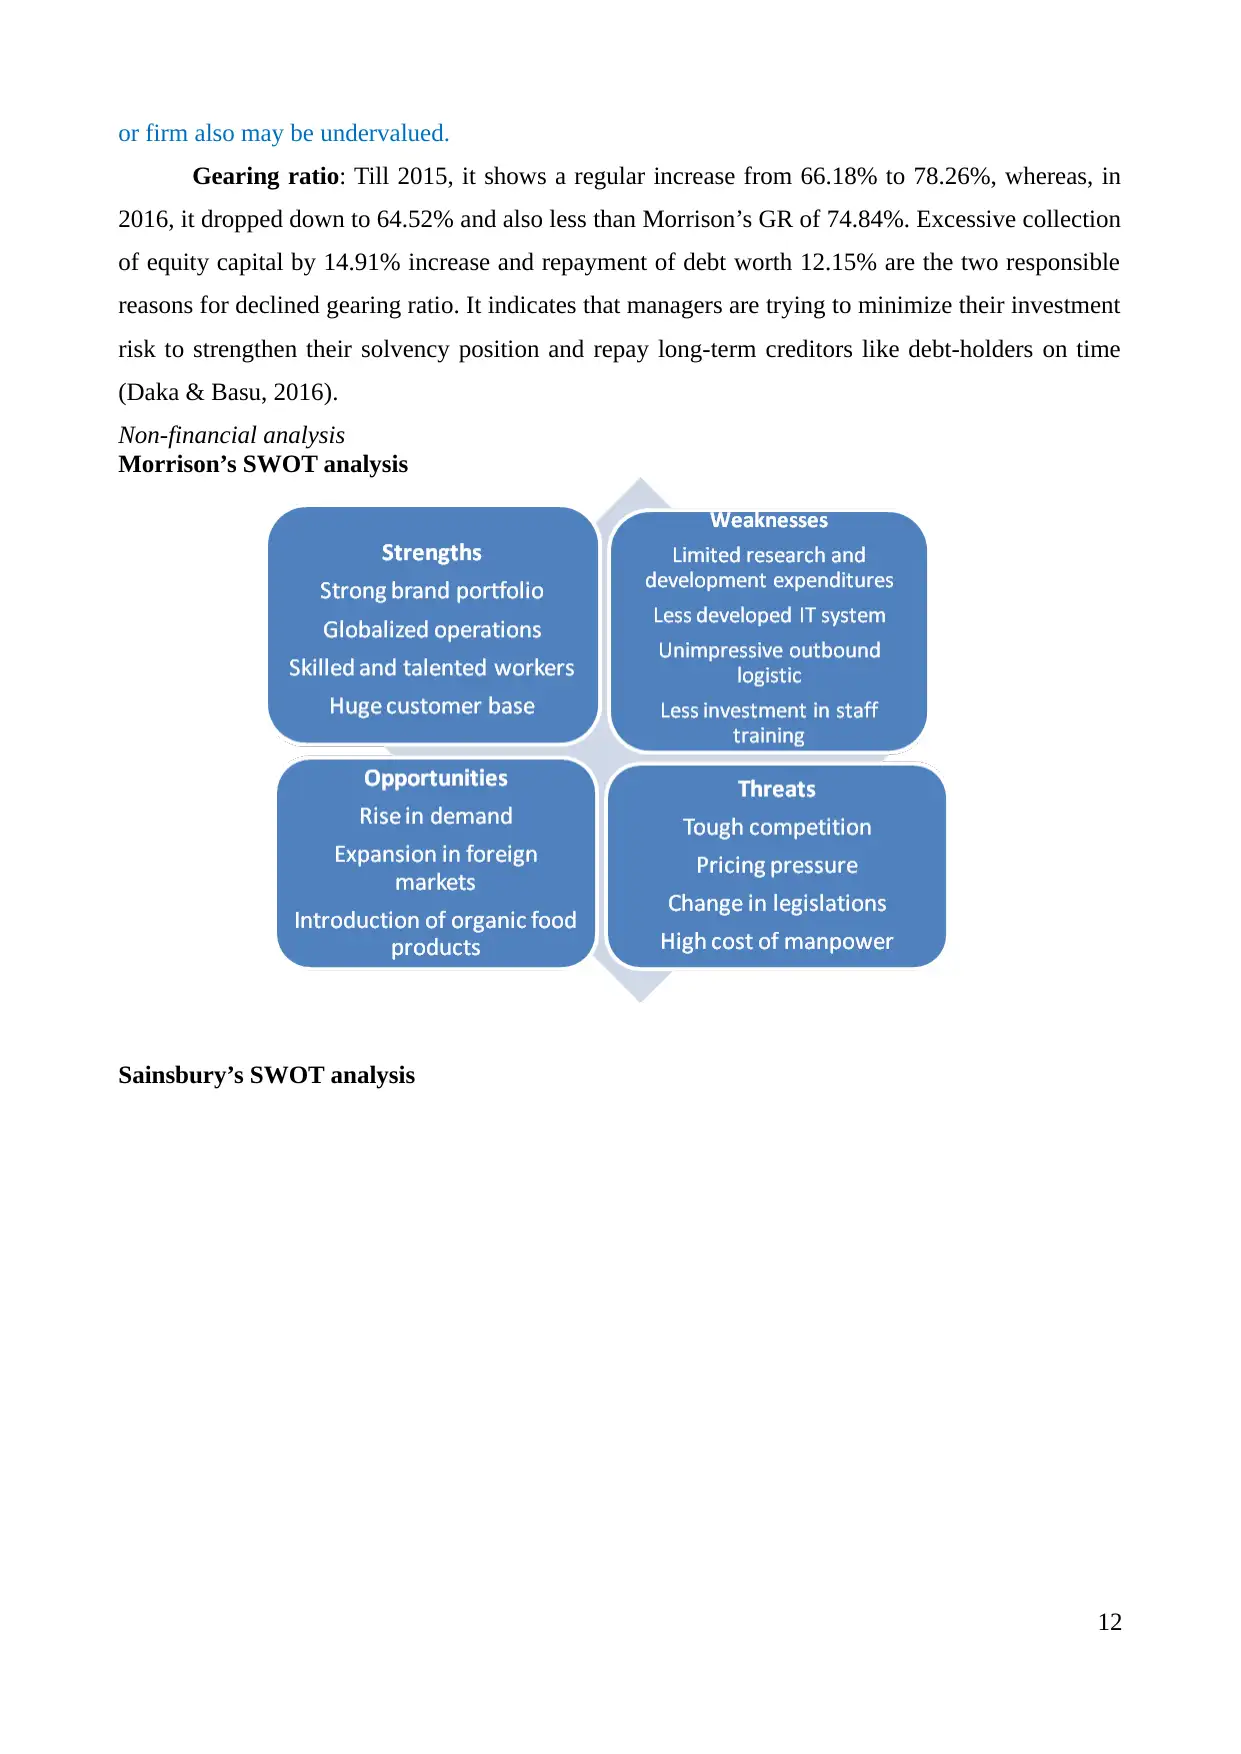
Morrison’s SWOT analysis
Sainsbury’s SWOT analysis
12
Gearing ratio: Till 2015, it shows a regular increase from 66.18% to 78.26%, whereas, in
2016, it dropped down to 64.52% and also less than Morrison’s GR of 74.84%. Excessive collection
of equity capital by 14.91% increase and repayment of debt worth 12.15% are the two responsible
reasons for declined gearing ratio. It indicates that managers are trying to minimize their investment
risk to strengthen their solvency position and repay long-term creditors like debt-holders on time
(Daka & Basu, 2016).
Non-financial analysis
Morrison’s SWOT analysis
Sainsbury’s SWOT analysis
12
⊘ This is a preview!⊘
Do you want full access?
Subscribe today to unlock all pages.
Trusted by 1+ million students worldwide
1 out of 27
Related Documents


Your All-in-One AI-Powered Toolkit for Academic Success.
+13062052269
info@desklib.com
Available 24*7 on WhatsApp / Email
![[object Object]](/_next/static/media/star-bottom.7253800d.svg)
Unlock your academic potential
Copyright © 2020–2026 A2Z Services. All Rights Reserved. Developed and managed by ZUCOL.