AC4410 Accounting & Finance: Financial Analysis Report on Shire Plc

Verified

Added on  2023/06/14

|11
|1953
|419
Report
AI Summary
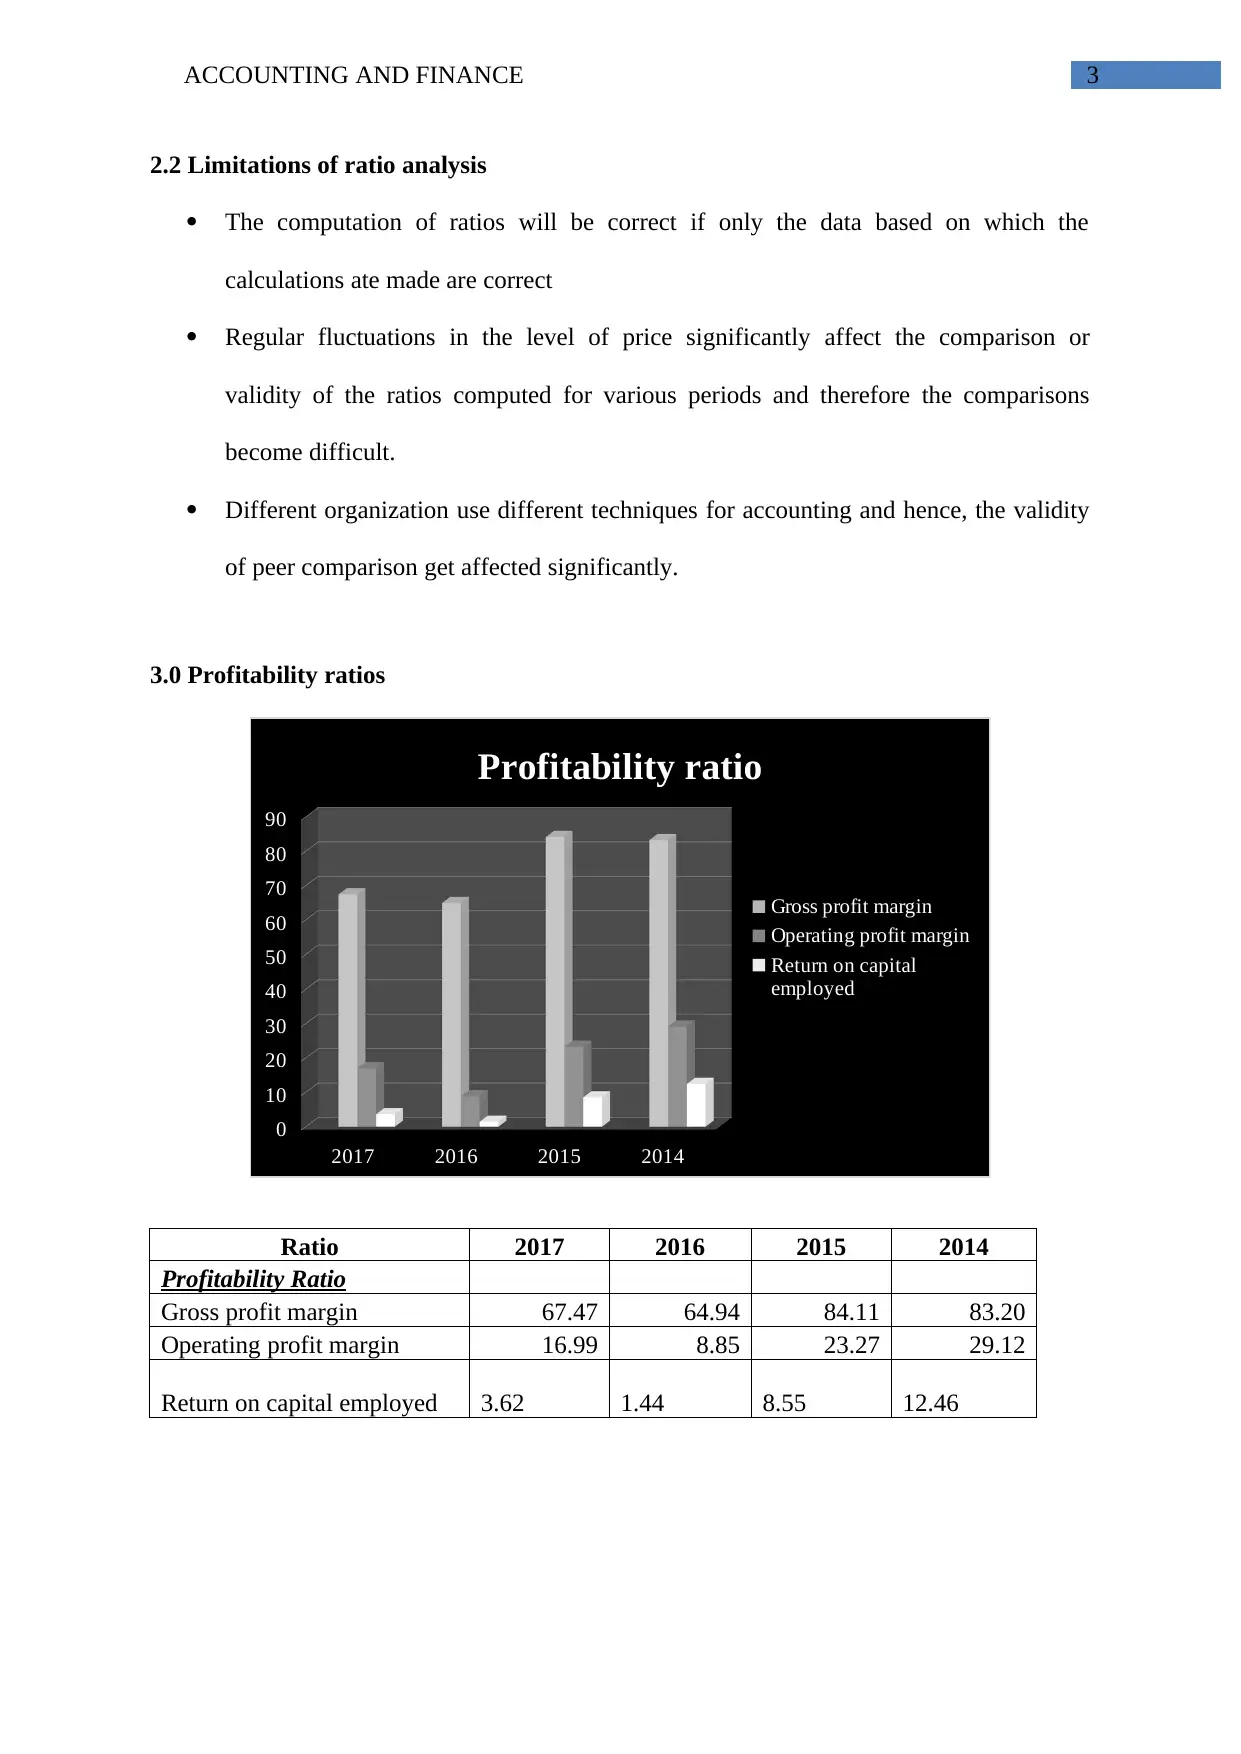
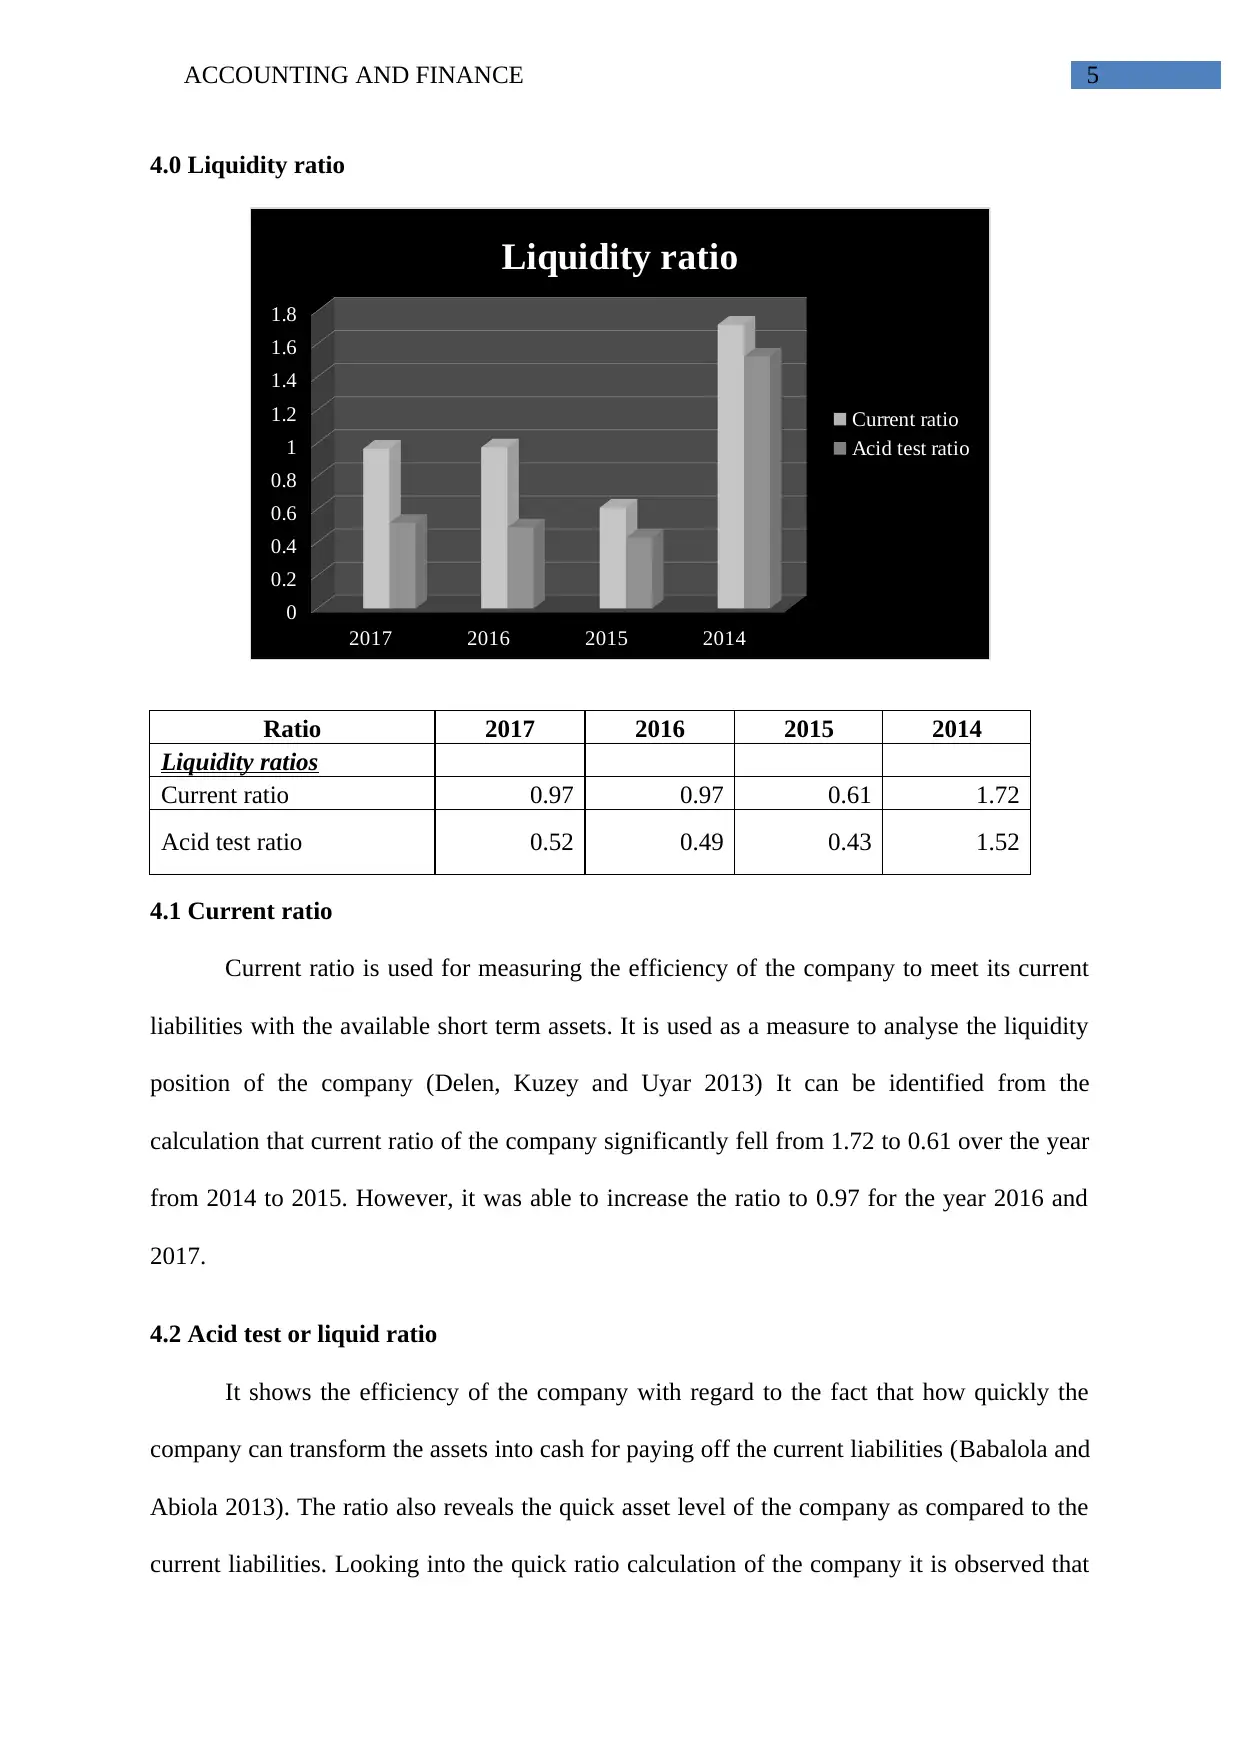
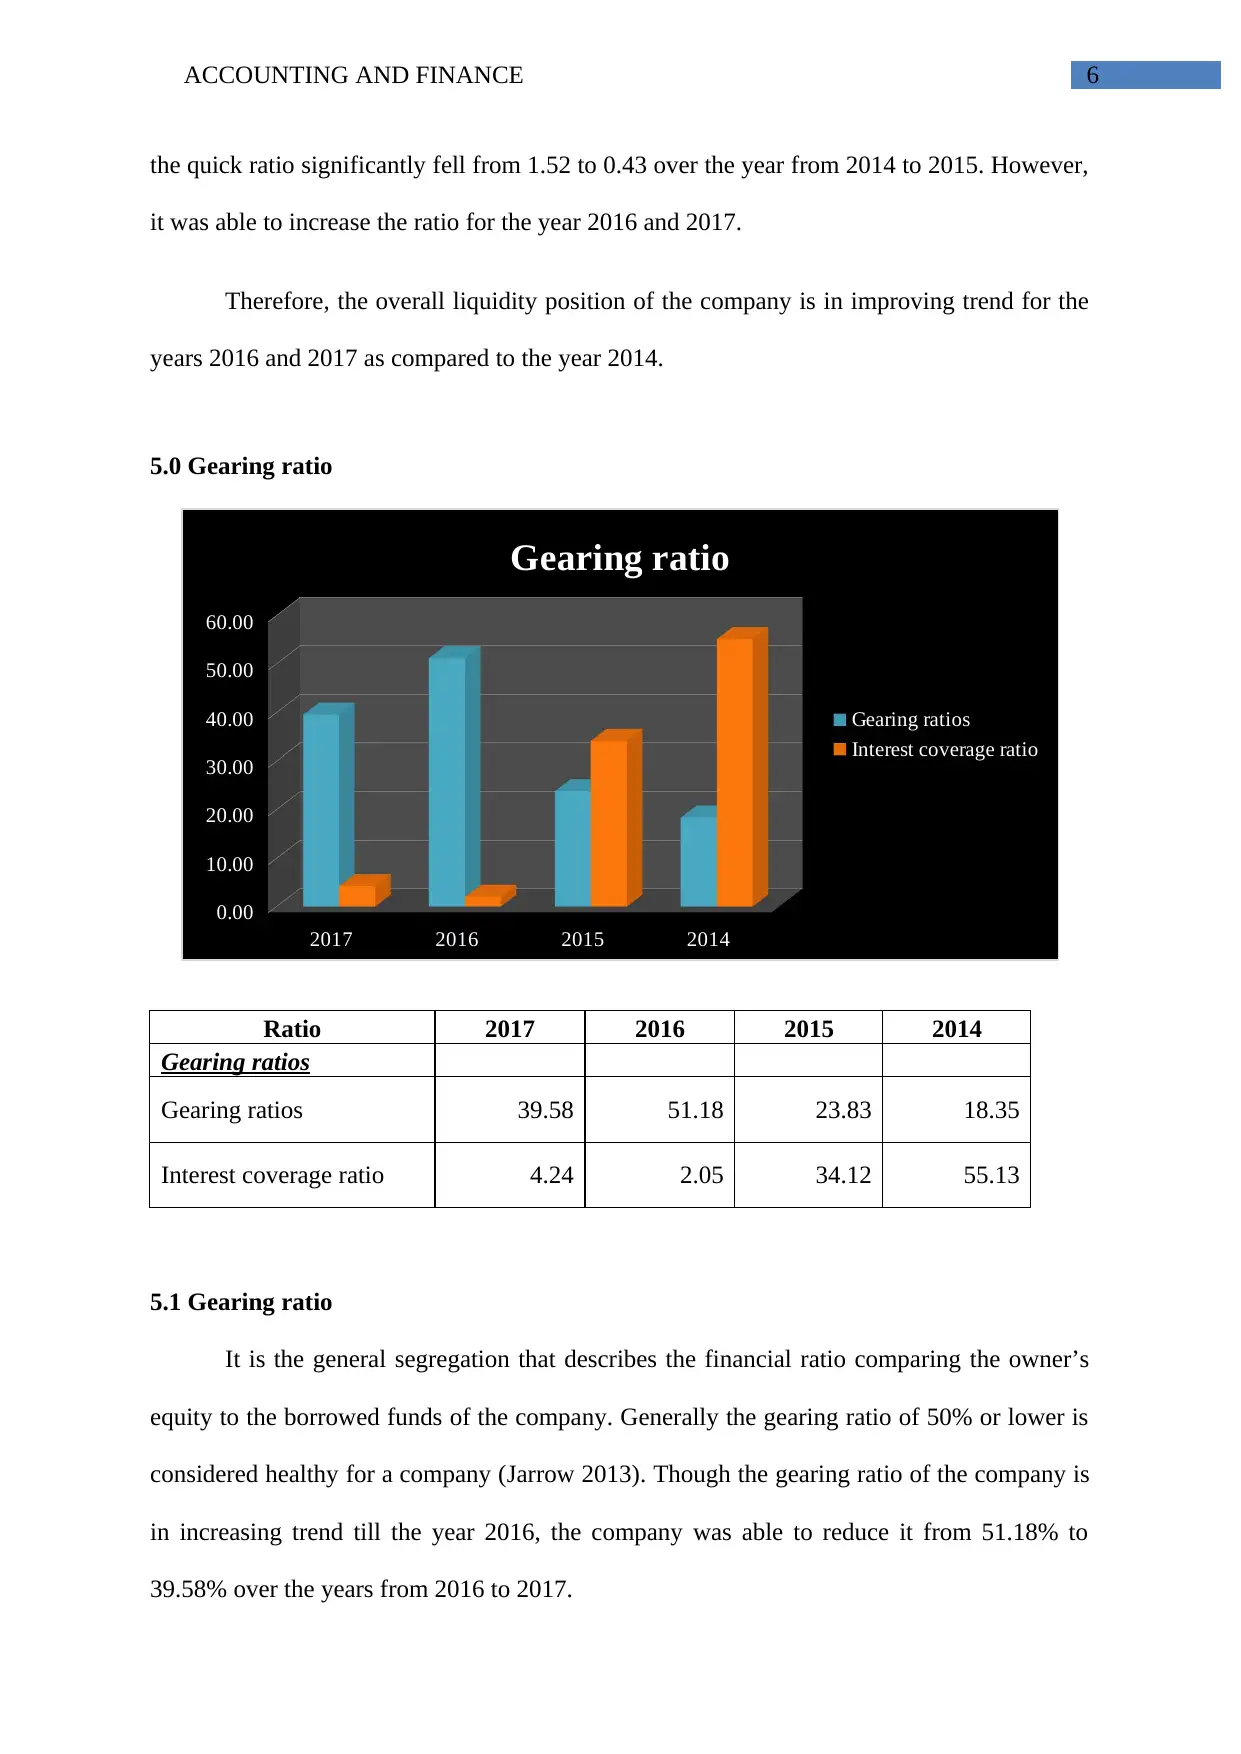
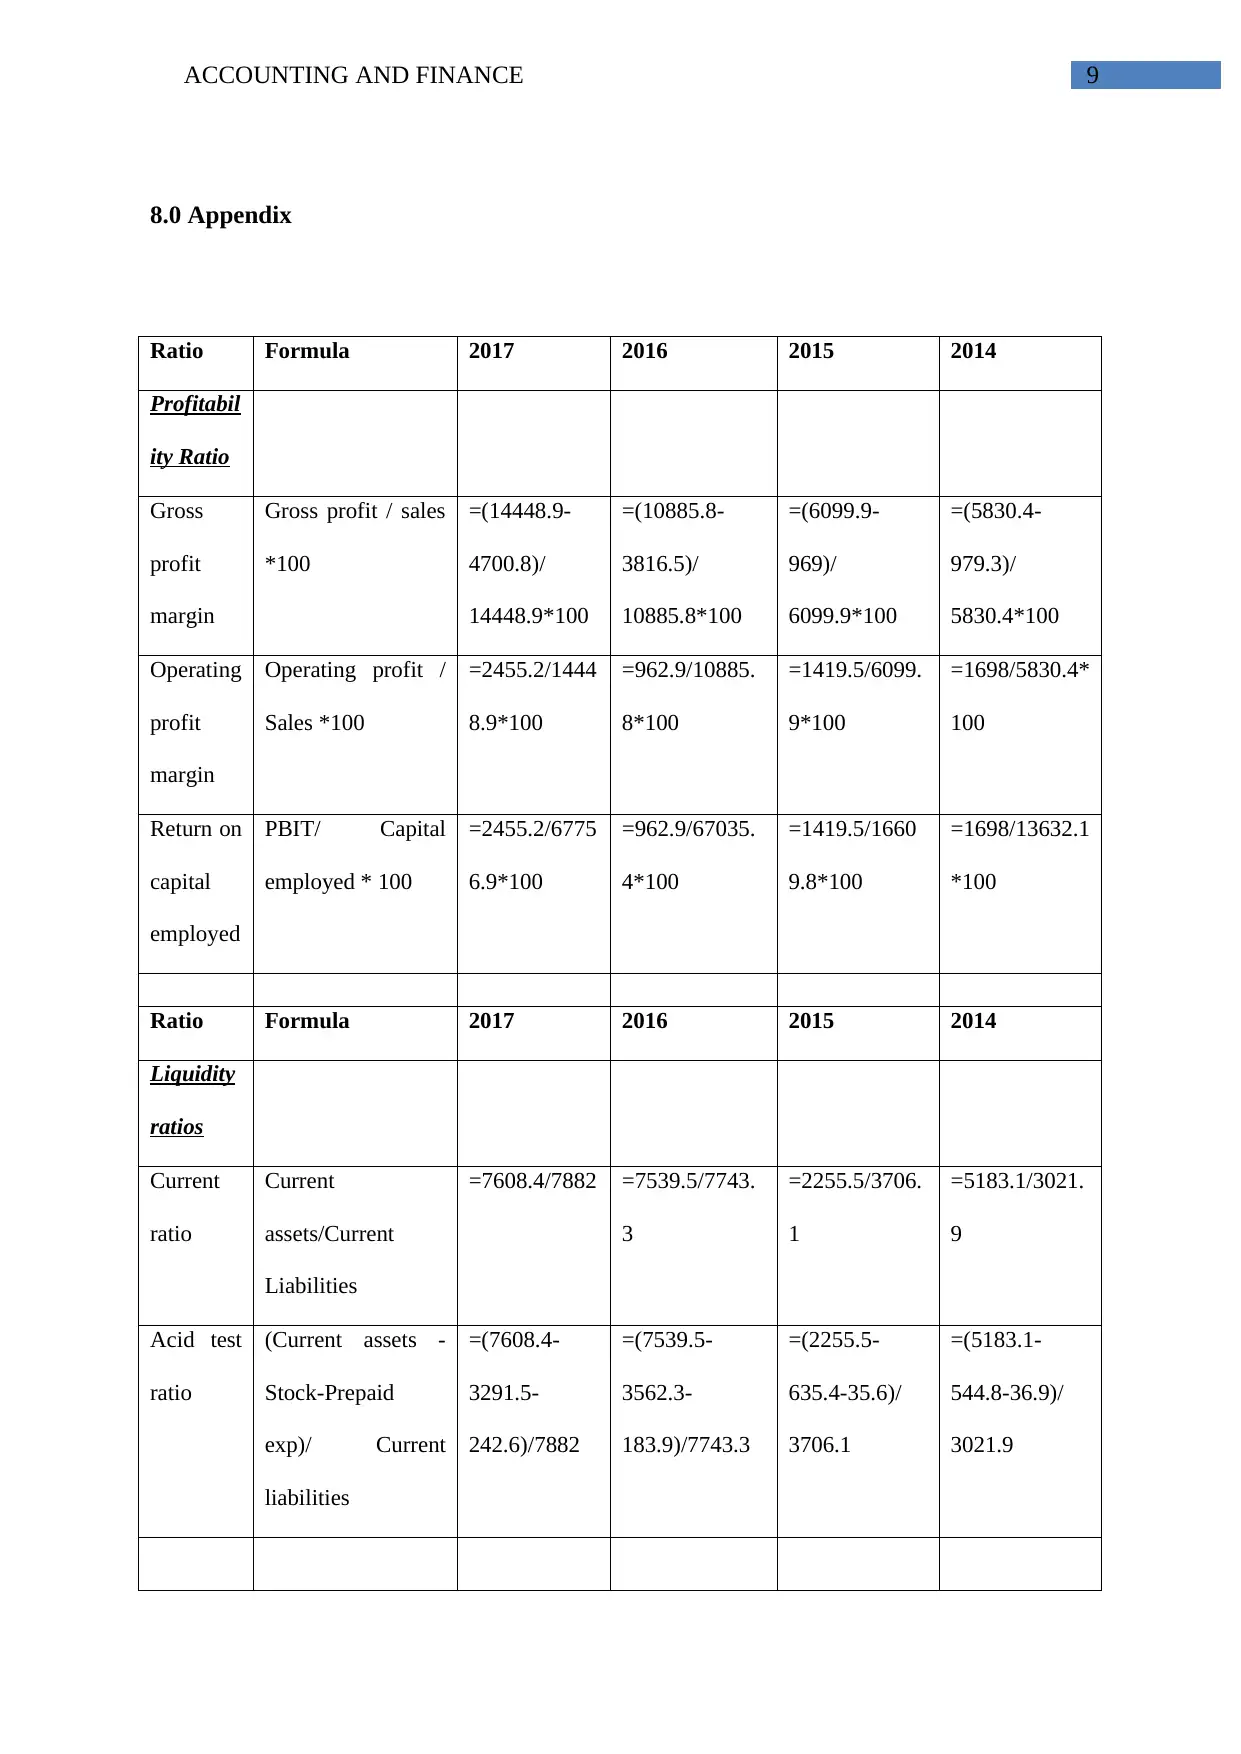
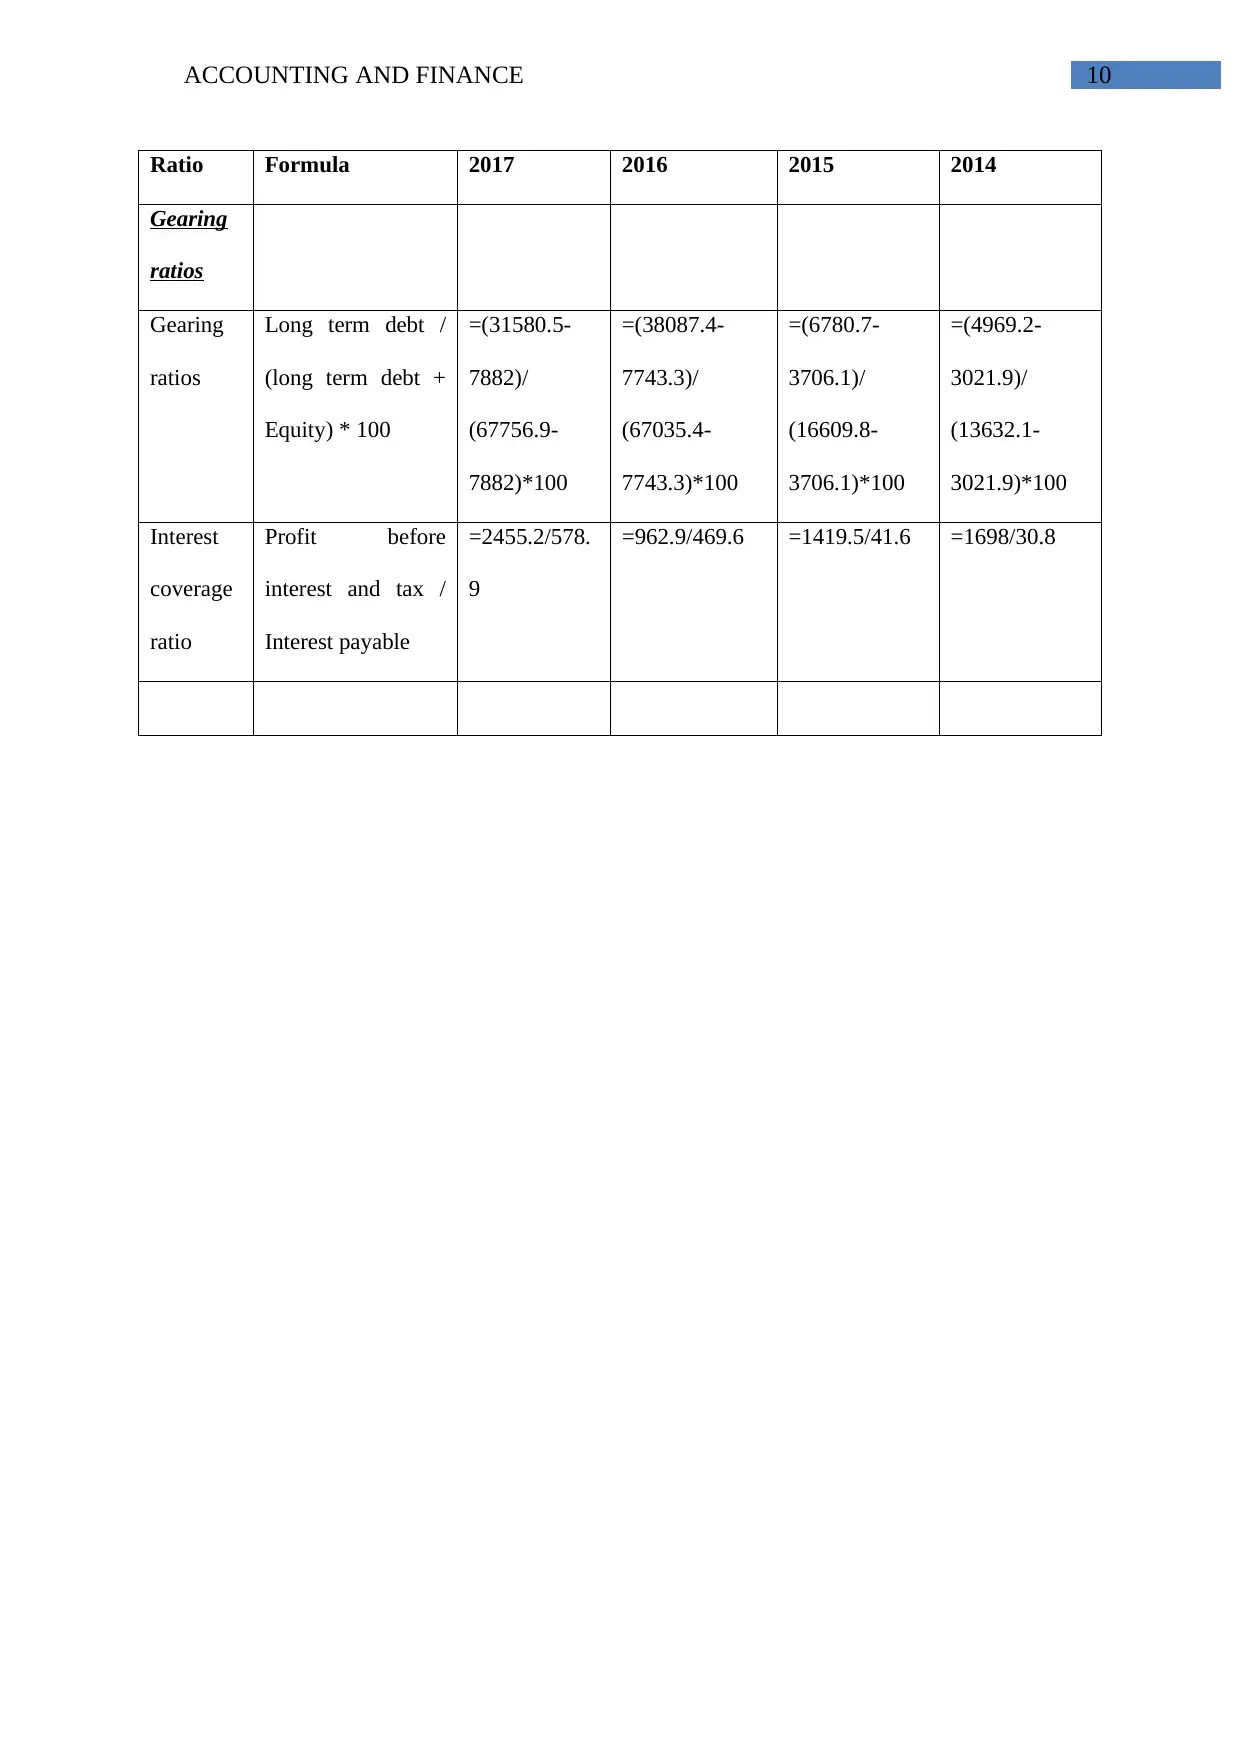
This report presents a financial analysis of Shire Plc, a biopharmaceutical company, using ratio analysis based on its financial statements from 2014 to 2017. The analysis covers profitability ratios (gross profit margin, operating profit margin, and return on capital employed), liquidity ratios (current ratio and acid test ratio), and gearing ratios (gearing ratio and interest coverage ratio). The report indicates that while the company experienced fluctuations in profitability and liquidity, it showed improvement in these areas in 2017. The gearing ratio also decreased in 2017, suggesting better financial health. The conclusion suggests that Shire Plc has a strong gross profit margin but needs to maintain focus on improving operating profit and return on capital employed. The company's liquidity and gearing positions improved in 2017, but further improvements can be achieved through strategic borrowing and short-term debt management. Desklib provides this document and many more solved assignments for students' reference.
Document Page
Running head: ACCOUNTING AND FINANCE
Accounting and finance
Name of the student
Name of the university
Student ID
Author note
tabler-icon-diamond-filled.svg

Paraphrase This Document

Need a fresh take? Get an instant paraphrase of this document with our AI Paraphraser
Document Page
1ACCOUNTING AND FINANCE
Table of Contents
1.0 Introduction.....................................................................................................................2
2.0 Ratio analysis..................................................................................................................2
2.1 Advantages of ratio analysis............................................................................................2
2.2 Limitations of ratio analysis.............................................................................................2
3.0 Profitability ratios.................................................................................................................3
3.1 Gross profit margin..........................................................................................................3
3.2 Operating profit margin....................................................................................................4
3.3 Return on capital employed.............................................................................................4
4.0 Liquidity ratio.......................................................................................................................5
4.1 Current ratio.....................................................................................................................5
4.2 Acid test or liquid ratio....................................................................................................5
5.0 Gearing ratio.........................................................................................................................6
5.1 Gearing ratio.....................................................................................................................6
5.2 Interest coverage ratio......................................................................................................7
6.0 Conclusion............................................................................................................................7
7.0 References............................................................................................................................8
8.0 Appendix..............................................................................................................................9
Document Page
2ACCOUNTING AND FINANCE
1.0 Introduction
Shire Plc, specialized in biopharmaceutical products, is registered in Jersy and have
it’s headquarter in Irish. Shire is considered as the champion for the people who are
struggling with the rare diseases all over the world. The main purpose of the company is
enabling the people with the life-altering circumstances for leading a better life. The
innovative therapies delivered by the company help to treat the life threatening and rare kind
of diseases. The company’s portfolio for the specialist therapies involves the products those
are available over more than 100 countries all over the world (Shirepharmaceuticals.co.uk
2018).
2.0 Ratio analysis
Ratio analysis is the quantitative analysis for the information available through the
financial statement of the company. It is used for analysing different aspects of the financial
and operating performance of the company that includes profitability, solvency, liquidity and
efficiency (Palepu, Healy and Peek 2013).
2.1 Advantages of ratio analysis
ï‚· It is useful tool for measuring the financial health of the company and assists the
management to analyse the financial performances of the company.
ï‚· It assists the investors and creditors to decide on matters like whether it is fruitful to
invest in the company or whether to provide credit to the firm (Zack 2013).
ï‚· The analysis is useful for the purpose of benchmarking and comparing the operation
result of the company with its peers in the industry.
Document Page
3ACCOUNTING AND FINANCE
2.2 Limitations of ratio analysis
ï‚· The computation of ratios will be correct if only the data based on which the
calculations ate made are correct
ï‚· Regular fluctuations in the level of price significantly affect the comparison or
validity of the ratios computed for various periods and therefore the comparisons
become difficult.
ï‚· Different organization use different techniques for accounting and hence, the validity
of peer comparison get affected significantly.
3.0 Profitability ratios
2017 2016 2015 2014
0
10
20
30
40
50
60
70
80
90
Profitability ratio
Gross profit margin
Operating profit margin
Return on capital
employed
Ratio 2017 2016 2015 2014
Profitability Ratio
Gross profit margin 67.47 64.94 84.11 83.20
Operating profit margin 16.99 8.85 23.27 29.12
Return on capital employed 3.62 1.44 8.55 12.46
tabler-icon-diamond-filled.svg

Paraphrase This Document

Need a fresh take? Get an instant paraphrase of this document with our AI Paraphraser
Document Page
4ACCOUNTING AND FINANCE
3.1 Gross profit margin
It is the profitability ratio that computes the percentage of the sales revenue that
exceeds cost of sales. To be more specific, it measures the efficiency of the company with
respect to usages of the labours and materials for producing the selling the products to
generate profits. It has been observed that the gross profit margin of the company has been
significantly reduced over the years from 2015 to 2016. However, the company was able to
increase the gross profit margin from 64.94% to 67.47% over the years from 2016 to 2017.
3.2 Operating profit margin
It is the profit margin of the company that is available to the company before
deducting the interest and tax expenses. Looking into the above presented calculation it has
been identified that operating profit margin of the company has been significantly reduced
over the years from 2015 to 2016. However, the company was able to increase the operating
profit margin from 8.85% to 16.99% over the years from 2016 to 2017.
3.3 Return on capital employed
It is the profitability ratio and expressed in percentage form. It is calculated through
dividing net income before tax and interest by the employed capital. It further, measures
success of the business for generating the satisfactory profit on the invested capital. It can be
observed from the calculation that the return on employed capital for the company is in
decreasing trend till the year 2016, however, it was able to increase the ratio to 3.62% in the
year 2017.
Therefore, the overall profitability ratio of the company for all the years from 2014 to
2017 through not stable, it is strong for long – term sustainability.
Document Page
5ACCOUNTING AND FINANCE
4.0 Liquidity ratio
2017 2016 2015 2014
0
0.2
0.4
0.6
0.8
1
1.2
1.4
1.6
1.8
Liquidity ratio
Current ratio
Acid test ratio
Ratio 2017 2016 2015 2014
Liquidity ratios
Current ratio 0.97 0.97 0.61 1.72
Acid test ratio 0.52 0.49 0.43 1.52
4.1 Current ratio
Current ratio is used for measuring the efficiency of the company to meet its current
liabilities with the available short term assets. It is used as a measure to analyse the liquidity
position of the company (Delen, Kuzey and Uyar 2013) It can be identified from the
calculation that current ratio of the company significantly fell from 1.72 to 0.61 over the year
from 2014 to 2015. However, it was able to increase the ratio to 0.97 for the year 2016 and
2017.
4.2 Acid test or liquid ratio
It shows the efficiency of the company with regard to the fact that how quickly the
company can transform the assets into cash for paying off the current liabilities (Babalola and
Abiola 2013). The ratio also reveals the quick asset level of the company as compared to the
current liabilities. Looking into the quick ratio calculation of the company it is observed that
Document Page
6ACCOUNTING AND FINANCE
the quick ratio significantly fell from 1.52 to 0.43 over the year from 2014 to 2015. However,
it was able to increase the ratio for the year 2016 and 2017.
Therefore, the overall liquidity position of the company is in improving trend for the
years 2016 and 2017 as compared to the year 2014.
5.0 Gearing ratio
2017 2016 2015 2014
0.00
10.00
20.00
30.00
40.00
50.00
60.00
Gearing ratio
Gearing ratios
Interest coverage ratio
Ratio 2017 2016 2015 2014
Gearing ratios
Gearing ratios 39.58 51.18 23.83 18.35
Interest coverage ratio 4.24 2.05 34.12 55.13
5.1 Gearing ratio
It is the general segregation that describes the financial ratio comparing the owner’s
equity to the borrowed funds of the company. Generally the gearing ratio of 50% or lower is
considered healthy for a company (Jarrow 2013). Though the gearing ratio of the company is
in increasing trend till the year 2016, the company was able to reduce it from 51.18% to
39.58% over the years from 2016 to 2017.
tabler-icon-diamond-filled.svg

Paraphrase This Document

Need a fresh take? Get an instant paraphrase of this document with our AI Paraphraser
Document Page
7ACCOUNTING AND FINANCE
5.2 Interest coverage ratio
It measures the company’s ability to meet the interest expenses from the operating
income available with it. If the ratio is 2.5 or more, it is considered as efficient (Acheampong,
Agalega and Shibu 2014). Though the interest coverage ratio of the company is significantly
in decreasing trend till the year 2016, the company was able to increasing it from 2.05 times
to 4.24 times over the years from 2016 to 2017.
6.0 Conclusion
From the above discussions regarding the performance of last 4 years it is concluded
that if the profitability area is analysed, the company has higher gross profit margin over all
the past years. However, the operating profit margin and return on capital employed is
significantly fell during 2015 but the company was able to improve those areas in 2017. On
the other hand the liquidity ratios and gearing ratios are revealing that the though the position
for the year 2014 is considerably bad, however during the year 2017 the company was able to
improve its position. However, to further improve the ratio the company shall raise further
borrowing through debt-equity mix and make payment for the short term dues.
Document Page
8ACCOUNTING AND FINANCE
7.0 References
Acheampong, P., Agalega, E. and Shibu, A.K., 2014. The effect of financial leverage and
market size on stock returns on the Ghana Stock Exchange: evidence from selected stocks in
the manufacturing sector. International Journal of Financial Research, 5(1), p.125.
Babalola, Y.A. and Abiola, F.R., 2013. Financial ratio analysis of firms: A tool for decision
making. International journal of management sciences, 1(4), pp.132-137.
Delen, D., Kuzey, C. and Uyar, A., 2013. Measuring firm performance using financial ratios:
A decision tree approach. Expert Systems with Applications, 40(10), pp.3970-3983.
Jarrow, R., 2013. A leverage ratio rule for capital adequacy. Journal of Banking &
Finance, 37(3), pp.973-976.
Palepu, K.G., Healy, P.M. and Peek, E., 2013. Business analysis and valuation: IFRS edition.
Cengage Learning.
Shirepharmaceuticals.co.uk 2018. Shire: The Leading Global Biotech Focusing on Rare
Diseases. [online] Available at: https://www.shirepharmaceuticals.co.uk/ [Accessed 3 Apr.
2018].
Zack, G.M., 2013. Financial Statement Analysis. Financial Statement Fraud: Strategies for
Detection and Investigation, pp.209-213.
Document Page
9ACCOUNTING AND FINANCE
8.0 Appendix
Ratio Formula 2017 2016 2015 2014
Profitabil
ity Ratio
Gross
profit
margin
Gross profit / sales
*100
=(14448.9-
4700.8)/
14448.9*100
=(10885.8-
3816.5)/
10885.8*100
=(6099.9-
969)/
6099.9*100
=(5830.4-
979.3)/
5830.4*100
Operating
profit
margin
Operating profit /
Sales *100
=2455.2/1444
8.9*100
=962.9/10885.
8*100
=1419.5/6099.
9*100
=1698/5830.4*
100
Return on
capital
employed
PBIT/ Capital
employed * 100
=2455.2/6775
6.9*100
=962.9/67035.
4*100
=1419.5/1660
9.8*100
=1698/13632.1
*100
Ratio Formula 2017 2016 2015 2014
Liquidity
ratios
Current
ratio
Current
assets/Current
Liabilities
=7608.4/7882 =7539.5/7743.
3
=2255.5/3706.
1
=5183.1/3021.
9
Acid test
ratio
(Current assets -
Stock-Prepaid
exp)/ Current
liabilities
=(7608.4-
3291.5-
242.6)/7882
=(7539.5-
3562.3-
183.9)/7743.3
=(2255.5-
635.4-35.6)/
3706.1
=(5183.1-
544.8-36.9)/
3021.9
tabler-icon-diamond-filled.svg

Paraphrase This Document

Need a fresh take? Get an instant paraphrase of this document with our AI Paraphraser
Document Page
10ACCOUNTING AND FINANCE
Ratio Formula 2017 2016 2015 2014
Gearing
ratios
Gearing
ratios
Long term debt /
(long term debt +
Equity) * 100
=(31580.5-
7882)/
(67756.9-
7882)*100
=(38087.4-
7743.3)/
(67035.4-
7743.3)*100
=(6780.7-
3706.1)/
(16609.8-
3706.1)*100
=(4969.2-
3021.9)/
(13632.1-
3021.9)*100
Interest
coverage
ratio
Profit before
interest and tax /
Interest payable
=2455.2/578.
9
=962.9/469.6 =1419.5/41.6 =1698/30.8
chevron_up_icon
1 out of 11
circle_padding
hide_on_mobile
zoom_out_icon
[object Object]