Woolworths Financial Report: Analysis of an Australian Company
VerifiedAdded on 2023/06/07
|22
|4160
|266
Report
AI Summary
This report provides a comprehensive financial analysis of Woolworths, a major Australian supermarket chain. It uses vertical and ratio analysis to evaluate the company's financial performance, considering income statements, balance sheets, and cash flow statements over a five-year period. The analysis compares Woolworths' performance to its competitor, Wesfarmers, focusing on profitability, liquidity, and solvency ratios. The report identifies fluctuating financial positions, highlighting improvements in recent years with reduced liabilities and investments in fixed assets. Despite positive trends, the report suggests areas for improvement to match previous performance levels. The analysis concludes that while Woolworths shows positive signs, ongoing efforts are needed to strengthen its financial standing in the competitive Australian retail market. Desklib is a platform where students can find similar solved assignments and past papers for their academic needs.
ASSESSMENT TASK2:
WRITTEN REPORT ON AN
AUSTRALIAN COMPANY’S
FINANCIAL PERFORMANCE
Accounting and finance for managers
WRITTEN REPORT ON AN
AUSTRALIAN COMPANY’S
FINANCIAL PERFORMANCE
Accounting and finance for managers
Paraphrase This Document
Need a fresh take? Get an instant paraphrase of this document with our AI Paraphraser
TABLE OF CONTENTS
1. Executive Summary...............................................................................................................3
2. Introduction............................................................................................................................4
3. Discussion and critical analysis.............................................................................................4
3.1 Financial statement analysis.............................................................................................4
Income statement...............................................................................................................4
Balance sheet......................................................................................................................4
Cash flow statement...........................................................................................................4
3.2 Financial ratio analysis.....................................................................................................4
4. Conclusion..............................................................................................................................4
5. Appendices.............................................................................................................................5
5.1 Income statement.............................................................................................................5
5.2 Income statement vertical analysis...................................................................................5
5.3 Statement of financial position.........................................................................................6
5.4 Cash flow statement.........................................................................................................7
5.5 ratio analysis of Woolsworth...........................................................................................8
5.6 Ratio analysis of Wesfarmers...........................................................................................8
6. References..............................................................................................................................8
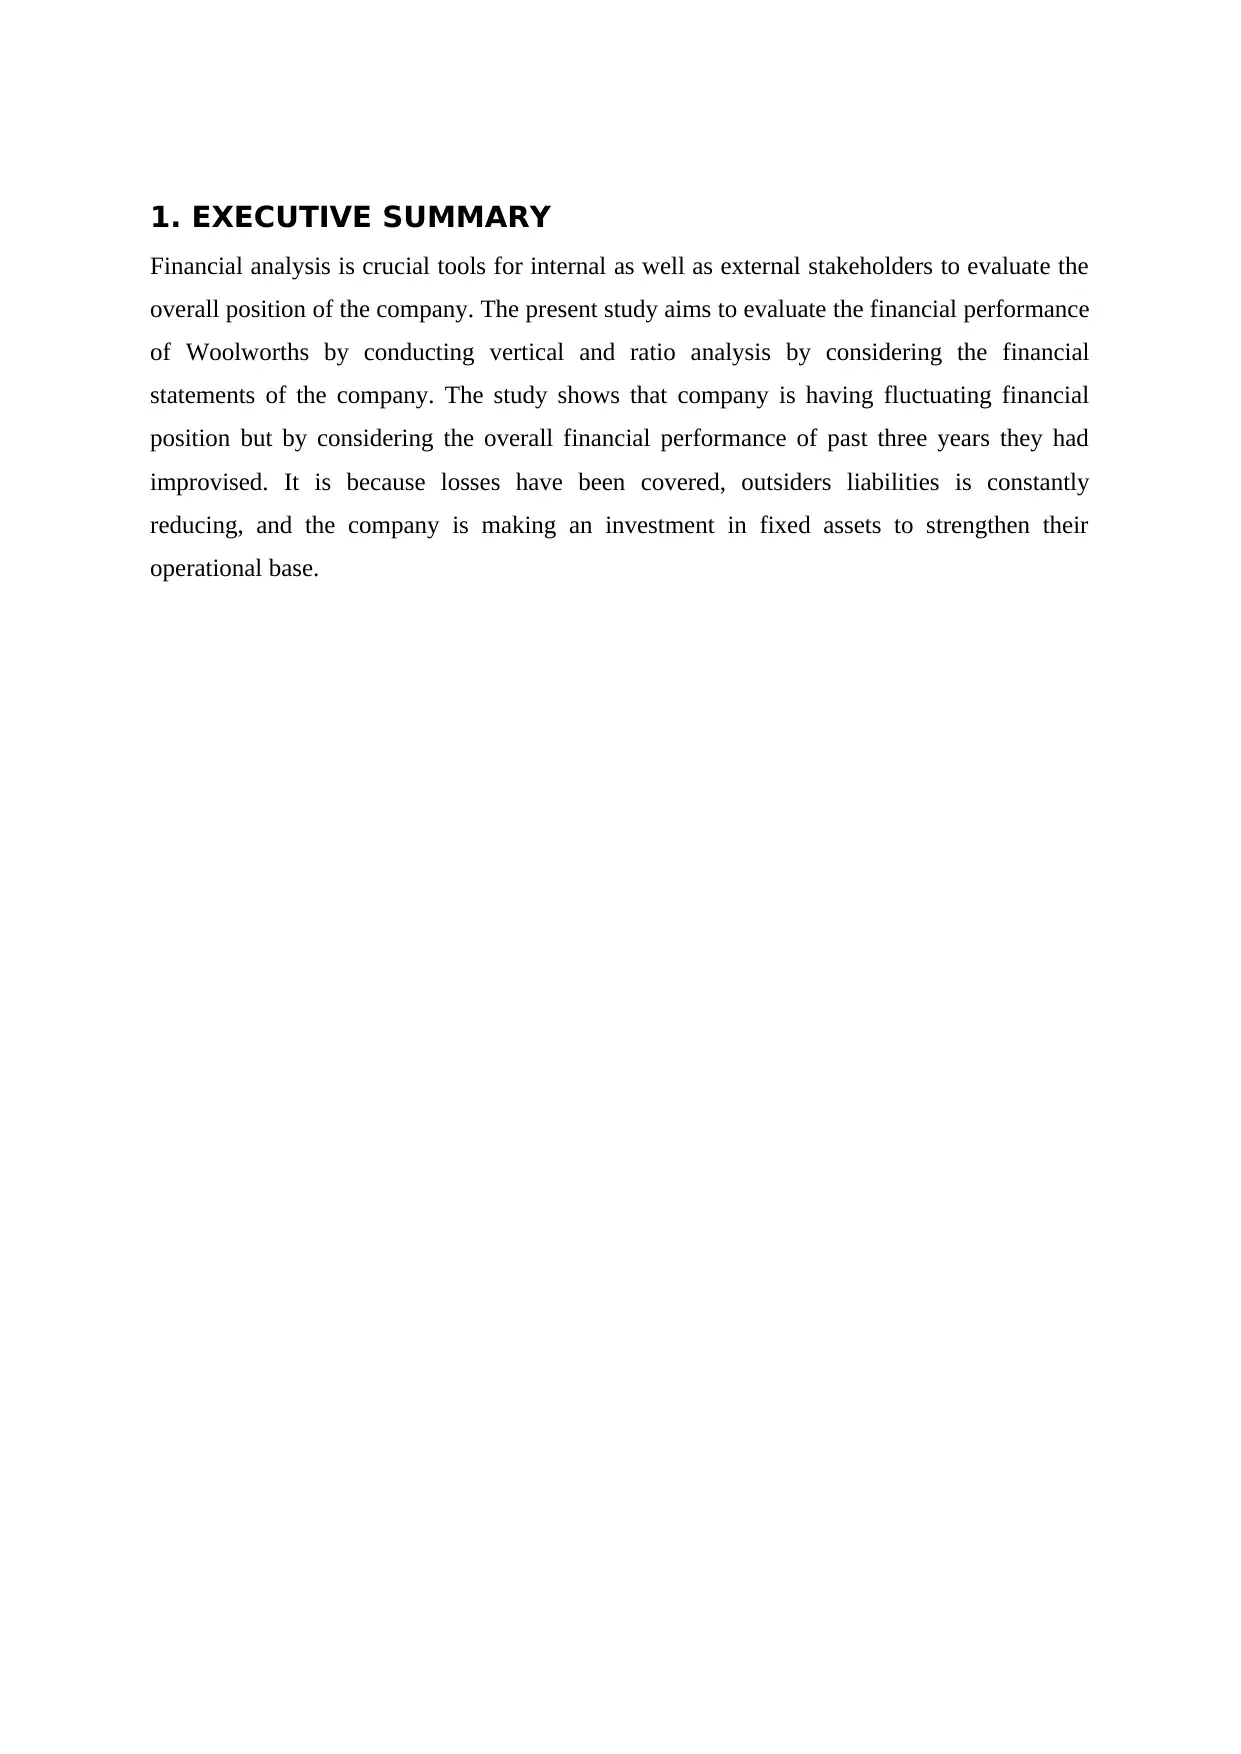
1. EXECUTIVE SUMMARY
Financial analysis is crucial tools for internal as well as external stakeholders to evaluate the
overall position of the company. The present study aims to evaluate the financial performance
of Woolworths by conducting vertical and ratio analysis by considering the financial
statements of the company. The study shows that company is having fluctuating financial
position but by considering the overall financial performance of past three years they had
improvised. It is because losses have been covered, outsiders liabilities is constantly
reducing, and the company is making an investment in fixed assets to strengthen their
operational base.
⊘ This is a preview!⊘
Do you want full access?
Subscribe today to unlock all pages.
Trusted by 1+ million students worldwide
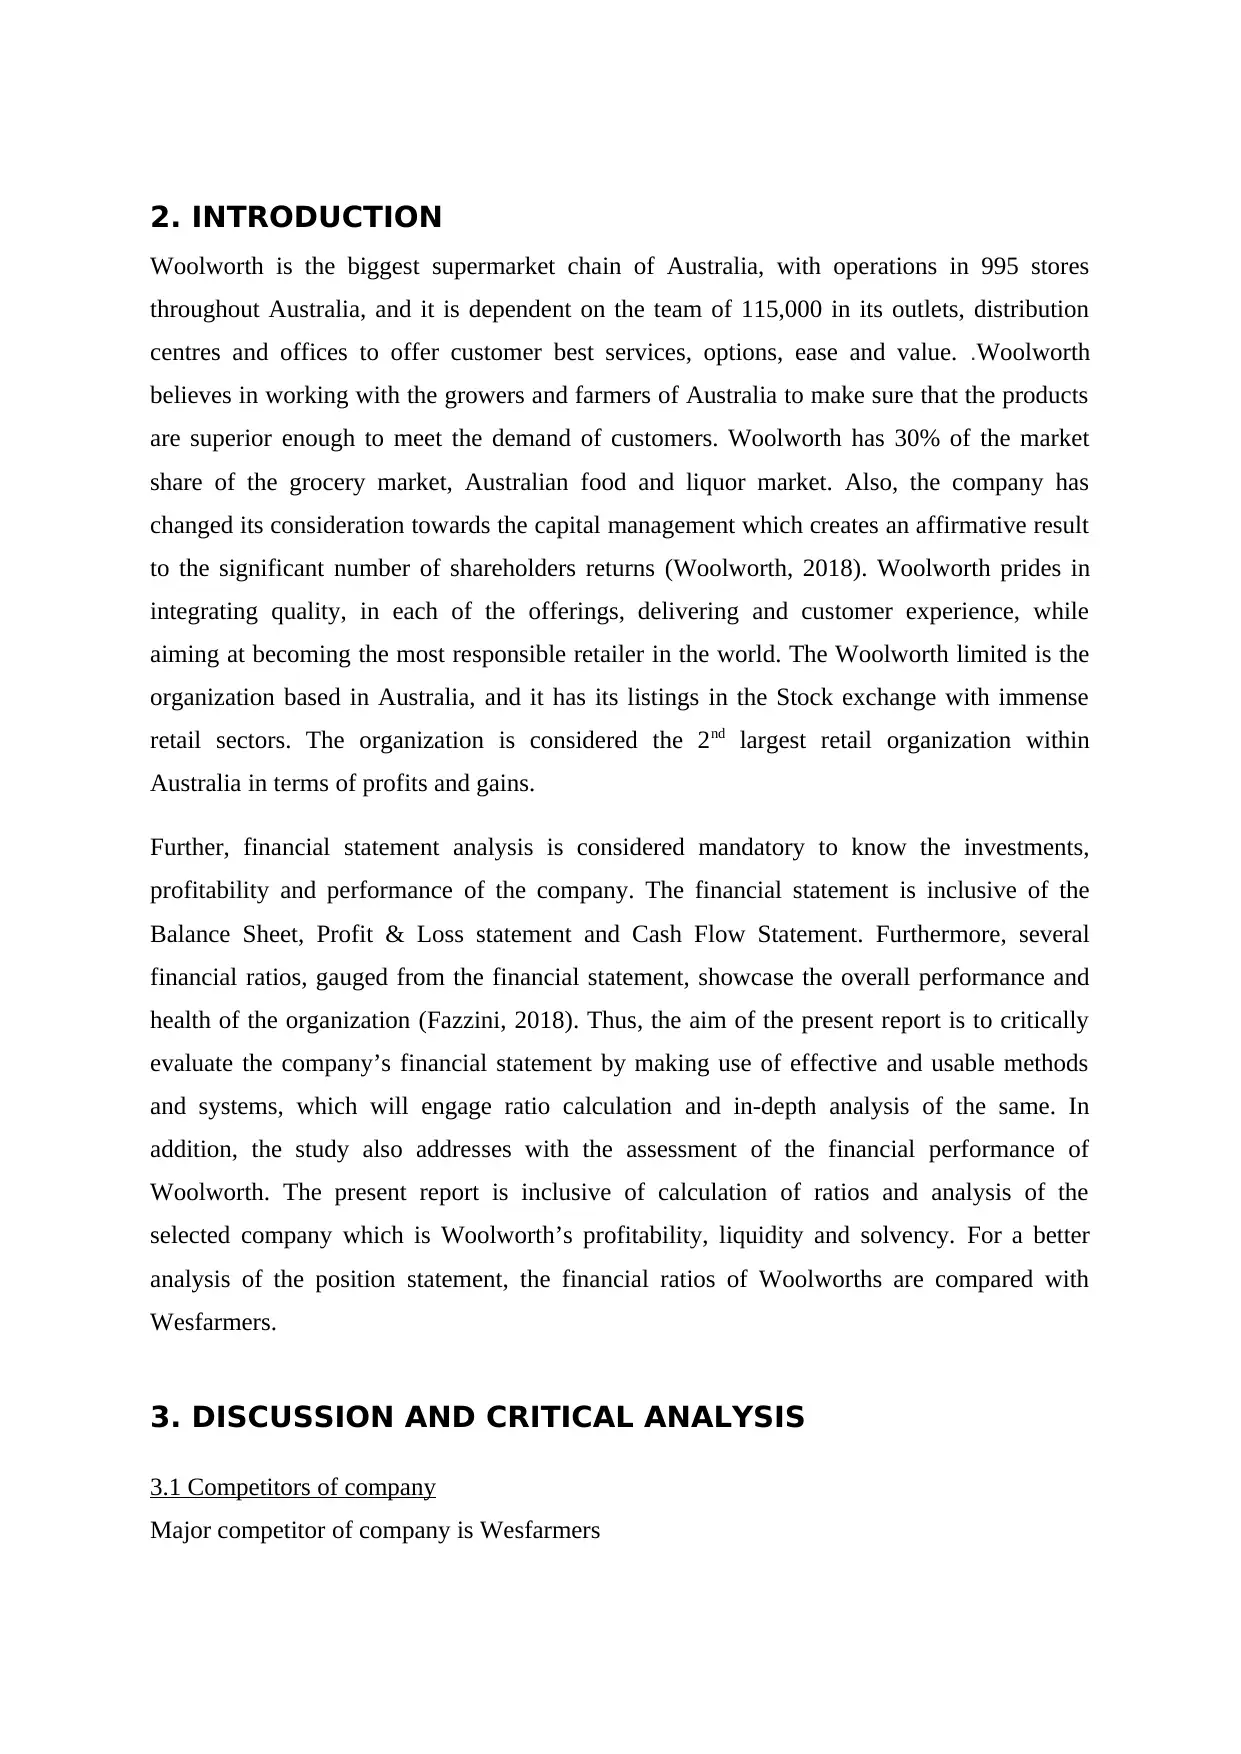
2. INTRODUCTION
Woolworth is the biggest supermarket chain of Australia, with operations in 995 stores
throughout Australia, and it is dependent on the team of 115,000 in its outlets, distribution
centres and offices to offer customer best services, options, ease and value. .Woolworth
believes in working with the growers and farmers of Australia to make sure that the products
are superior enough to meet the demand of customers. Woolworth has 30% of the market
share of the grocery market, Australian food and liquor market. Also, the company has
changed its consideration towards the capital management which creates an affirmative result
to the significant number of shareholders returns (Woolworth, 2018). Woolworth prides in
integrating quality, in each of the offerings, delivering and customer experience, while
aiming at becoming the most responsible retailer in the world. The Woolworth limited is the
organization based in Australia, and it has its listings in the Stock exchange with immense
retail sectors. The organization is considered the 2nd largest retail organization within
Australia in terms of profits and gains.
Further, financial statement analysis is considered mandatory to know the investments,
profitability and performance of the company. The financial statement is inclusive of the
Balance Sheet, Profit & Loss statement and Cash Flow Statement. Furthermore, several
financial ratios, gauged from the financial statement, showcase the overall performance and
health of the organization (Fazzini, 2018). Thus, the aim of the present report is to critically
evaluate the company’s financial statement by making use of effective and usable methods
and systems, which will engage ratio calculation and in-depth analysis of the same. In
addition, the study also addresses with the assessment of the financial performance of
Woolworth. The present report is inclusive of calculation of ratios and analysis of the
selected company which is Woolworth’s profitability, liquidity and solvency. For a better
analysis of the position statement, the financial ratios of Woolworths are compared with
Wesfarmers.
3. DISCUSSION AND CRITICAL ANALYSIS
3.1 Competitors of company
Major competitor of company is Wesfarmers
Paraphrase This Document
Need a fresh take? Get an instant paraphrase of this document with our AI Paraphraser
3.2 Financial statement analysis
Income statement
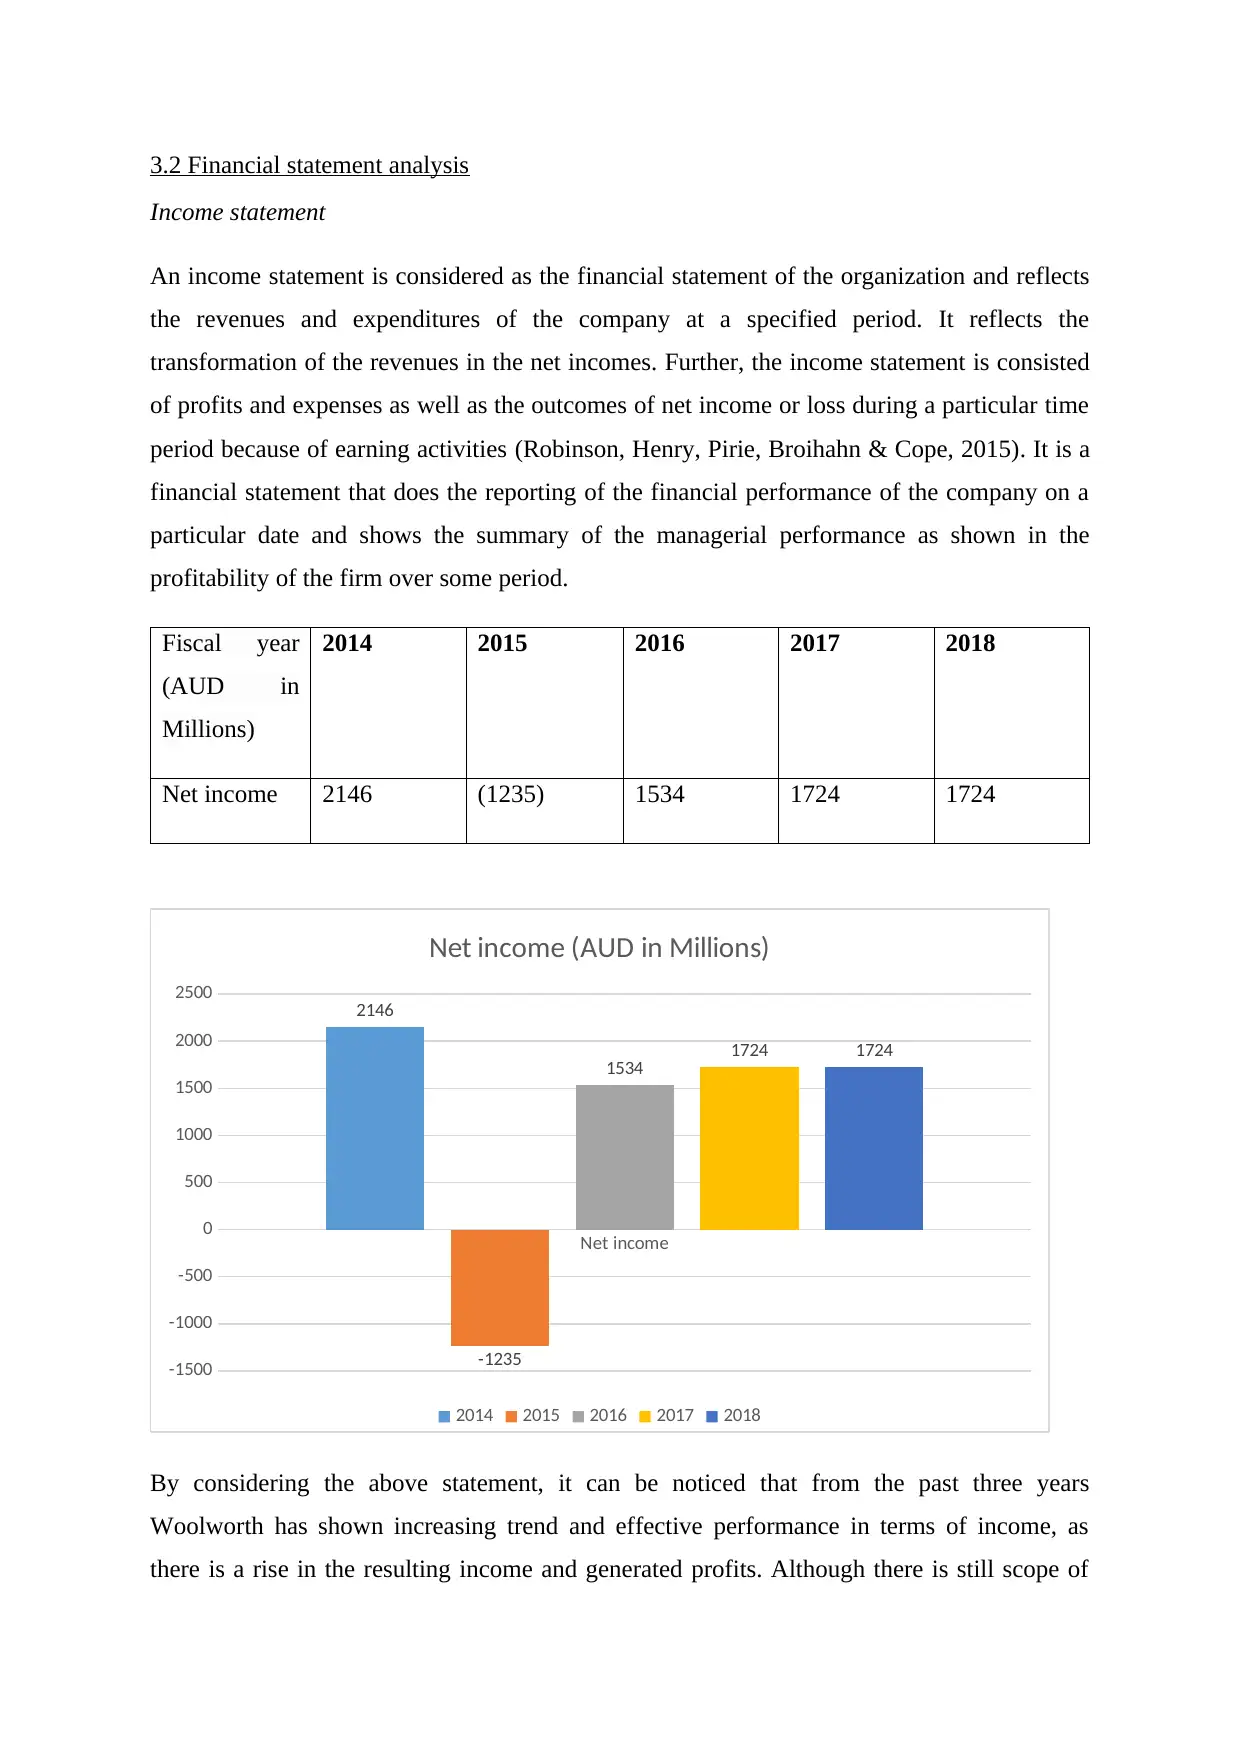
An income statement is considered as the financial statement of the organization and reflects
the revenues and expenditures of the company at a specified period. It reflects the
transformation of the revenues in the net incomes. Further, the income statement is consisted
of profits and expenses as well as the outcomes of net income or loss during a particular time
period because of earning activities (Robinson, Henry, Pirie, Broihahn & Cope, 2015). It is a
financial statement that does the reporting of the financial performance of the company on a
particular date and shows the summary of the managerial performance as shown in the
profitability of the firm over some period.
Fiscal year
(AUD in
Millions)
2014 2015 2016 2017 2018
Net income 2146 (1235) 1534 1724 1724
Net income
-1500
-1000
-500
0
500
1000
1500
2000
2500 2146
-1235
1534 1724 1724
Net income (AUD in Millions)
2014 2015 2016 2017 2018
By considering the above statement, it can be noticed that from the past three years
Woolworth has shown increasing trend and effective performance in terms of income, as
there is a rise in the resulting income and generated profits. Although there is still scope of
Income statement
An income statement is considered as the financial statement of the organization and reflects
the revenues and expenditures of the company at a specified period. It reflects the
transformation of the revenues in the net incomes. Further, the income statement is consisted
of profits and expenses as well as the outcomes of net income or loss during a particular time
period because of earning activities (Robinson, Henry, Pirie, Broihahn & Cope, 2015). It is a
financial statement that does the reporting of the financial performance of the company on a
particular date and shows the summary of the managerial performance as shown in the
profitability of the firm over some period.
Fiscal year
(AUD in
Millions)
2014 2015 2016 2017 2018
Net income 2146 (1235) 1534 1724 1724
Net income
-1500
-1000
-500
0
500
1000
1500
2000
2500 2146
-1235
1534 1724 1724
Net income (AUD in Millions)
2014 2015 2016 2017 2018
By considering the above statement, it can be noticed that from the past three years
Woolworth has shown increasing trend and effective performance in terms of income, as
there is a rise in the resulting income and generated profits. Although there is still scope of
improvement for the company, by considering the data given in past five years, it can be said
that in 2014 the company was performing exceptionally well, so the company again is
required to match the same level and track in order to become more strong financially
(Annual report of Woolsworth, 2014).
Balance sheet
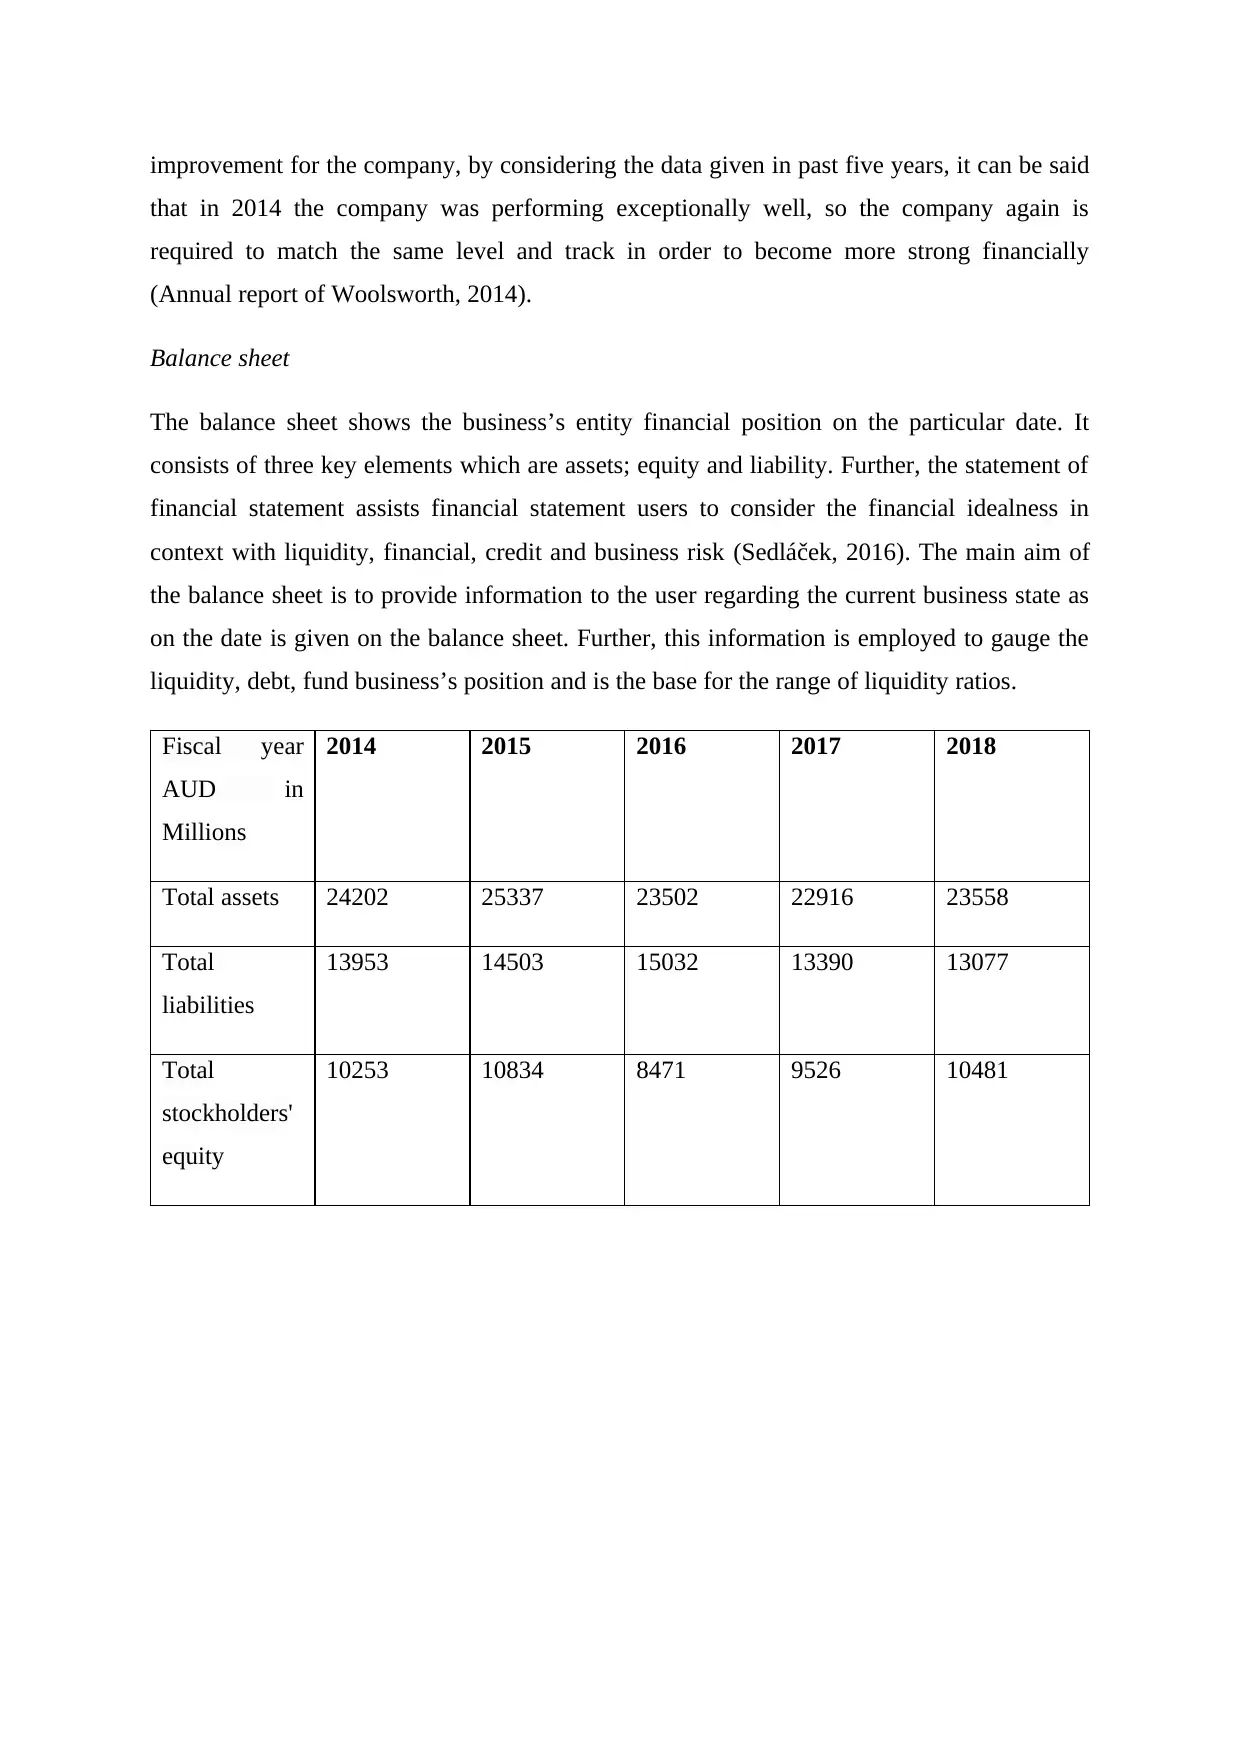
The balance sheet shows the business’s entity financial position on the particular date. It
consists of three key elements which are assets; equity and liability. Further, the statement of
financial statement assists financial statement users to consider the financial idealness in
context with liquidity, financial, credit and business risk (Sedláček, 2016). The main aim of
the balance sheet is to provide information to the user regarding the current business state as
on the date is given on the balance sheet. Further, this information is employed to gauge the
liquidity, debt, fund business’s position and is the base for the range of liquidity ratios.
Fiscal year
AUD in
Millions
2014 2015 2016 2017 2018
Total assets 24202 25337 23502 22916 23558
Total
liabilities
13953 14503 15032 13390 13077
Total
stockholders'
equity
10253 10834 8471 9526 10481
that in 2014 the company was performing exceptionally well, so the company again is
required to match the same level and track in order to become more strong financially
(Annual report of Woolsworth, 2014).
Balance sheet
The balance sheet shows the business’s entity financial position on the particular date. It
consists of three key elements which are assets; equity and liability. Further, the statement of
financial statement assists financial statement users to consider the financial idealness in
context with liquidity, financial, credit and business risk (Sedláček, 2016). The main aim of
the balance sheet is to provide information to the user regarding the current business state as
on the date is given on the balance sheet. Further, this information is employed to gauge the
liquidity, debt, fund business’s position and is the base for the range of liquidity ratios.
Fiscal year
AUD in
Millions
2014 2015 2016 2017 2018
Total assets 24202 25337 23502 22916 23558
Total
liabilities
13953 14503 15032 13390 13077
Total
stockholders'
equity
10253 10834 8471 9526 10481
⊘ This is a preview!⊘
Do you want full access?
Subscribe today to unlock all pages.
Trusted by 1+ million students worldwide
Total assets Total liabilities Total stockholders' equity
0
5000
10000
15000
20000
25000
30000
Equity, Liabilities and Assets (AUD in Millions)
2014 2015 2016 2017 2018
By considering the above table, it can be cited that the analysis of assets, it can be said that
the figures are fluctuating, however it can be said that increase from previous fiscal year,
further the fluctuation value is minor showing that on overall basis company is maintaining
their financial position and focused on and strengthening their resources with the objectives
to earn good return (Annual report of Woolsworth, 2018). On the basis of the total liabilities
of the company, it can be seen that they are decreasing as compared to the previous years,
because of the decreasing loan and debt forces from external sources. Thus it shows the
increasing worth of the company. The total stockholder equity has been increased as
compared to 2016, which shows that the financial performance is going good, but their
improvement is still required to be considered because previously it was more effective
(Annual report of Woolsworth, 2016).
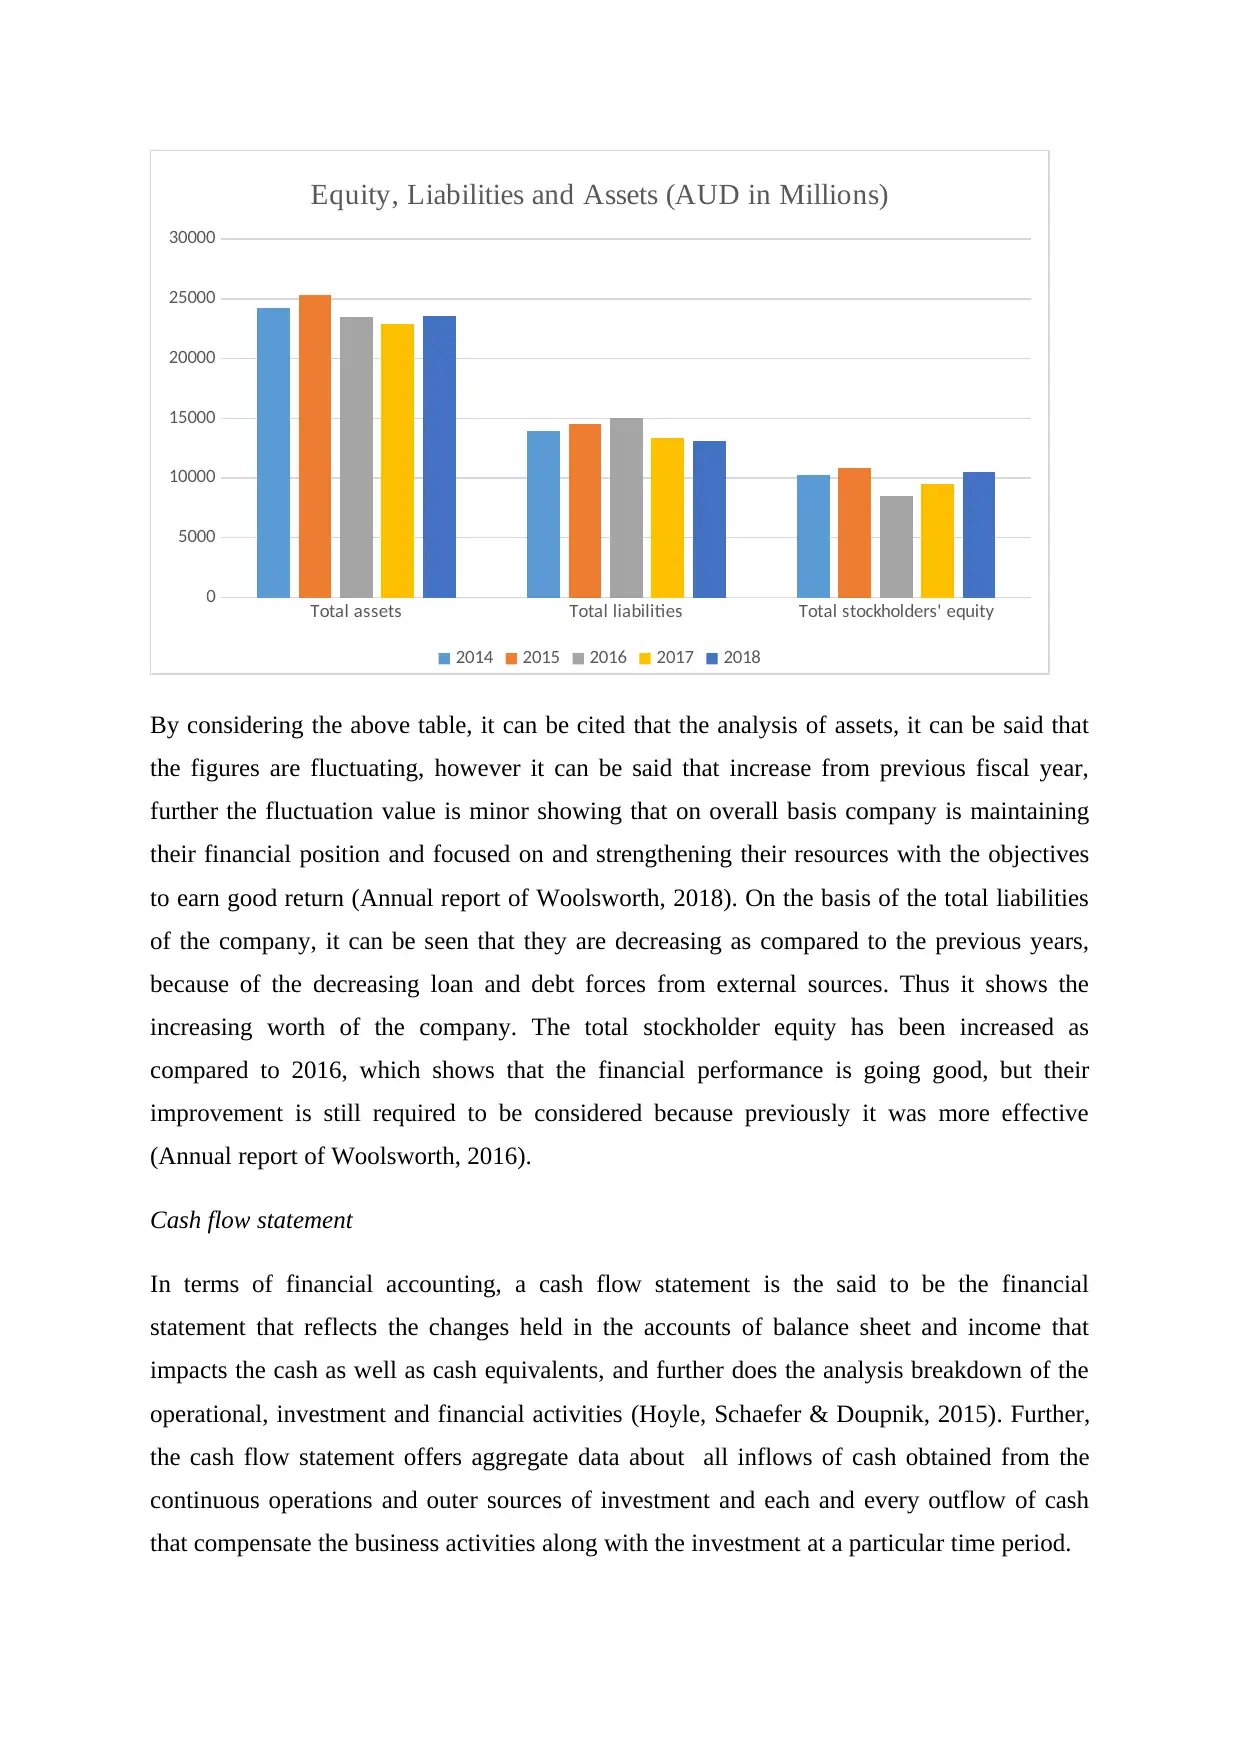
Cash flow statement
In terms of financial accounting, a cash flow statement is the said to be the financial
statement that reflects the changes held in the accounts of balance sheet and income that
impacts the cash as well as cash equivalents, and further does the analysis breakdown of the
operational, investment and financial activities (Hoyle, Schaefer & Doupnik, 2015). Further,
the cash flow statement offers aggregate data about all inflows of cash obtained from the
continuous operations and outer sources of investment and each and every outflow of cash
that compensate the business activities along with the investment at a particular time period.
0
5000
10000
15000
20000
25000
30000
Equity, Liabilities and Assets (AUD in Millions)
2014 2015 2016 2017 2018
By considering the above table, it can be cited that the analysis of assets, it can be said that
the figures are fluctuating, however it can be said that increase from previous fiscal year,
further the fluctuation value is minor showing that on overall basis company is maintaining
their financial position and focused on and strengthening their resources with the objectives
to earn good return (Annual report of Woolsworth, 2018). On the basis of the total liabilities
of the company, it can be seen that they are decreasing as compared to the previous years,
because of the decreasing loan and debt forces from external sources. Thus it shows the
increasing worth of the company. The total stockholder equity has been increased as
compared to 2016, which shows that the financial performance is going good, but their
improvement is still required to be considered because previously it was more effective
(Annual report of Woolsworth, 2016).
Cash flow statement
In terms of financial accounting, a cash flow statement is the said to be the financial
statement that reflects the changes held in the accounts of balance sheet and income that
impacts the cash as well as cash equivalents, and further does the analysis breakdown of the
operational, investment and financial activities (Hoyle, Schaefer & Doupnik, 2015). Further,
the cash flow statement offers aggregate data about all inflows of cash obtained from the
continuous operations and outer sources of investment and each and every outflow of cash
that compensate the business activities along with the investment at a particular time period.
Paraphrase This Document
Need a fresh take? Get an instant paraphrase of this document with our AI Paraphraser
Fiscal year
ends AUD
in Millions
2014 2015 2016 2017 2018
Net cash
provided by
operating
activities
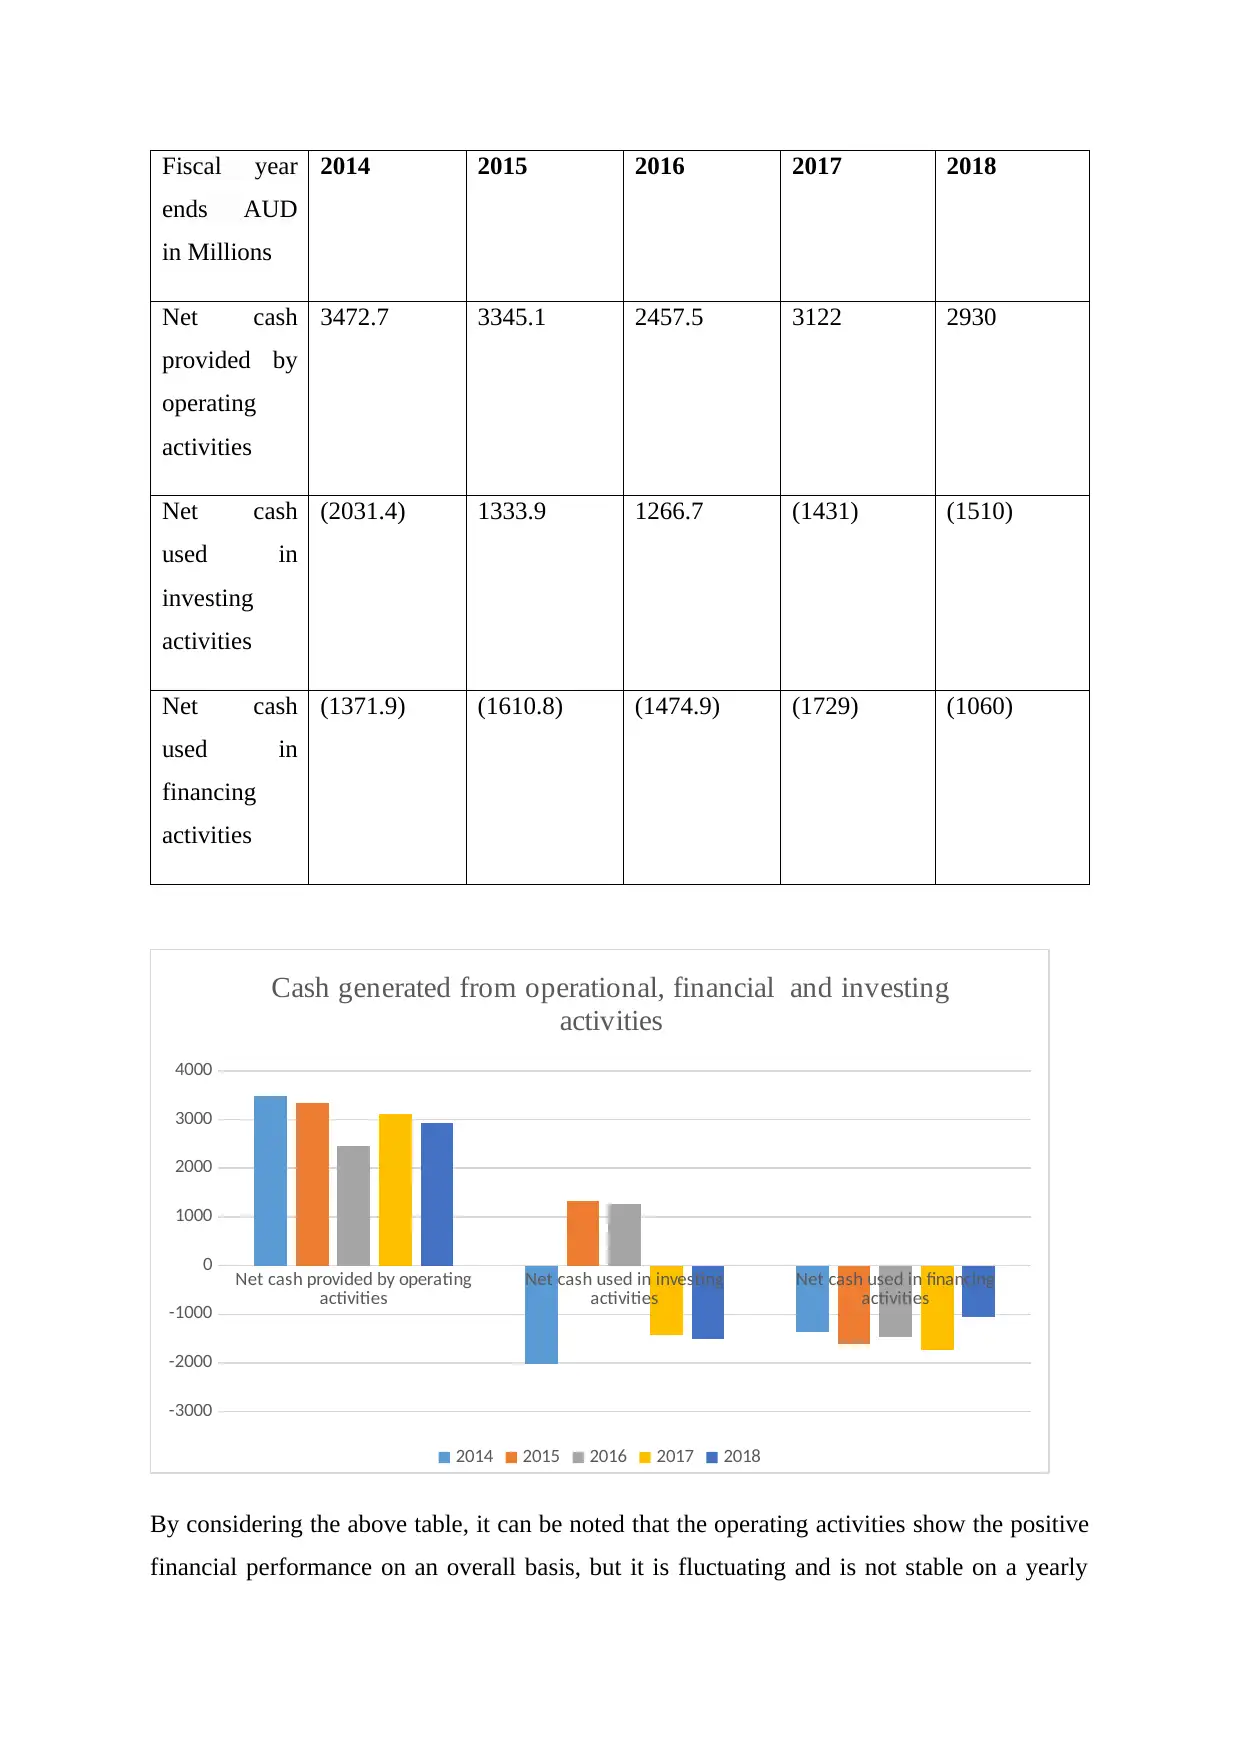
3472.7 3345.1 2457.5 3122 2930
Net cash
used in
investing
activities
(2031.4) 1333.9 1266.7 (1431) (1510)
Net cash
used in
financing
activities
(1371.9) (1610.8) (1474.9) (1729) (1060)
Net cash provided by operating
activities Net cash used in investing
activities Net cash used in financing
activities
-3000
-2000
-1000
0
1000
2000
3000
4000
Cash generated from operational, financial and investing
activities
2014 2015 2016 2017 2018
By considering the above table, it can be noted that the operating activities show the positive
financial performance on an overall basis, but it is fluctuating and is not stable on a yearly
ends AUD
in Millions
2014 2015 2016 2017 2018
Net cash
provided by
operating
activities
3472.7 3345.1 2457.5 3122 2930
Net cash
used in
investing
activities
(2031.4) 1333.9 1266.7 (1431) (1510)
Net cash
used in
financing
activities
(1371.9) (1610.8) (1474.9) (1729) (1060)
Net cash provided by operating
activities Net cash used in investing
activities Net cash used in financing
activities
-3000
-2000
-1000
0
1000
2000
3000
4000
Cash generated from operational, financial and investing
activities
2014 2015 2016 2017 2018
By considering the above table, it can be noted that the operating activities show the positive
financial performance on an overall basis, but it is fluctuating and is not stable on a yearly
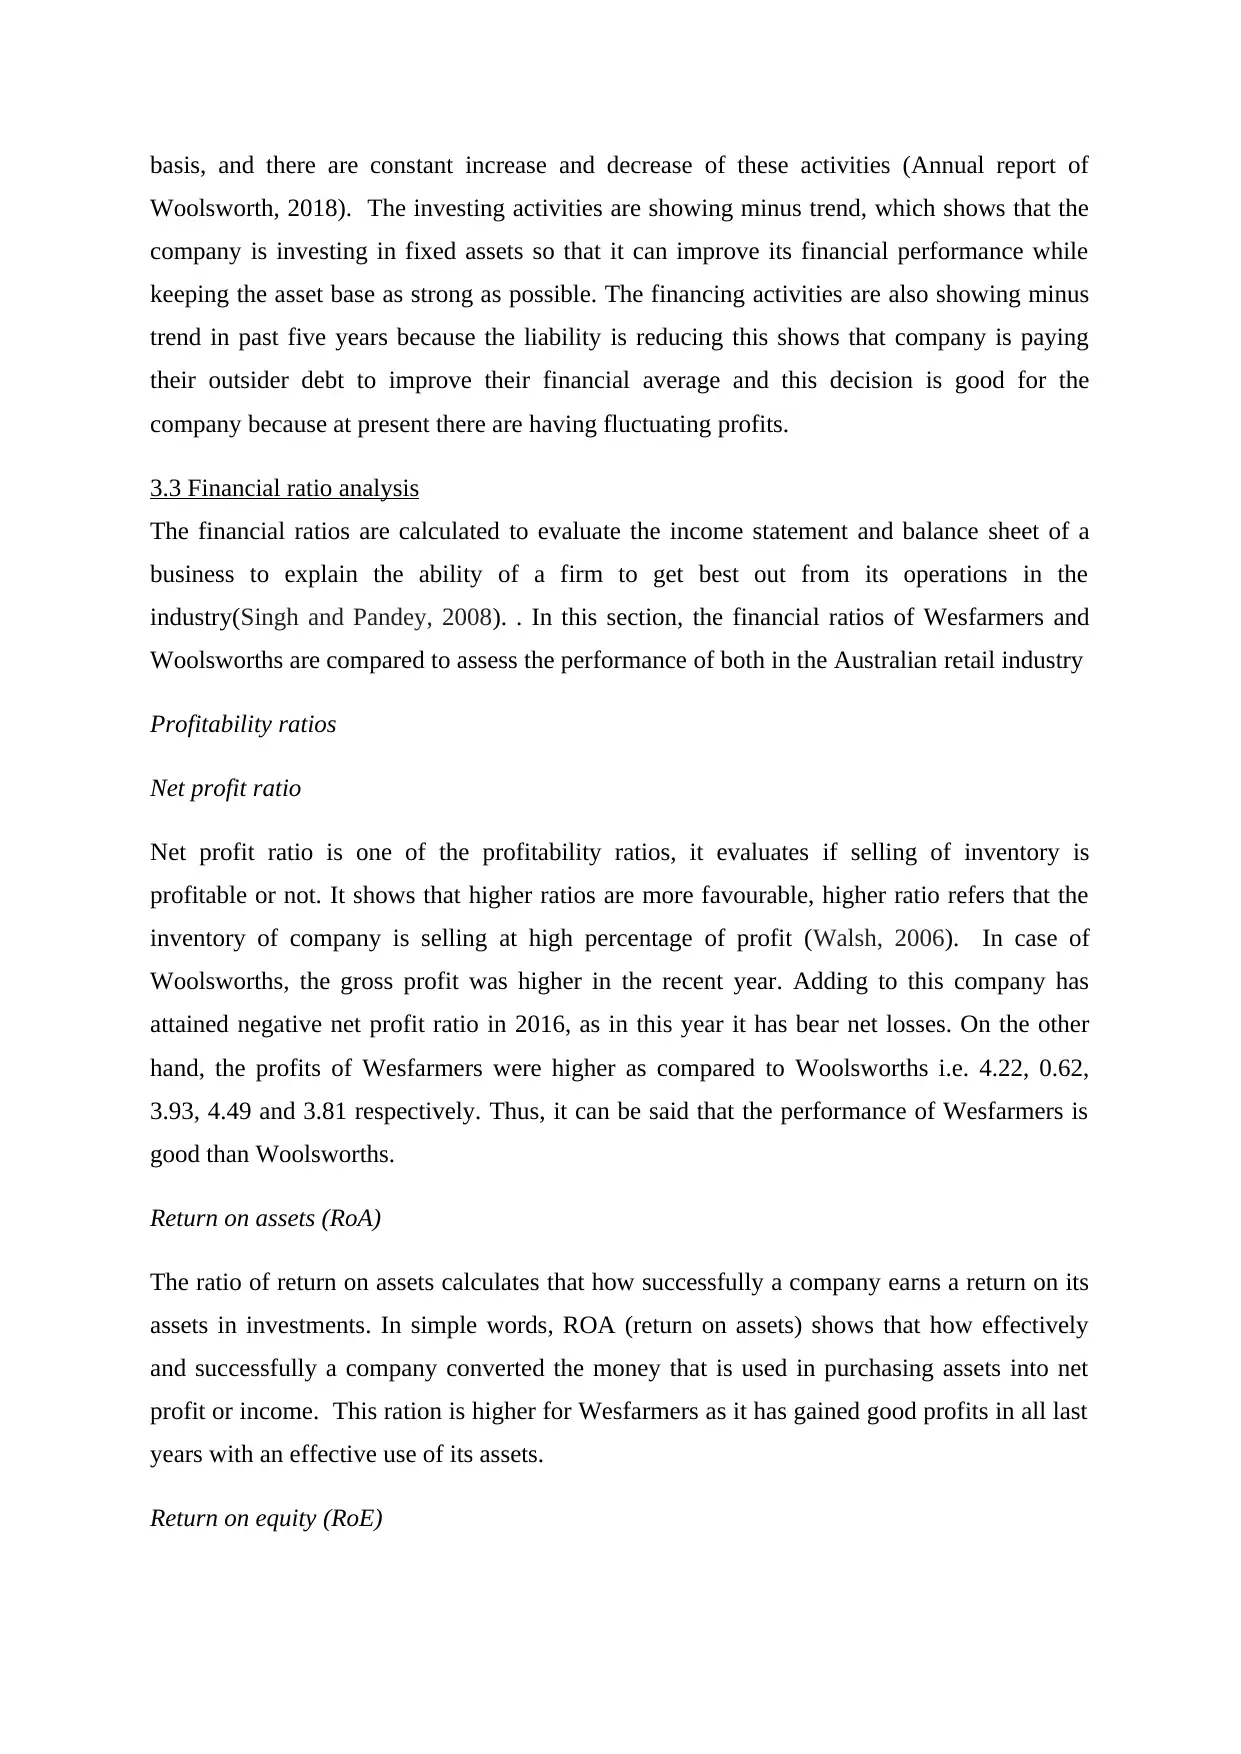
basis, and there are constant increase and decrease of these activities (Annual report of
Woolsworth, 2018). The investing activities are showing minus trend, which shows that the
company is investing in fixed assets so that it can improve its financial performance while
keeping the asset base as strong as possible. The financing activities are also showing minus
trend in past five years because the liability is reducing this shows that company is paying
their outsider debt to improve their financial average and this decision is good for the
company because at present there are having fluctuating profits.
3.3 Financial ratio analysis
The financial ratios are calculated to evaluate the income statement and balance sheet of a
business to explain the ability of a firm to get best out from its operations in the
industry(Singh and Pandey, 2008). . In this section, the financial ratios of Wesfarmers and
Woolsworths are compared to assess the performance of both in the Australian retail industry
Profitability ratios
Net profit ratio
Net profit ratio is one of the profitability ratios, it evaluates if selling of inventory is
profitable or not. It shows that higher ratios are more favourable, higher ratio refers that the
inventory of company is selling at high percentage of profit (Walsh, 2006). In case of
Woolsworths, the gross profit was higher in the recent year. Adding to this company has
attained negative net profit ratio in 2016, as in this year it has bear net losses. On the other
hand, the profits of Wesfarmers were higher as compared to Woolsworths i.e. 4.22, 0.62,
3.93, 4.49 and 3.81 respectively. Thus, it can be said that the performance of Wesfarmers is
good than Woolsworths.
Return on assets (RoA)
The ratio of return on assets calculates that how successfully a company earns a return on its
assets in investments. In simple words, ROA (return on assets) shows that how effectively
and successfully a company converted the money that is used in purchasing assets into net
profit or income. This ration is higher for Wesfarmers as it has gained good profits in all last
years with an effective use of its assets.
Return on equity (RoE)
⊘ This is a preview!⊘
Do you want full access?
Subscribe today to unlock all pages.
Trusted by 1+ million students worldwide
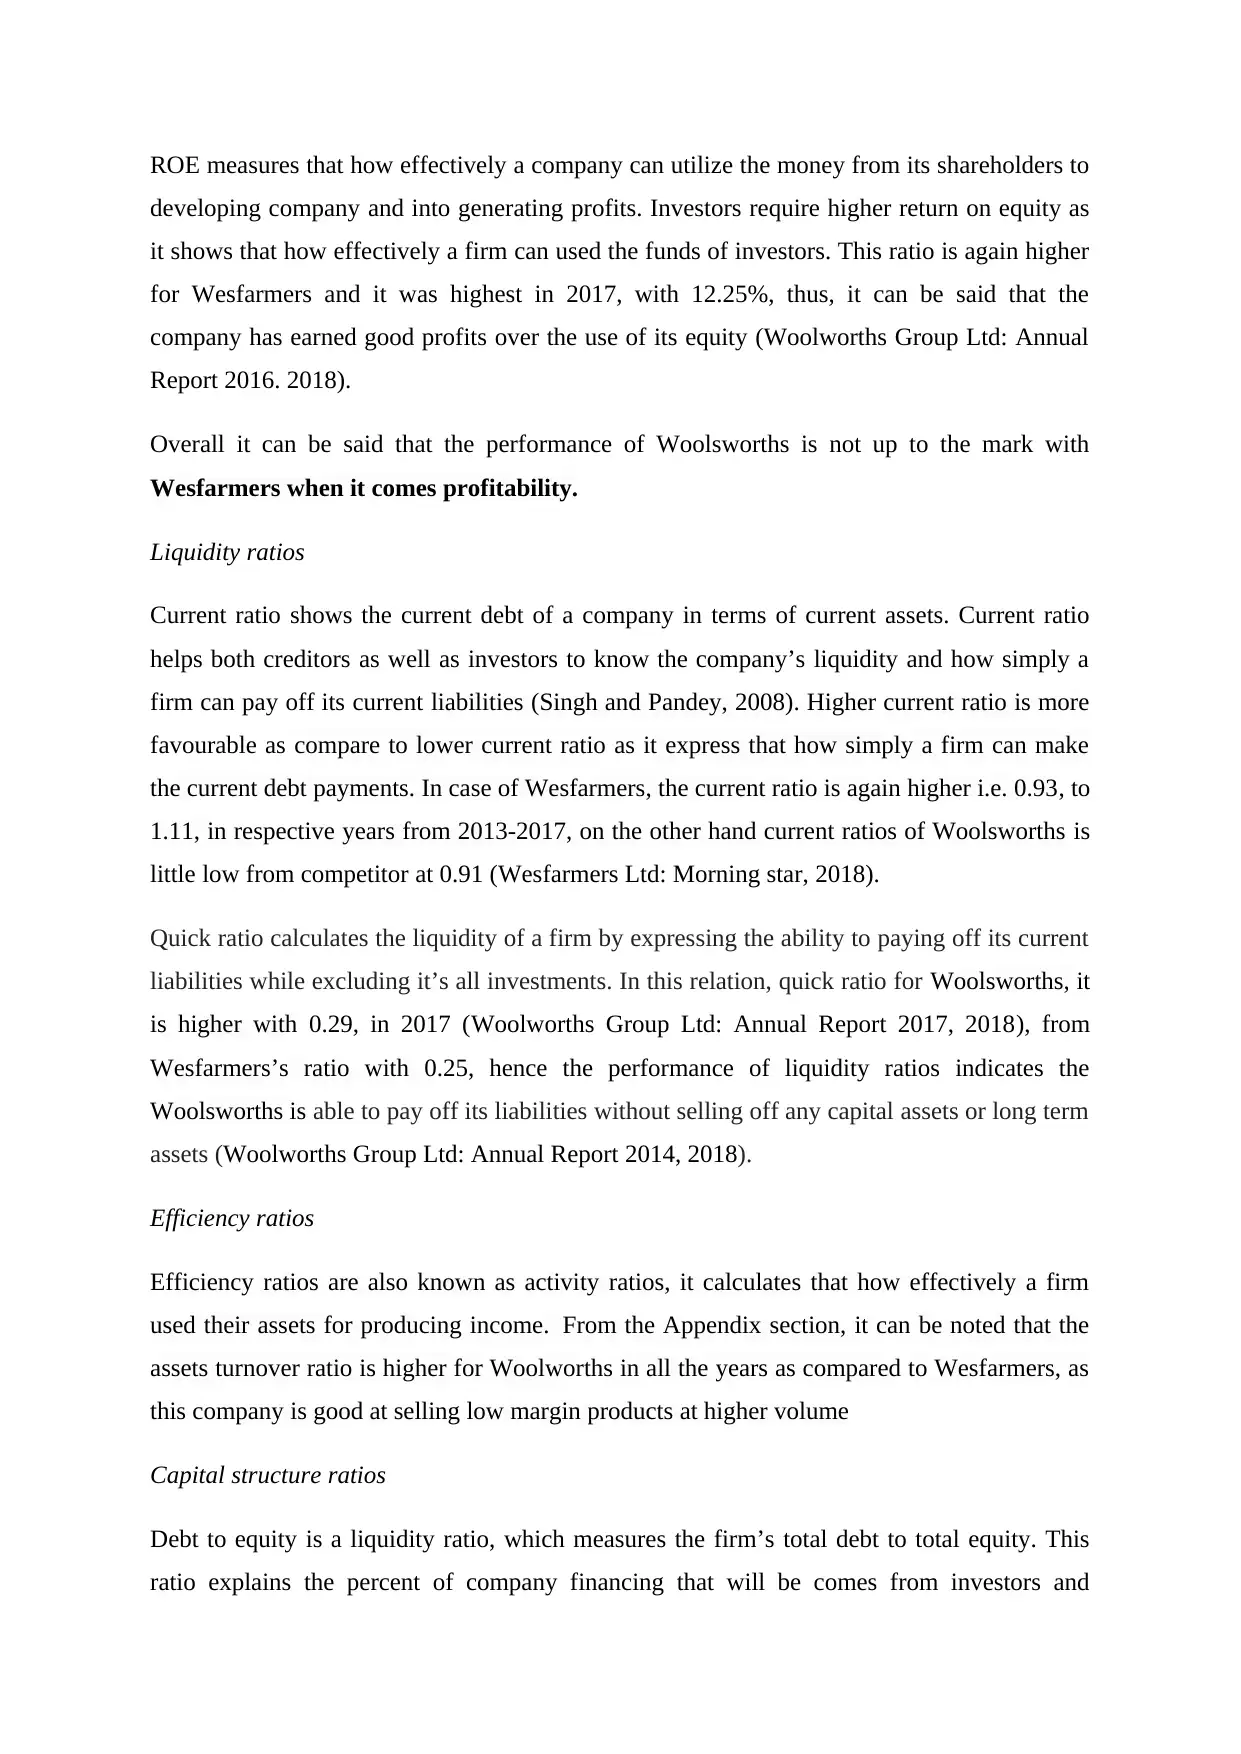
ROE measures that how effectively a company can utilize the money from its shareholders to
developing company and into generating profits. Investors require higher return on equity as
it shows that how effectively a firm can used the funds of investors. This ratio is again higher
for Wesfarmers and it was highest in 2017, with 12.25%, thus, it can be said that the
company has earned good profits over the use of its equity (Woolworths Group Ltd: Annual
Report 2016. 2018).
Overall it can be said that the performance of Woolsworths is not up to the mark with
Wesfarmers when it comes profitability.
Liquidity ratios
Current ratio shows the current debt of a company in terms of current assets. Current ratio
helps both creditors as well as investors to know the company’s liquidity and how simply a
firm can pay off its current liabilities (Singh and Pandey, 2008). Higher current ratio is more
favourable as compare to lower current ratio as it express that how simply a firm can make
the current debt payments. In case of Wesfarmers, the current ratio is again higher i.e. 0.93, to
1.11, in respective years from 2013-2017, on the other hand current ratios of Woolsworths is
little low from competitor at 0.91 (Wesfarmers Ltd: Morning star, 2018).
Quick ratio calculates the liquidity of a firm by expressing the ability to paying off its current
liabilities while excluding it’s all investments. In this relation, quick ratio for Woolsworths, it
is higher with 0.29, in 2017 (Woolworths Group Ltd: Annual Report 2017, 2018), from
Wesfarmers’s ratio with 0.25, hence the performance of liquidity ratios indicates the
Woolsworths is able to pay off its liabilities without selling off any capital assets or long term
assets (Woolworths Group Ltd: Annual Report 2014, 2018).
Efficiency ratios
Efficiency ratios are also known as activity ratios, it calculates that how effectively a firm
used their assets for producing income. From the Appendix section, it can be noted that the
assets turnover ratio is higher for Woolworths in all the years as compared to Wesfarmers, as
this company is good at selling low margin products at higher volume
Capital structure ratios
Debt to equity is a liquidity ratio, which measures the firm’s total debt to total equity. This
ratio explains the percent of company financing that will be comes from investors and
Paraphrase This Document
Need a fresh take? Get an instant paraphrase of this document with our AI Paraphraser
creditors. In relation to this, the performance of Woolsworths is better because the ratio is
higher in all the years as compared to Wesfarmers. The Debt and equity of Woolsworths are
more balance as compared to its competitor.
4. CONCLUSION
On the basis of financial statement analysis and ratio calculation, it can be concluded that
Woolworth is seeking to maintain an overall good financial position and is in pursuit of
making a solid financial base by continuously making improvement in its activities, services,
gaps and improvement areas. However, it can be said that company can perform even better
by overcoming with its loopholes and issues present in the related financial activities, by this
improvement the company would be unstoppable to become the most reputed and leading
retail trader and organization of the country.
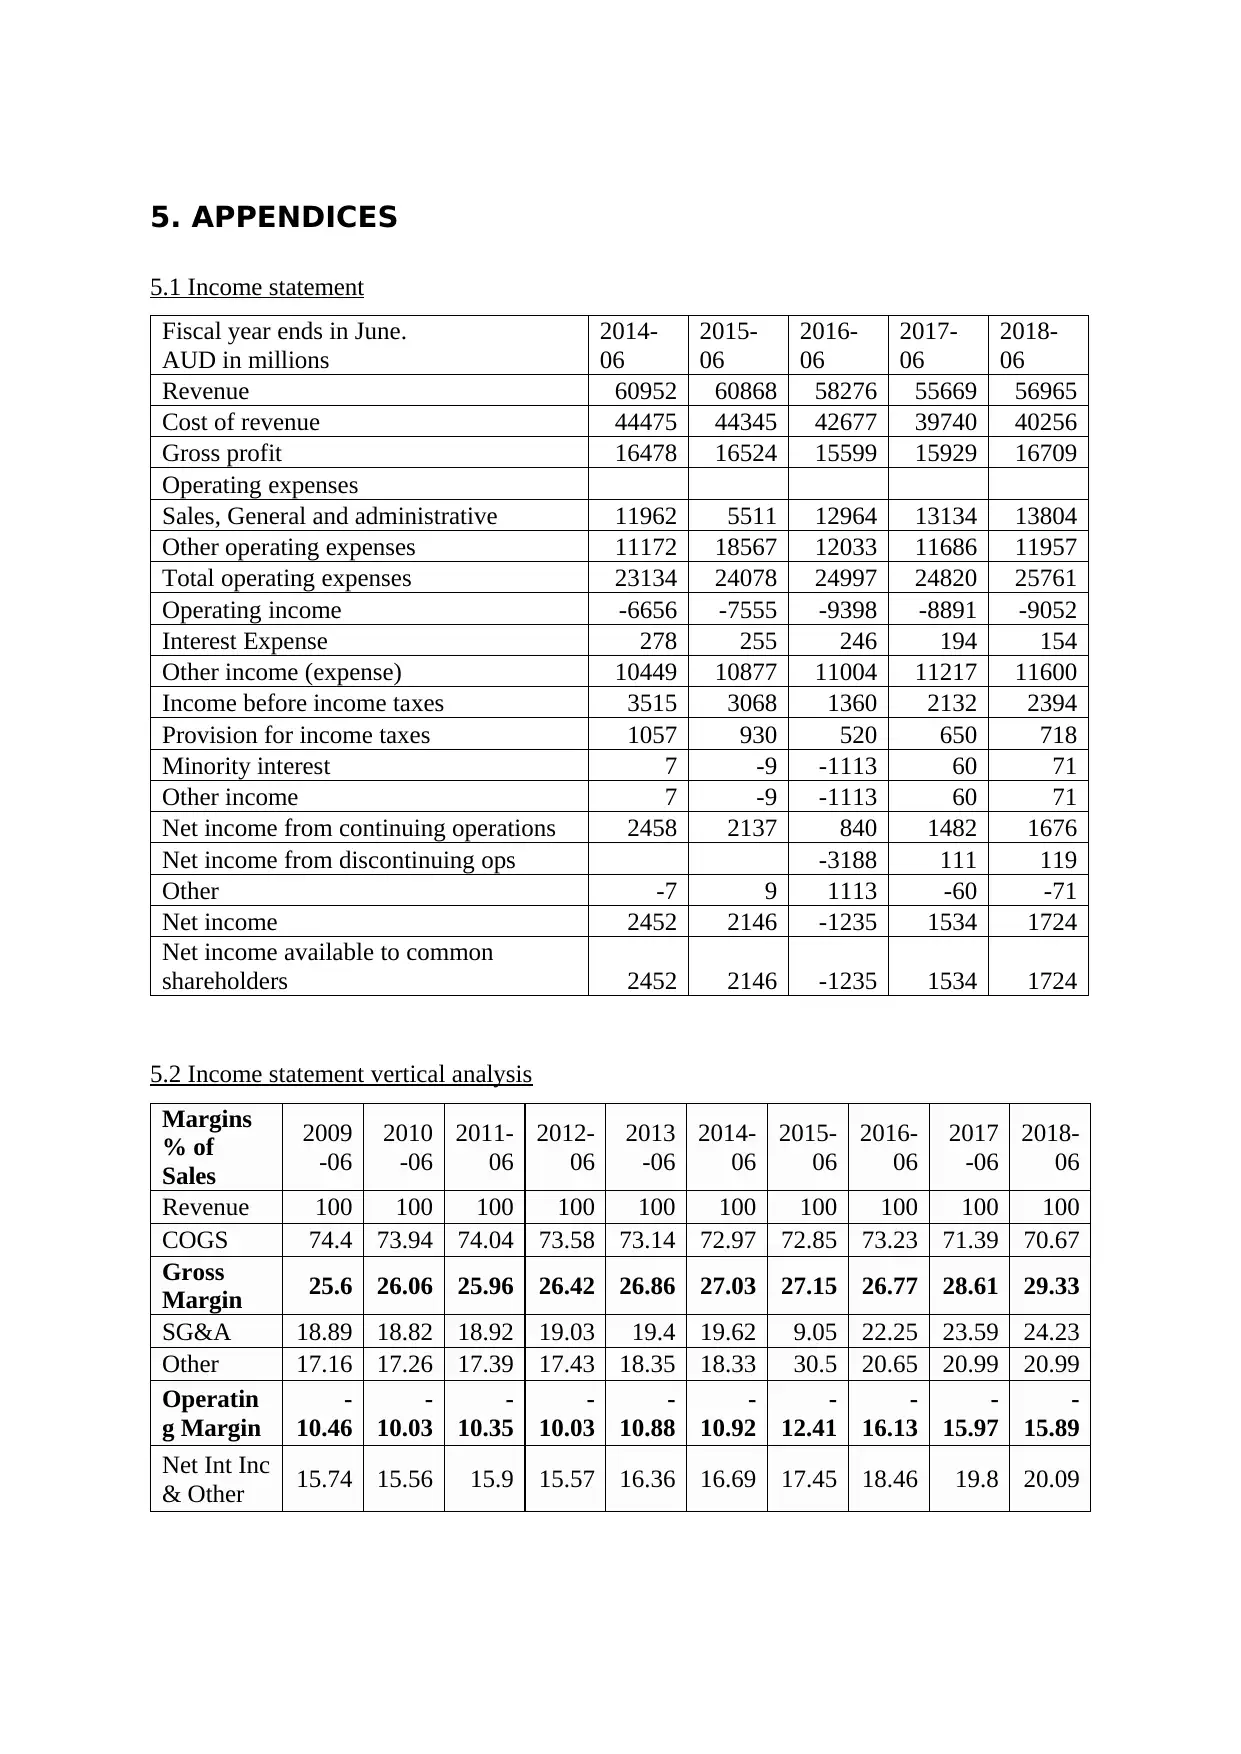
5. APPENDICES
5.1 Income statement
Fiscal year ends in June.
AUD in millions
2014-
06
2015-
06
2016-
06
2017-
06
2018-
06
Revenue 60952 60868 58276 55669 56965
Cost of revenue 44475 44345 42677 39740 40256
Gross profit 16478 16524 15599 15929 16709
Operating expenses
Sales, General and administrative 11962 5511 12964 13134 13804
Other operating expenses 11172 18567 12033 11686 11957
Total operating expenses 23134 24078 24997 24820 25761
Operating income -6656 -7555 -9398 -8891 -9052
Interest Expense 278 255 246 194 154
Other income (expense) 10449 10877 11004 11217 11600
Income before income taxes 3515 3068 1360 2132 2394
Provision for income taxes 1057 930 520 650 718
Minority interest 7 -9 -1113 60 71
Other income 7 -9 -1113 60 71
Net income from continuing operations 2458 2137 840 1482 1676
Net income from discontinuing ops -3188 111 119
Other -7 9 1113 -60 -71
Net income 2452 2146 -1235 1534 1724
Net income available to common
shareholders 2452 2146 -1235 1534 1724
5.2 Income statement vertical analysis
Margins
% of
Sales
2009
-06
2010
-06
2011-
06
2012-
06
2013
-06
2014-
06
2015-
06
2016-
06
2017
-06
2018-
06
Revenue 100 100 100 100 100 100 100 100 100 100
COGS 74.4 73.94 74.04 73.58 73.14 72.97 72.85 73.23 71.39 70.67
Gross
Margin 25.6 26.06 25.96 26.42 26.86 27.03 27.15 26.77 28.61 29.33
SG&A 18.89 18.82 18.92 19.03 19.4 19.62 9.05 22.25 23.59 24.23
Other 17.16 17.26 17.39 17.43 18.35 18.33 30.5 20.65 20.99 20.99
Operatin
g Margin
-
10.46
-
10.03
-
10.35
-
10.03
-
10.88
-
10.92
-
12.41
-
16.13
-
15.97
-
15.89
Net Int Inc
& Other 15.74 15.56 15.9 15.57 16.36 16.69 17.45 18.46 19.8 20.09
⊘ This is a preview!⊘
Do you want full access?
Subscribe today to unlock all pages.
Trusted by 1+ million students worldwide
1 out of 22
Related Documents


Your All-in-One AI-Powered Toolkit for Academic Success.
+13062052269
info@desklib.com
Available 24*7 on WhatsApp / Email
![[object Object]](/_next/static/media/star-bottom.7253800d.svg)
Unlock your academic potential
Copyright © 2020–2026 A2Z Services. All Rights Reserved. Developed and managed by ZUCOL.